Dashboards
Overview
Sugar Market lets you view and configure dashboards and follow the Buyer's Journey to provide valuable insight into your emails and events. Each available dashboard contains dashlets that you can move around and drill through for more information. This page explains the available Sugar Market dashboards and the metrics they display.
Working with Dashboards
The following dashboards are included in Sugar Market:
- Global Dashboard
- Email Dashboard
- Web and Social Dashboard
- Pages and Forms Dashboard
- Leads and Scoring Dashboard
- Nurtures Dashboard
Accessing Dashboards
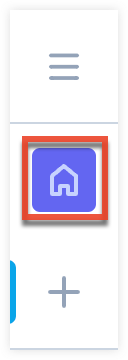
The Global Dashboard loads as your home page when you log into Sugar Market. Click the home icon in the navigation bar to return to the Global Dashboard from any location in Sugar Market.
To access other dashboards:
- In the navigation bar, click the Analytics module.
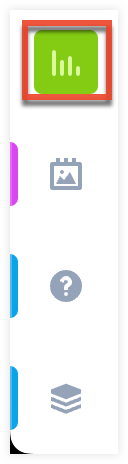
- Select "Dashboards".
Customizing Dashboards
You can customize your dashboard by moving dashlets and managing which dashlets are displayed. Your changes will be saved automatically and do not affect other users' views.
Moving Your Dashlets
To move dashlets on your dashboard, follow these steps:
- Click the dashlet you want to move.
- Drag and drop the dashlet to the desired location on your dashboard.
Adding and Removing Your Dashlets
Adding and removing dashlets is only possible in your Global Dashboard. See the Global Dashboard section for more information.
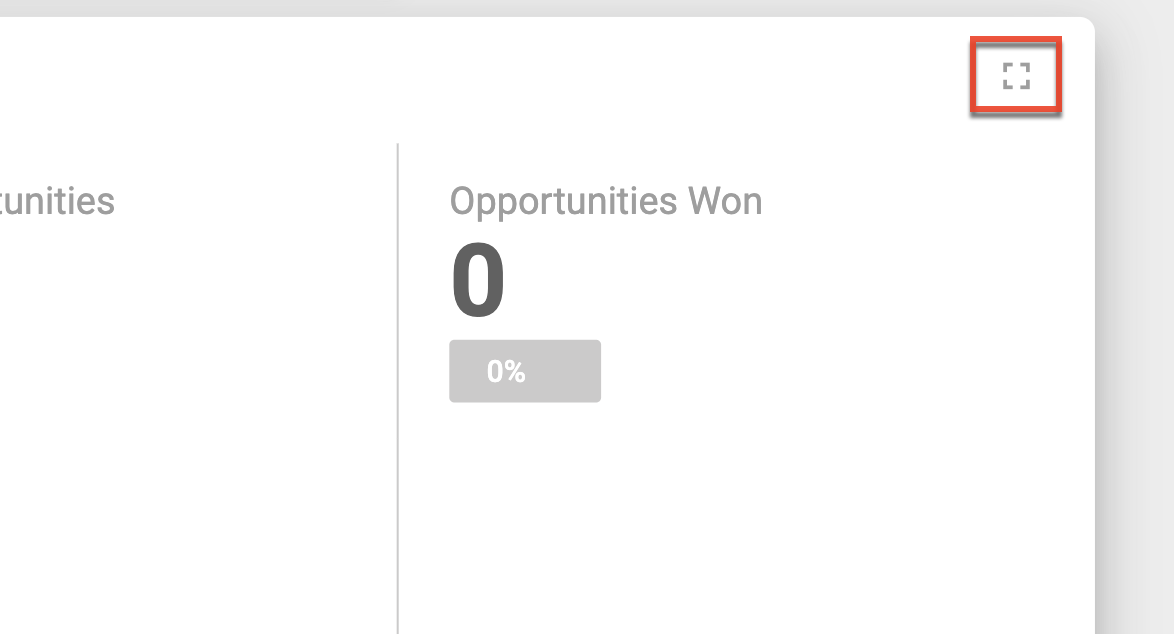
Exporting from Dashboards
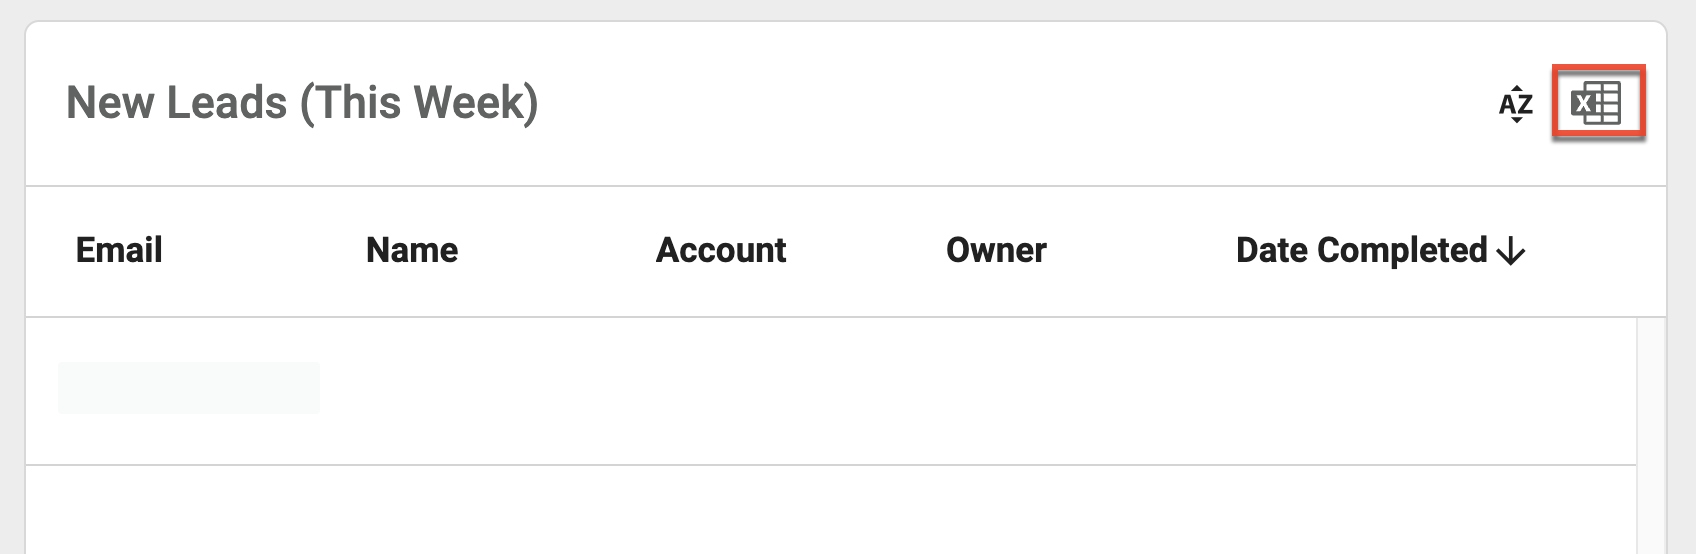
Sugar Market lets you view and download raw data displayed in a data table with no limitations. To export the data from a dashlet, drill into the dashlet and click the export icon near the top right of the data table. The .CSV file will save to your specified download folder on your machine or in the cloud.
 d
d
Dashboard Drill-Through
Another valuable feature of dashlet data visualization is the ability to drill-through to data points as much or as little as you want. To drill through, click on the drill-through icon in the top right of each dashlet, or double-click on the data point you wish to view. Depending on the table you drilled through, certain values are displayed underlined and in blue. These values indicate that you can click them and drill through further into that individual entity.
A feature of drill-through capabilities is your ability to drill-through to an entity from the data table. For example, by clicking on values such as the email address in the data table, Sugar Market will open the corresponding Lead or Contact Card. From there, you can review the lead/contact's buyer's journey, or send an email to sales, enabling you to take immediate action seamlessly from the dashboard experience.
Any dashlet's drill-through data can be sorted by clicking the column name you wish to sort by within the displayed table.
Global Dashboard
Also referred to as your "home page", the Global Dashboard gauges your overall performance across the platform by surfacing statistics and data from different functions, such as the total amount of new leads and opportunities, your deliverability statistics, and quick email statistics. All users can view the Global Dashboard, but users without permissions to specific data will be prevented from drilling down into that data from the Global Dashboard.
The Global Dashboard allows you to compare your current performance to your past performance by weekly, monthly, and quarterly views. The Global Dashboard displays this data using comparisons so you can see trends, discover areas that need improvement, and benchmark success.
Adding and Removing Your Dashlets
Use the following steps to manage which dashlets are displayed on your Global Dashboard:
- Click the pencil icon at the top of your Global Dashboard.
- From the dropdown menu click the title of the dashlet you want to remove or add to your dashboard. Visible dashlets are displayed in bold with a checkmark.
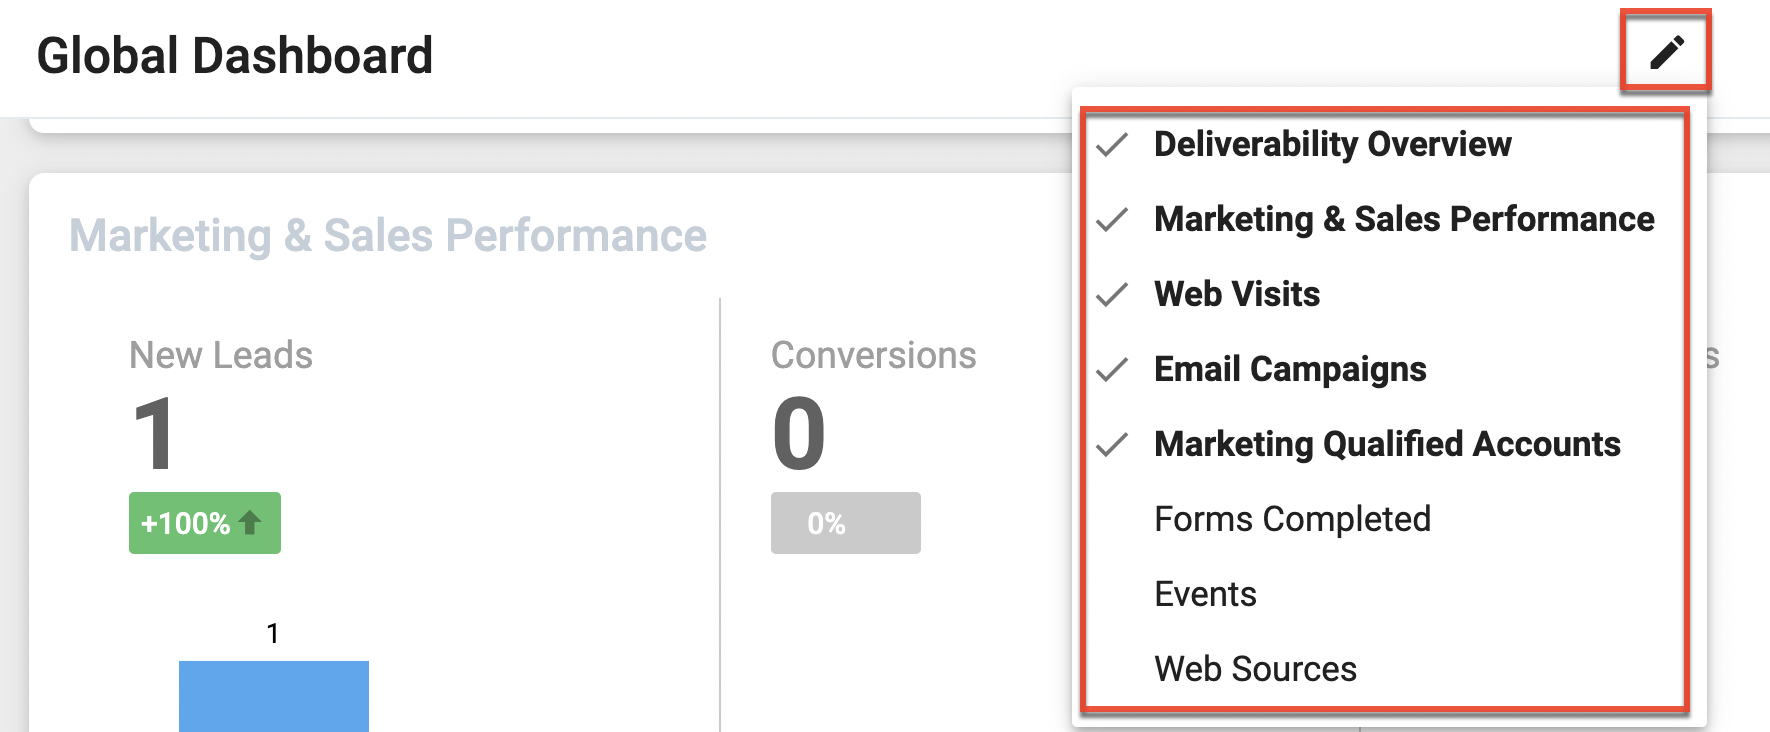
Note: When you remove a dashlet and then add it back to your Global Dashboard it will be placed at the bottom of your existing dashlets.
The Global Dashboard comprises the following dashlets:
- Marketing and Sales Performance
- Email Campaigns
- Deliverability Overview
- Web Visits
- Forms Completed
- Web Sources
- Events
- Marketing Qualified Accounts
Marketing and Sales Performance Dashlet
This dashlet provides a general overview of the progression of your new leads, conversions, opportunities, and opportunities won. The Sales Funnel Snapshot on the home page includes information pulled from your CRM data. Refer to the Opportunities Mapping section of the Sugar Market Integration Guide specific to your CRM to set up the mapping for the Global Dashboard to properly display won and lost opportunities, stages of opportunities, and amount of the opportunities.
The Marketing and Sales Performance dashlet contains the following information:
- New Leads: The number of net new leads in your Sugar Market database with a created date within the selected time frame. This number includes new leads from all sources, including sync from your external CRM, list imports, and form submissions.
- Conversions: The number of unique visitors, based on those who completed a form using their email address, or clicked a link in an email and were issued a cookie within the selected time frame. This references the date/time when the contact was identified. If a contact clears cookies in their browser, and then is re-cookied, the contact will appear in this section again.
- New Opportunities: The number of net new opportunities added to your CRM database with a created date within the selected time frame.
- Opportunities Won: The number of opportunities in Sugar Market with the "won" stage that closed within the selected time frame.
Email Campaigns Dashlet
The Email Campaigns dashlet provides a quick glance of the open and click rate of the five most recent sent emails. To see more statistics on the email, click on the tile to access the Email Dashboard for that email.
Deliverability Overview Dashlet
This dashlet provides an overall view of your deliverability statistics across all emails for the selected time frame. Refer to the Email Dashboard section to learn more about email statistics.
Web Visits Dashlet
The Web Visits dashlet displays the total page views on your website. A visit is when a person lands on any page of your website and begins browsing. A visit counts all visitors regardless of how many times the same visitor has visited your site. Refer to the Web and Social Dashboard section to learn more about web statistics.
Forms Completed Dashlet
The Forms Completed dashlet shows a total count of completes within the selected time frame. When the lead or contact has submitted the final form of a page, they are considered a complete. Refer to the Pages and Forms Dashboard section to learn more about pages and forms statistics.
Web Sources Dashlet
The Web Sources dashlet shows where the traffic to your website is coming from. Specifically, it displays the most common sources within the selected time frame. The most common sources are:
- Organic: A visitor typed your web address directly into the URL bar (also known as direct).
- External Link: A visitor was directed to your website from another blog or site.
- Search: A visitor reached your website via a search engine (e.g. google.com).
- Email Campaign: A visitor reached your website by clicking on a link in an email.
- Paid Search: A visitor reached your website by clicking on a paid search ad.
- Social: A visitor reached your website via a social share (e.g. Facebook).
Visit How Top Web Source Values are Determined to learn more about web source values, including how to create custom categories.
Events Dashlet
The Events dashlet represents an overview of all event registrations and event attendees within the selected time frame.
- Event Registrations: The total number of event registrations across all events.
- Event Attendees: The total number of event attendees across all events within a given date range. If a single customer attends three events, then this number will be three. This number does not represent the unique number of customers who attended events, but the total number of attendees to all events.
Marketing Qualified Accounts Dashlet
The Marketing Qualified Accounts dashlet displays account scores. Using account-based scoring, and the accounts you have flagged as key accounts, the top five scoring accounts are displayed here.
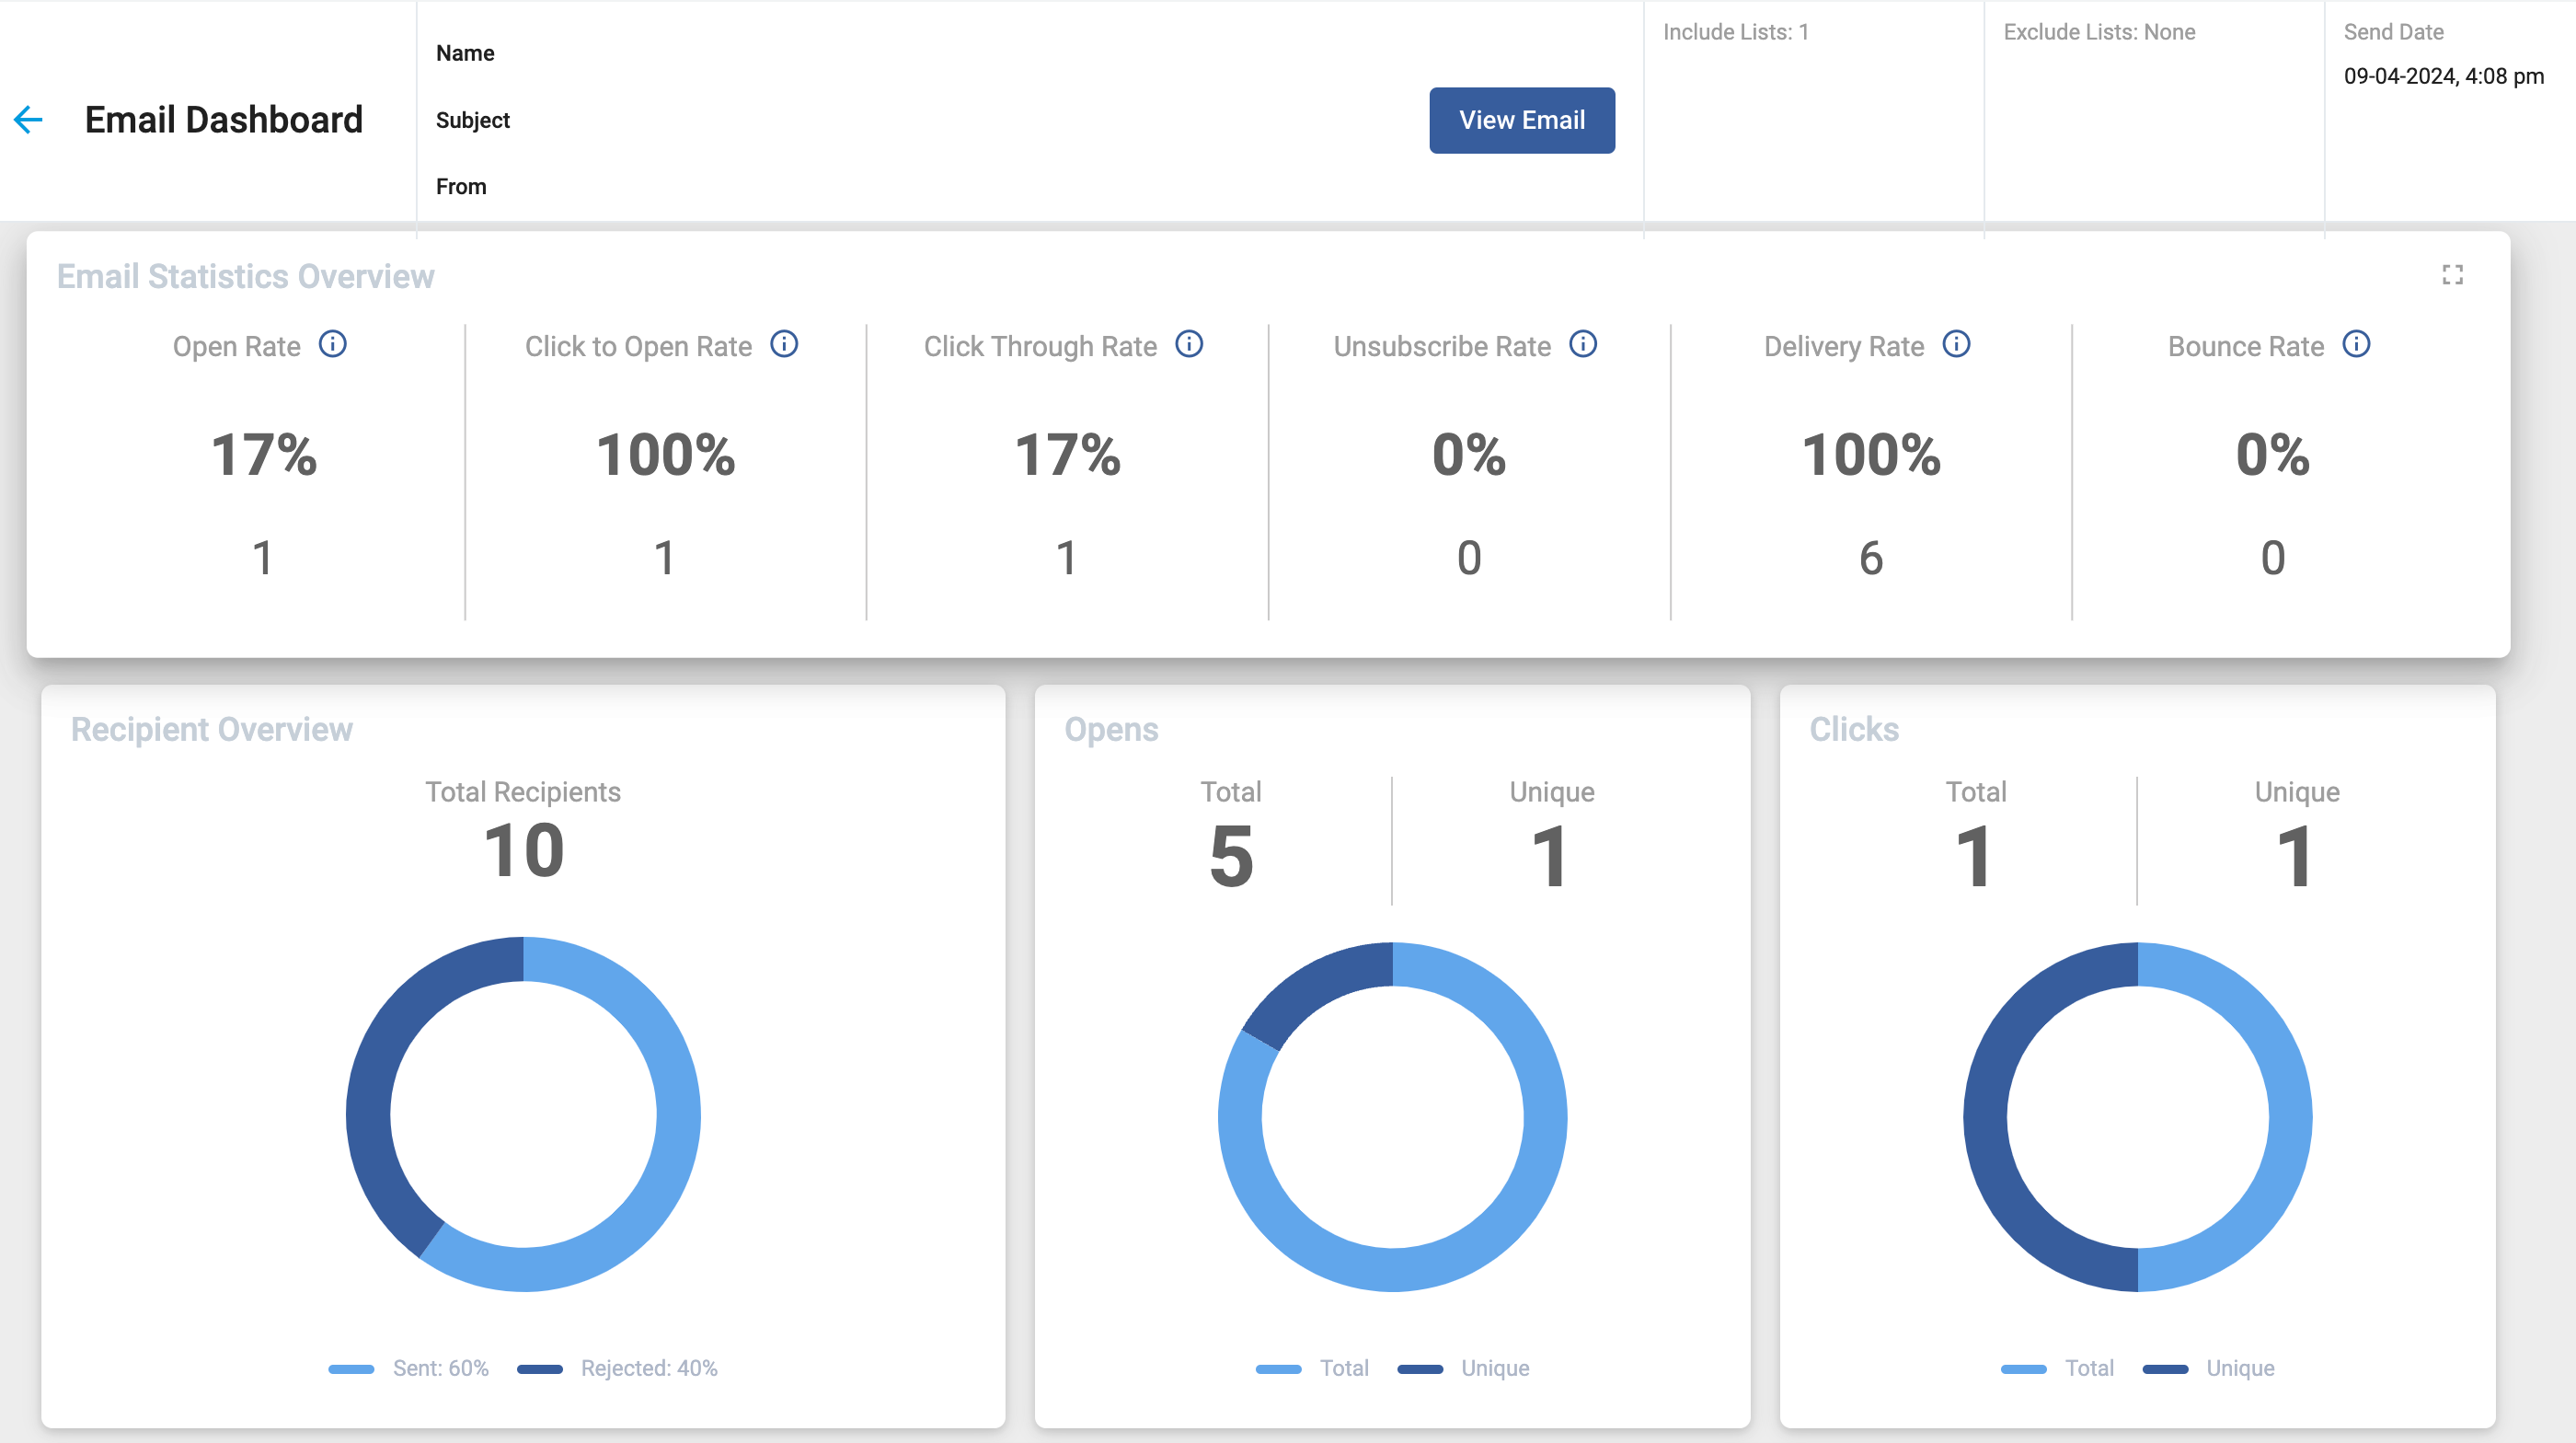
Email Dashboard
The top of the Email Dashboard shows a quick summary of your email's details. Use the View Email button to preview the desktop and mobile versions, and hover over links to see their click counts. Engagement data may not display immediately, as recipient servers send responses at different rates.
Note: The ability to track email engagement is dependent on many factors external to Sugar Market. For example, older devices/operating systems may be unable to open a link in your email due to security concerns.
The Email Dashboard can include the following dashlets:
- Dynamic Content Segments
- Recipient Overview
- Email Statistics Overview
- Opens
- Clicks
- Clicks per Link
- Campaign Source
- Associated Landing Pages
- Advanced A/B Dashboard
Dynamic Content Segments Dashlet
This dashlet allows you to filter the data on your email dashboard by recipients in a segment or segments. To select which segment or segments you want to filter by, click the Report Options button.
Note: This dashlet will only be available for emails that include dynamic options or content.
Recipient Overview Dashlet
Total count of recipients included in the email. A recipient is defined as any email address that has been added to the email, including any duplicates and rejected email addresses.
Note: The Recipient Overview dashlet does not include recipients that bounced from the email. Recipients that have bounced from a previous email will be counted as rejected recipients.
- Sent: Number of recipients that were sent an email, excluding rejected recipients. Sent emails are divided into the following four categories:
- On Hold: If the user has allotted a limit on email sends and has surpassed that limit, the emails are held from deployment.
- Delivered: Emails that were successfully received in the recipient's inbox.
- Bounced: Email addresses that have hard bounced or soft bounced. If an email soft bounces fifteen times, it is considered a hard bounce.
- Unconfirmed: The recipient's email server has not reported whether it has been successfully delivered into the inbox or bounced. Unconfirmed recipients eventually move to either the Delivered or Bounced category.
- Rejected: Recipients that were not sent the email due to the following reasons:
- Already Unsubscribed: Recipients that have unsubscribed from a previous email and have opted out of further communication.
- Already Undeliverable: Email addresses that are considered undeliverable because they have hard or soft bounced fifteen times in the past.
- Throttled: The email was not sent due to a previous email send that was set with a throttle of X amount of days.
- Invalid: Sugar Market rejected the email due to a misconfiguration (e.g. an email missing the @ symbol, or a bad reply-to address).
- Suppressed: The email was not sent due to the email address being on a suppression list, is on a trigger exclude list, or the trigger is set to inactive.
- Canceled: The recipients that were in the To Be Mailed queue or encoding queue that have been removed due to a user canceling the email.
- Unsubscribes: Recipients who have unsubscribed from the specific email.
Email Statistics Overview Dashlet
- Open Rate: Percentage of recipients that have opened your email at least once. This does not take into account how many times each recipient has opened it. The percentage is calculated by the count of unique opens divided by the count of emails delivered.
- Click to Open Rate: Percentage of recipients that have opened your email and clicked on at least one link within the email. This does not take into account repeat clicks and ignores the unsubscribe link. The percentage is calculated by the count of unique clicks divided by the count of unique opens.
- Click Through Rate: Percentage of delivered emails that have had at least one link clicked within the email. The percentage is calculated by the count of unique clicks divided by the count of delivered emails.
- Unsubscribe Rate: Percentage of recipients who have unsubscribed using the unsubscribe link within the email. The percentage is calculated by the count of unsubscribes divided by the count of delivered emails.
- Delivery Rate: Percentage of emails that were successfully delivered. The percentage is calculated by the count of delivered emails divided by the count of sent emails.
- Bounce Rate: Percentage of email addresses that have hard or soft bounced. If an email soft bounces fifteen times, it is considered a hard bounce. The percentage is calculated by the count of bounced emails divided by the count of delivered emails.
Opens Dashlet
This dashlet displays the total opens and unique opens for your email. You can drill into the chart to see who opened your email, how many times they opened it, and when they opened it last.
Clicks Dashlet
This dashlet displays the total clicks and unique clicks for your email. You can drill into the chart to see who clicked a link in your email, how many times they clicked links, and when they last clicked a link.
Clicks per Link Dashlet
This dashlet shows your top five best-performing links in your email, the number of times each link was clicked, and the number of unique clicks for each link. Drill into this dashlet to see all your links and their statistic as well as who clicked on that link and at what time.
Campaign Source Dashlet
This statistic is applicable only for A/B and Advanced A/B testing, indicating the email version the recipient received. The stats for those who received email A have the Email Source of A, those who received Email B have the Email Source of B.
Associated Landing Pages Dashlet
This dashlet shows the email's associated landing page's statistics. Each associated landing page has its own section that displays the total amount of landing page visits directly generated from your call to action on the email. It also includes the count of completes that resulted directly from the call-to-action visits. The statistics exclude visits/completes that occurred from those who did not receive and engage with the email.
Advanced A/B Dashboard Dashlet
There are a few differences in the Email Dashboard for an Advanced A/B test email. There are three groups of statistics (sample group, optimized group, and combined group), and each has its own specific data.
Sample Group
The sample group is a percentage of your total recipients that receive the A version or the B version and determines which version will be sent as the final optimized version. When viewing the sample group, A/B dashboard includes the following:
- The header shows the different Subject Lines and From Email Address for A and B.
- The sample group send date.
- The winning version displays a "trophy cup" next to the winning email's subject line.
- Email statistics such as opens, clicks, unsubscribes, and bounces are split and shown between the A send and the B send.
- Recipients for the A send and the B send are shown separately.
- Calculations are based on total opens/clicks, not unique opens/clicks.
Optimized Group
The optimized group is made up of the recipients that received the winning version. The statistics are shown as a regular email and the final send date is included.
Combined Group
The combined group shows the statistics of both the optimized and sample group recipients combined. The Sample group and Optimized group send date and preference differences are shown.
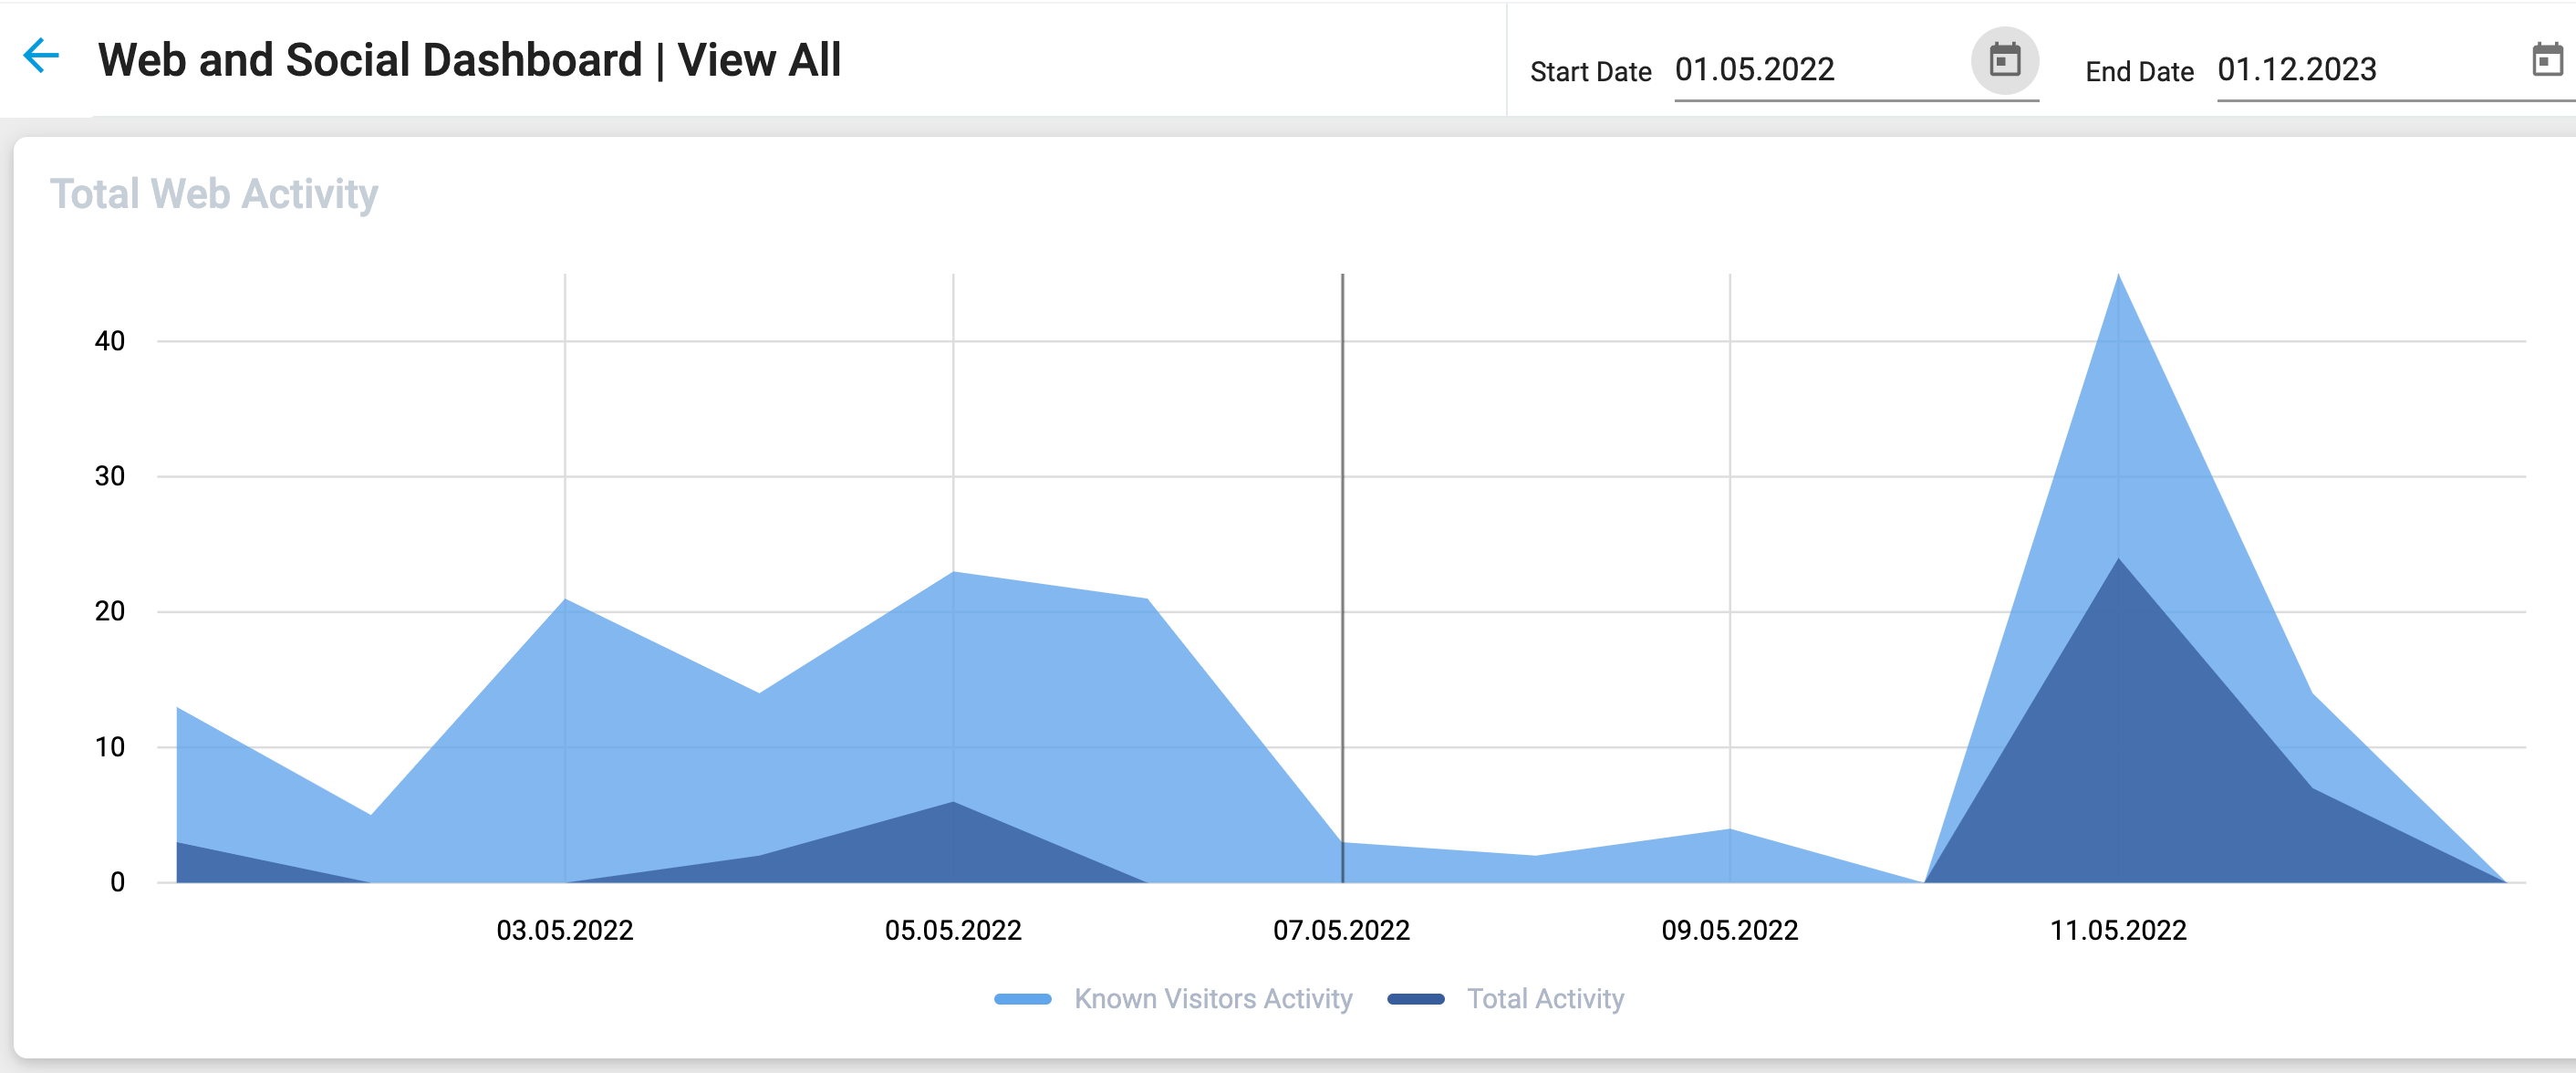
Web and Social Dashboard
The Web and Social Dashboard comprises the following dashlets:
- Web Activity Definitions
- Total Web Activity
- Total Known Visitor Activity
- Top Web Sources
- Top Pages
- Top Referrers
- Activity by Country
Web Activity Definitions
- Visit: A visit is when an individual lands on any page of your website and begins browsing. A visit counts all visitors regardless of how many times the same visitor has visited your site.
- Unique Visit: A unique visit is counted when the visitor lands on your page for the very first time. Every subsequent visit is no longer considered a unique visit. Sugar Market can track a visit as unique by the IP address of the computer and the cookie, as long as cookies are enabled on the visitor's computer.
- Pageview: Also known as an impression, this is when a visitor lands on your website and browses around to other pages. Each individual page the visitor views is considered a pageview during a single visit.
- Known Visit: When a visitor lands on your website and cookies are enabled, Sugar Market's tracking script drops a cookie. When that visitor fills a landing page or clicks an email link that redirects to your website, Sugar Market can connect that cookie to a specific record. At this point, the visitor is a "Known Visitor" and all the web activity that is connected to this cookie is a "Known Visit." Web Activity statistics that are from a Known Visitor contain an email address.
- Traffic Sources: Where the traffic to your website is coming from. The most common sources are:
- Organic: The visitor typed your web address directly into the URL bar (also known as direct).
- External Link: A visitor was directed to your website from another blog or site.
- Search: The visitor reached your website via a search engine (e.g. google.com).
- Email Campaign: The visitor reached your website by clicking on a link in an email.
- Paid Search: The visitor reached your website by clicking on a paid search ad.
- Social: The visitor reached your website via a social share (e.g. Facebook).
Total Web Activity
The Total Web Activity dashlet shows every page that a visitor landed on that has the Sugar Market tracking script. If a user lands on the same page five times within one visit, then that counts as five towards your total activity.
Total Known Visitor Activity
The Total Known Visitor Activity dashlet counts of all the Web Activity from a known visitor.
Top Web Sources
The Top Web Sources dashlet tracks the traffic sources that have directed the most traffic to your website.
Top Pages
The Top Pages dashlet shows the pages that have received the most amount of hits.
Top Referrers
The Top Referrers dashlet displays the websites that are driving the most traffic to your website.
Activity by Country
The Activity by Country dashlet displays where your web traffic is originating from on a world map.
Pages and Forms Dashboard
The Pages and Forms Dashboard displays the number of pages and forms completed within the selected time frame. Locate the Pages and Forms Dashboard in the Dashboards Other categories grouping.
The Pages and Forms Dashboard comprises the following dashlets:
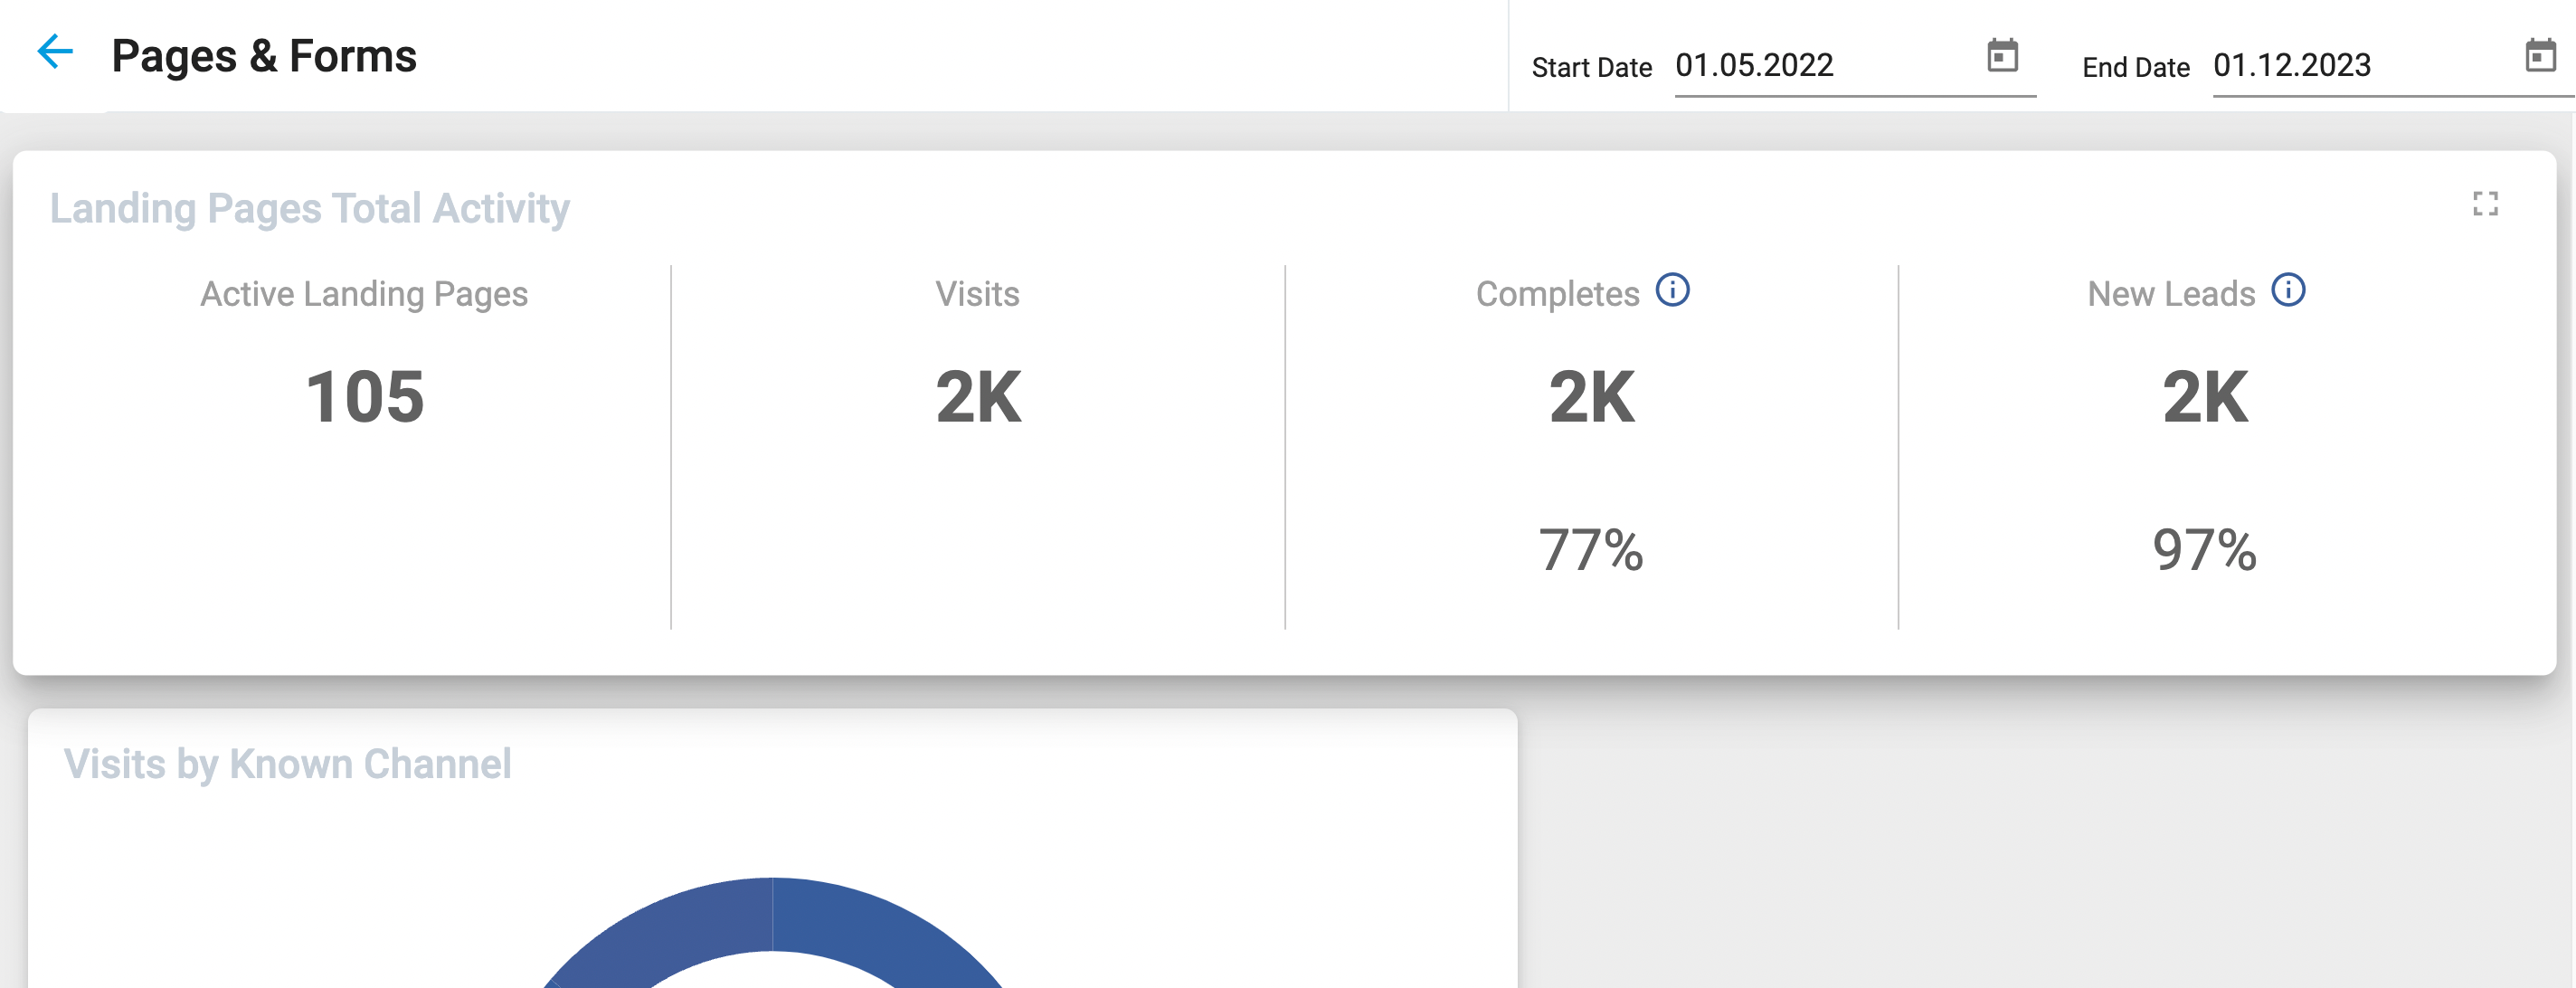
Landing Pages Total Activity Dashlets
The Total Activity dashlet is a composite of six data points:
- Active Landing Pages: A count of the total amount of active pages that can be accessed by your leads and contacts.
- Visits: A visit to a landing page, also referred to as a start, is when a lead or contact opens your page. The visitor does not have to begin filling out the form on the page to be considered a visit.
- Completes: When the lead or contact has submitted the final form of a page, they are considered a complete.
- Completes percentage: The amount of completes relative to your page visits. This is calculated by dividing the count of completes by the count of visits.
- New Leads: The count of new leads that were created in your database by completing a page.
- New Leads percentage: The amount of new leads relative to your page completes. This is calculated by dividing the amount of New Leads from Pages by the count of Page Completes.
Visits by Known Channel Dashlet
The Visits by Known Channel dashlet displays a pie graph showing the top eight sources generating the most traffic to your landing pages. When drilling down into the Email Campaign channel, a Channel column displays the name of the email that generated a visit.
Known Lead Sources Dashlet
The Lead Sources dashlet displays the sources of the contacts completing your pages. This data helps you understand which segment of your database is generating the most page completes.
Top Pages and Forms Dashlet
The Top Pages and Forms dashlet displays the top ten landing pages with the most completes within the selected time frame. Click the landing page title above the drill-down table to drill into the landing page for more reporting options.
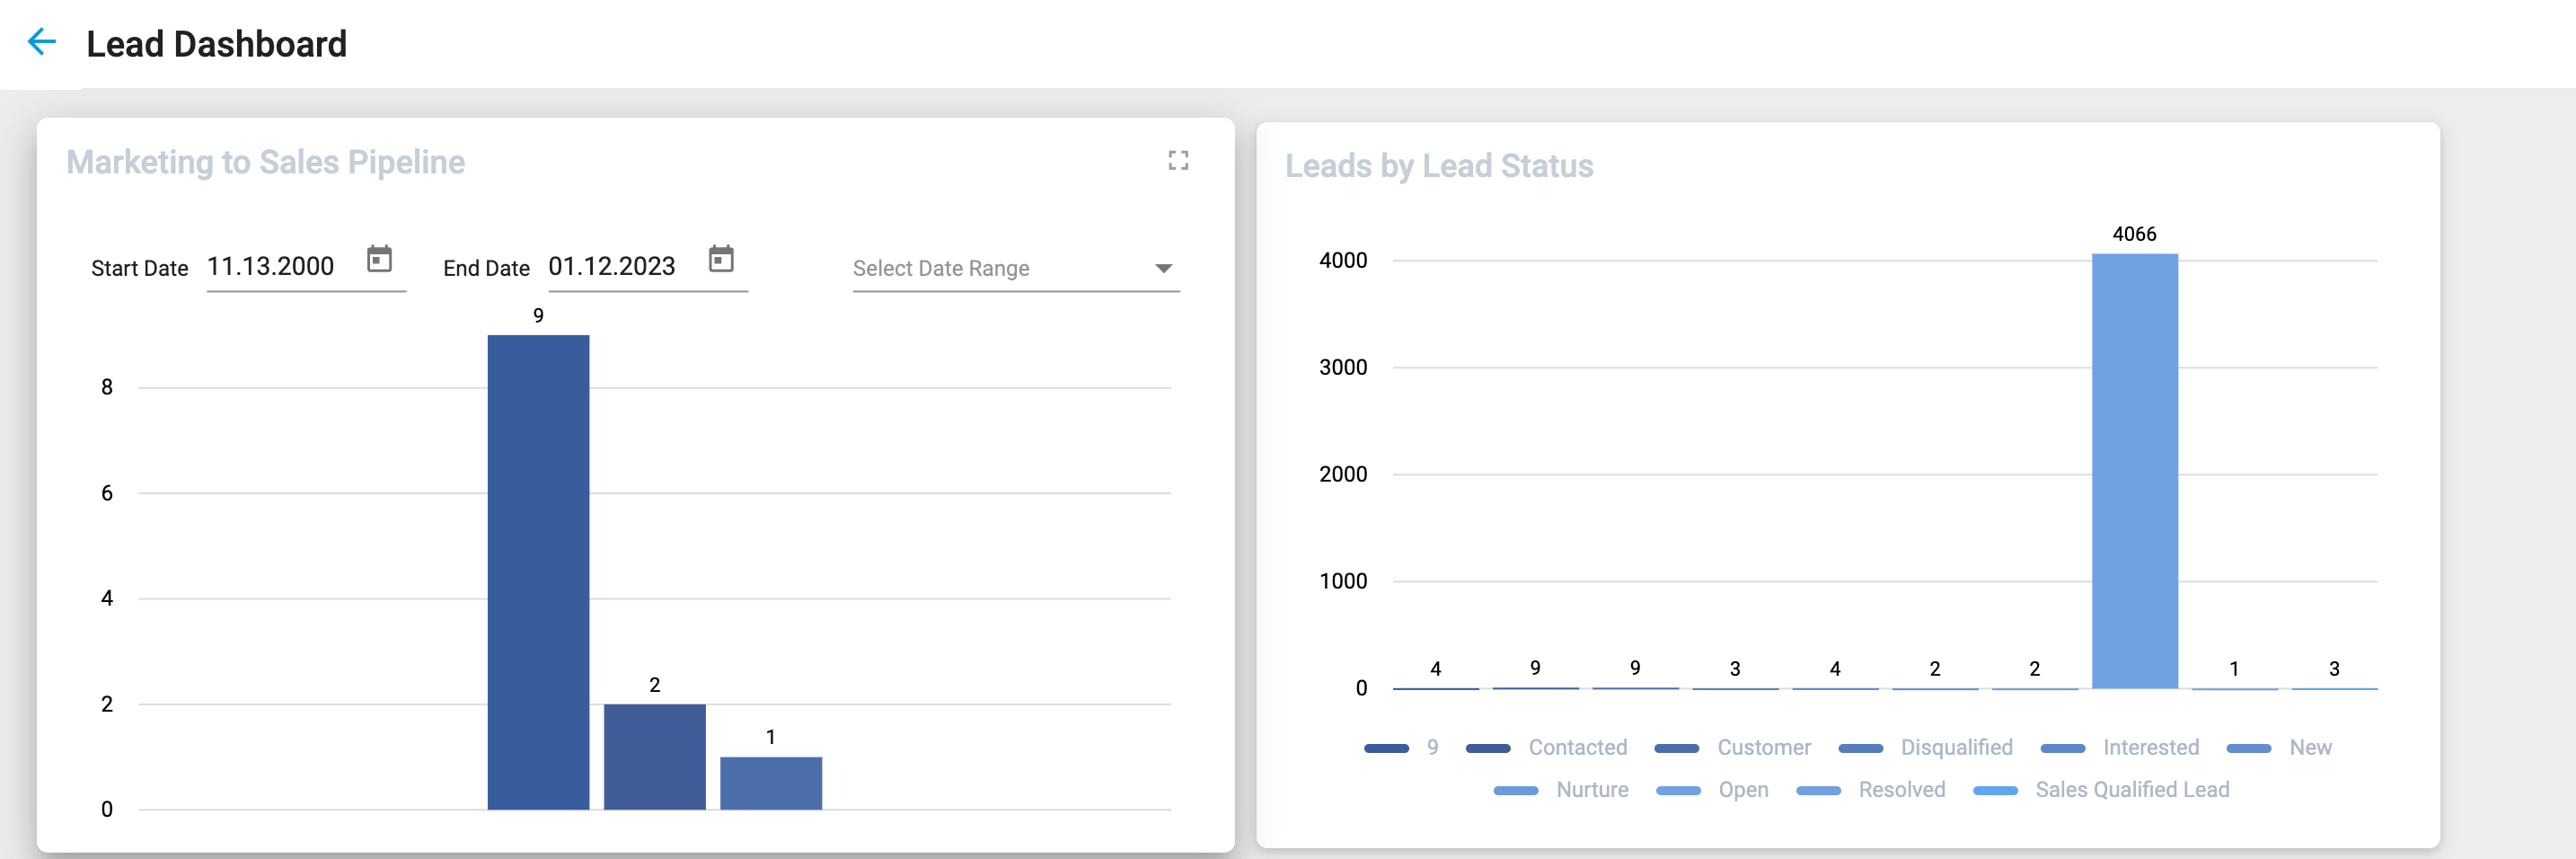
Leads and Scoring Dashboard
The Leads and Scoring Dashboard displays the status of your scoring. Click into any data point on the charts to drill down and see which contacts belong to each status category. Locate the Leads and Scoring Dashboard in the Dashboards Other categories grouping:
Nurtures Dashboard
The Nurtures Dashboard provides cumulative metrics for all emails in the selected legacy nurture. For metrics on nurtures built with Nurture Builder, visit the nurture's Analytics View.