How To Find Your Top Spending Customers
Overview
Using the Full Picture Enquiry, you can easily see your top spending customers, as well as those which are most profitable or buy the biggest quantity of items from you. Enquiries is the place to answer any questions you have about customer spend.
Select device:
Desktop
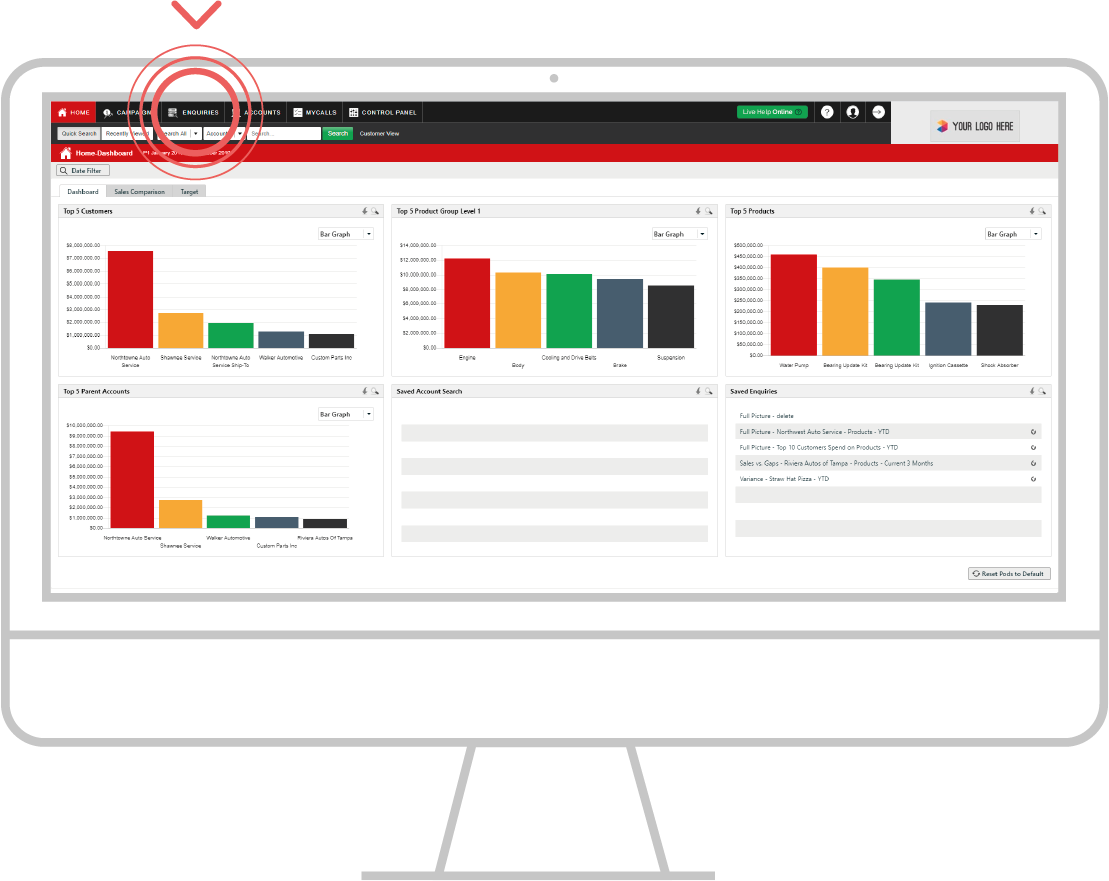
Step 1: Go to Enquiries
From the black navigation bar at the top of the screen, click Enquiries.
Step 2: Understand Enquiries
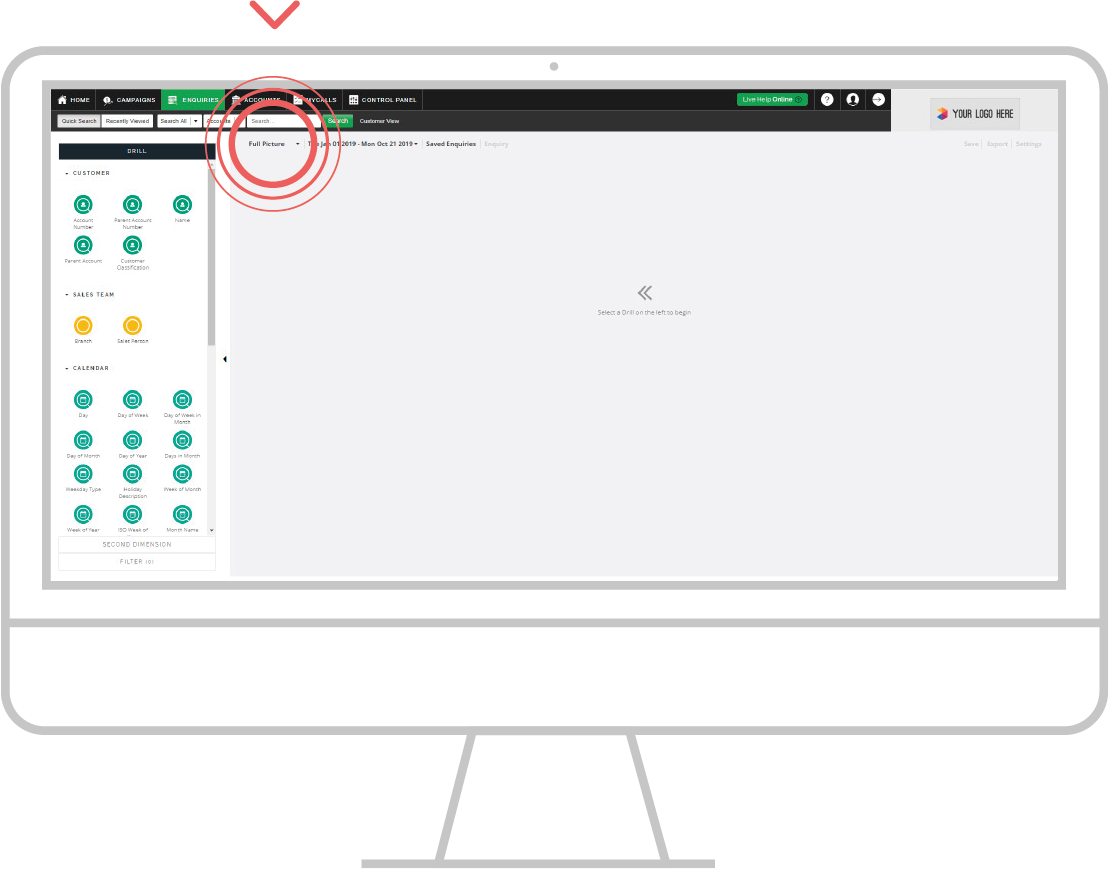
The Full Picture enquiry is the default selection from the 4 enquiry types.
You can navigate to these different enquiries using the report type drop down.
To find your biggest spending customers this YTD, we will be using the default enquiry type, Full Picture, and the default date range, YTD.
Step 3: How to view customers
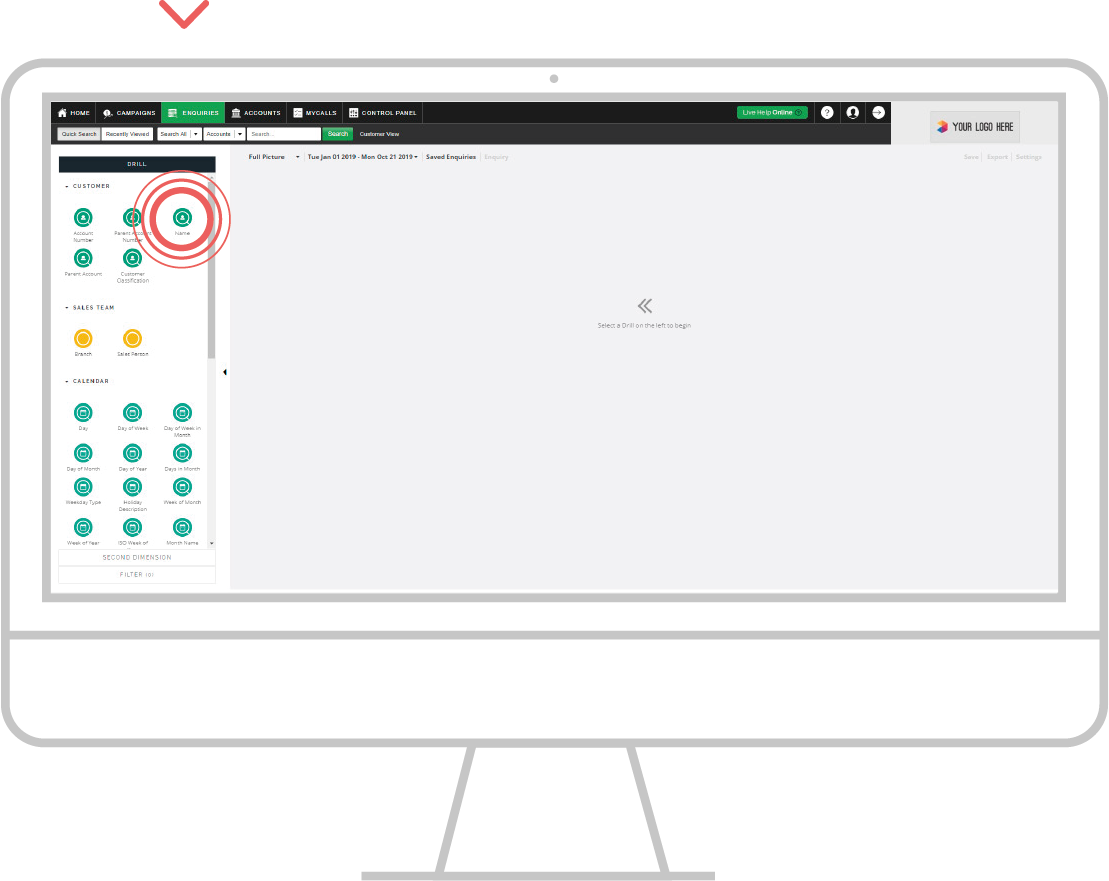
On the left side of your screen, within the Customer section, click on the Name bubble to view a list of your Customers.
Note: you can also use the Parent Account bubble to see overall spend for that customer, as opposed to spend for each delivery address separately.
Step 4: Sort results
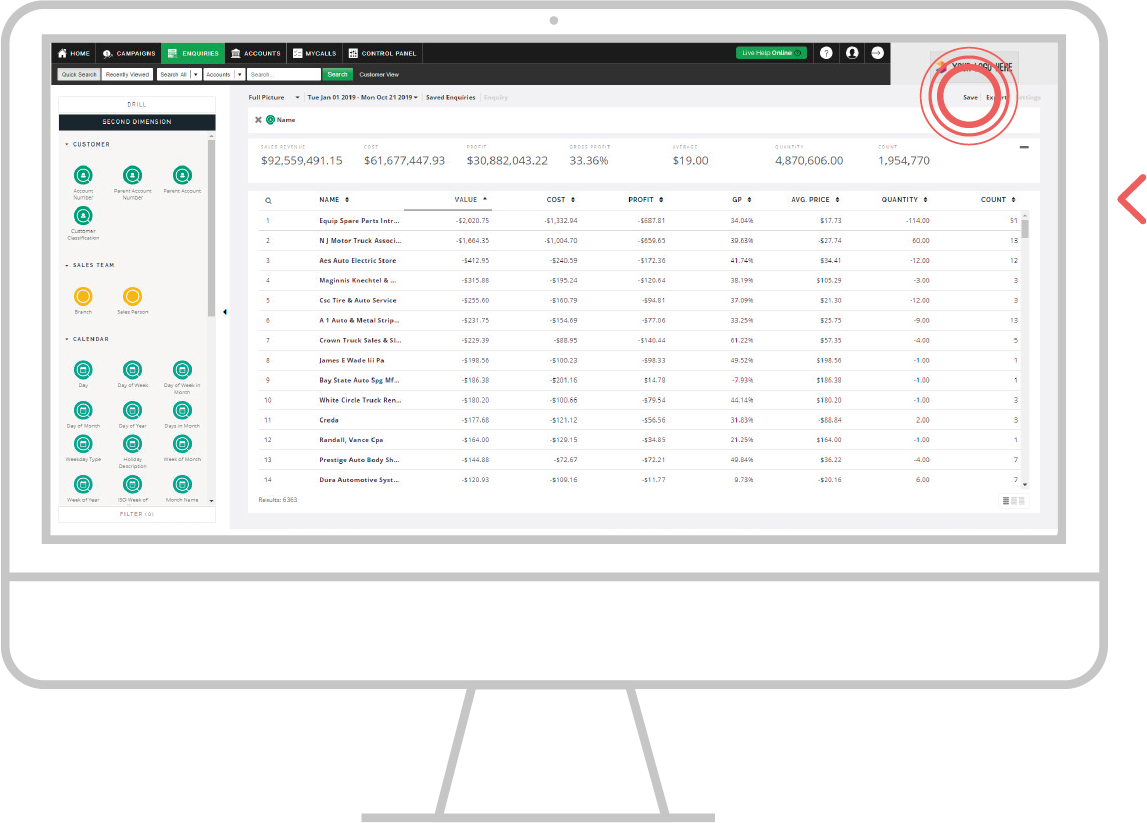
Your biggest spending customers by sales Value are automatically sorted in descending order.
You will also see other measurement types, such as Cost, Profit, GP% and Quantity. You can click on any of these table headers to sort by this measurement type in descending or ascending order.
Save your Report (Optional)
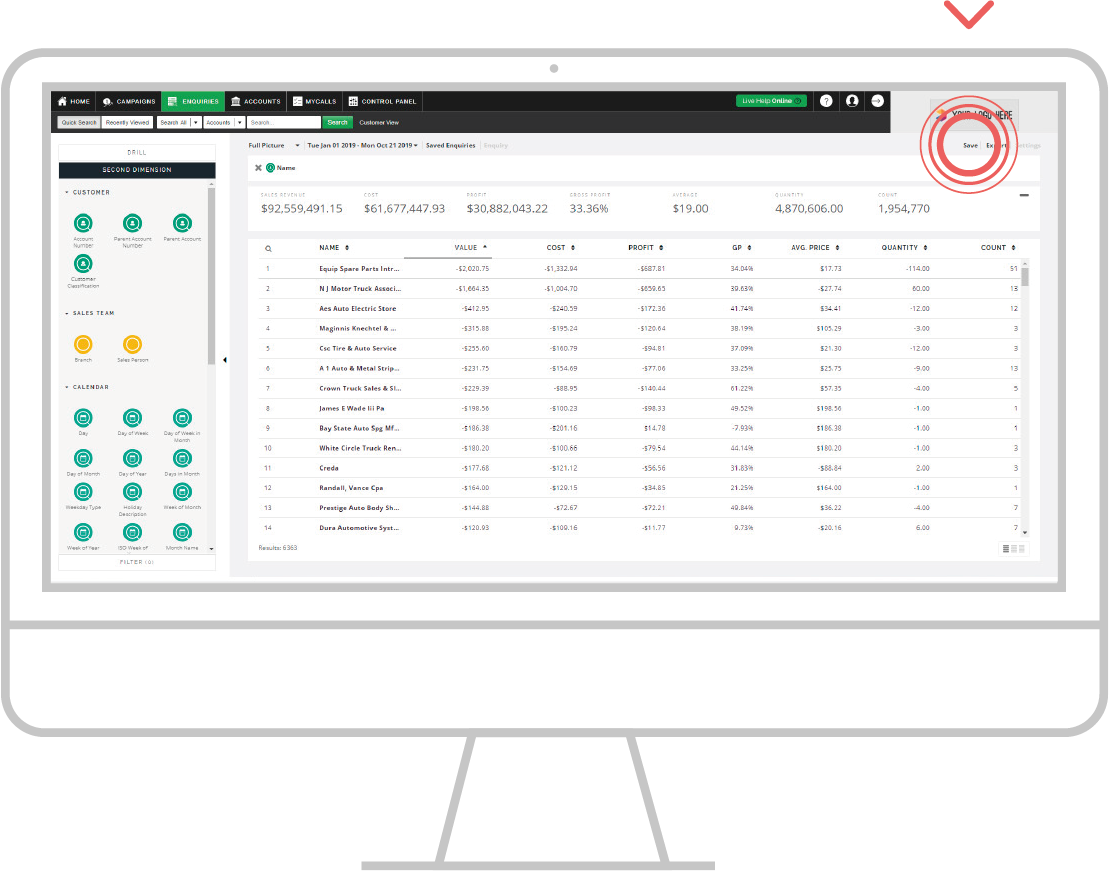
Step 5: Save Enquiry
You can also Save this enquiry for future reference.
To do so, click Save in the top right corner
Step 6: Add a description
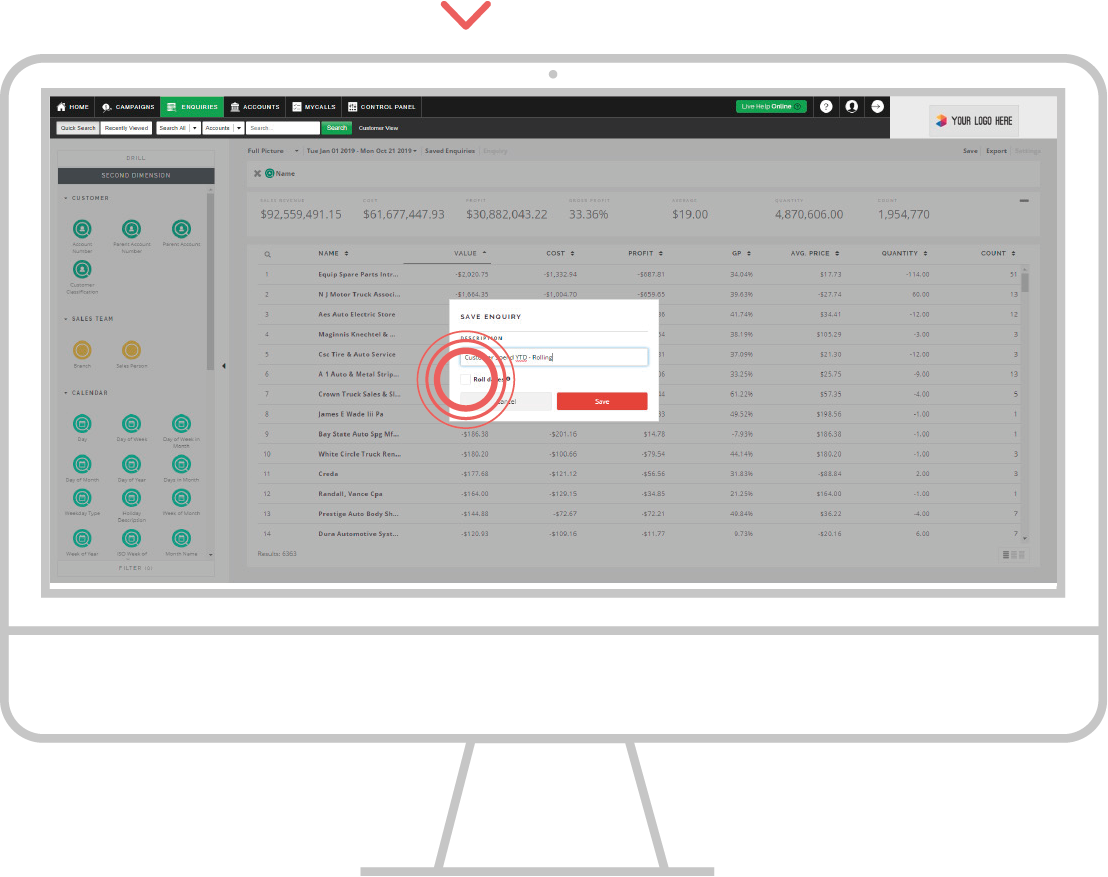
Type in a name for this enquiry, e.g. ‘Customer Spend YTD - Rolling’ in the Description field.
Note: it is good to be as clear as possible when naming saved enquiries, to help you understand what the enquiry will show when you come back to it later.
Step 7: Choose your settings
To keep the numbers in the report relevant to the date you are viewing the report, check the Roll Dates checkbox.
Power Users, choose to save the report for all users to see, by checking the Save enquiry globally checkbox.
Note: If you do not choose to roll the dates for the report, you will always see the dates you saved when you reopen the report in the future. Your data will not change. YTD dates will roll as standard.

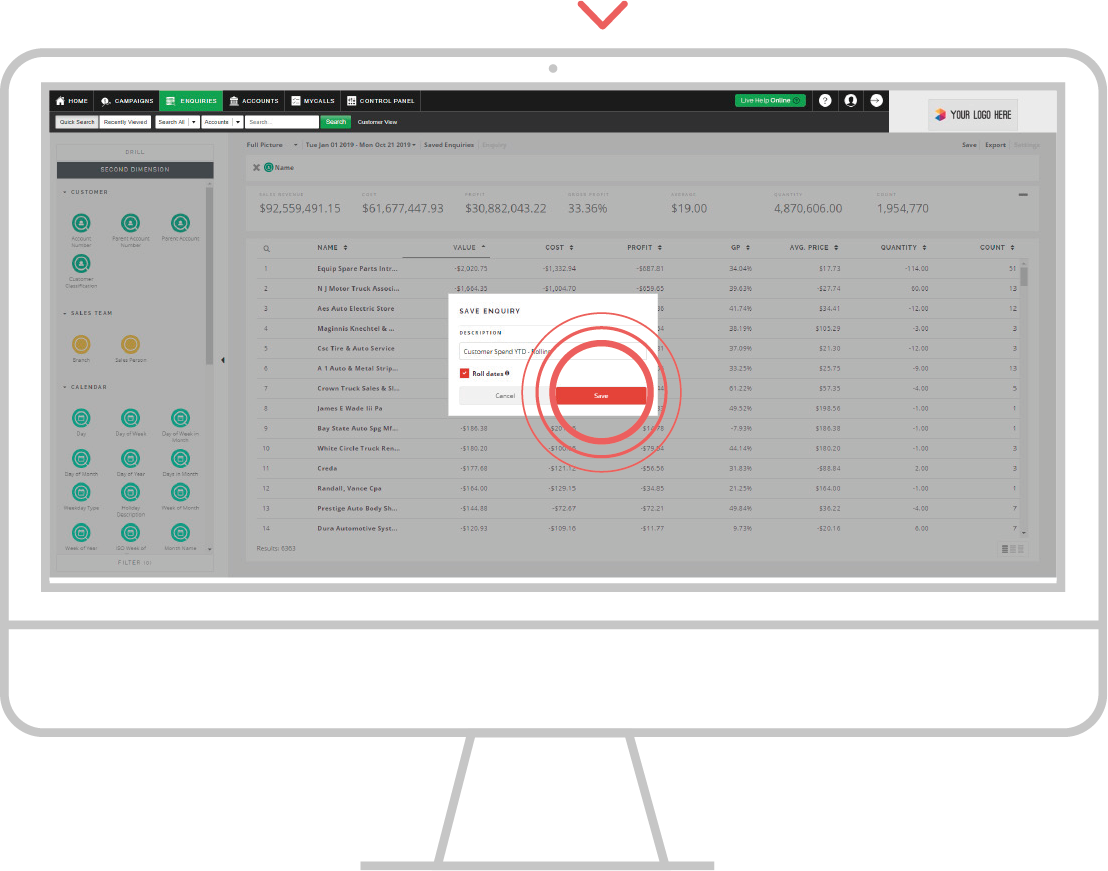
Step 8: Save
Click the Save button.
This saved enquiry will now appear on your Home Page and will automatically update with the latest sales data if you have chosen to roll your dates.
Step 9: Revisit Saved Enquiry
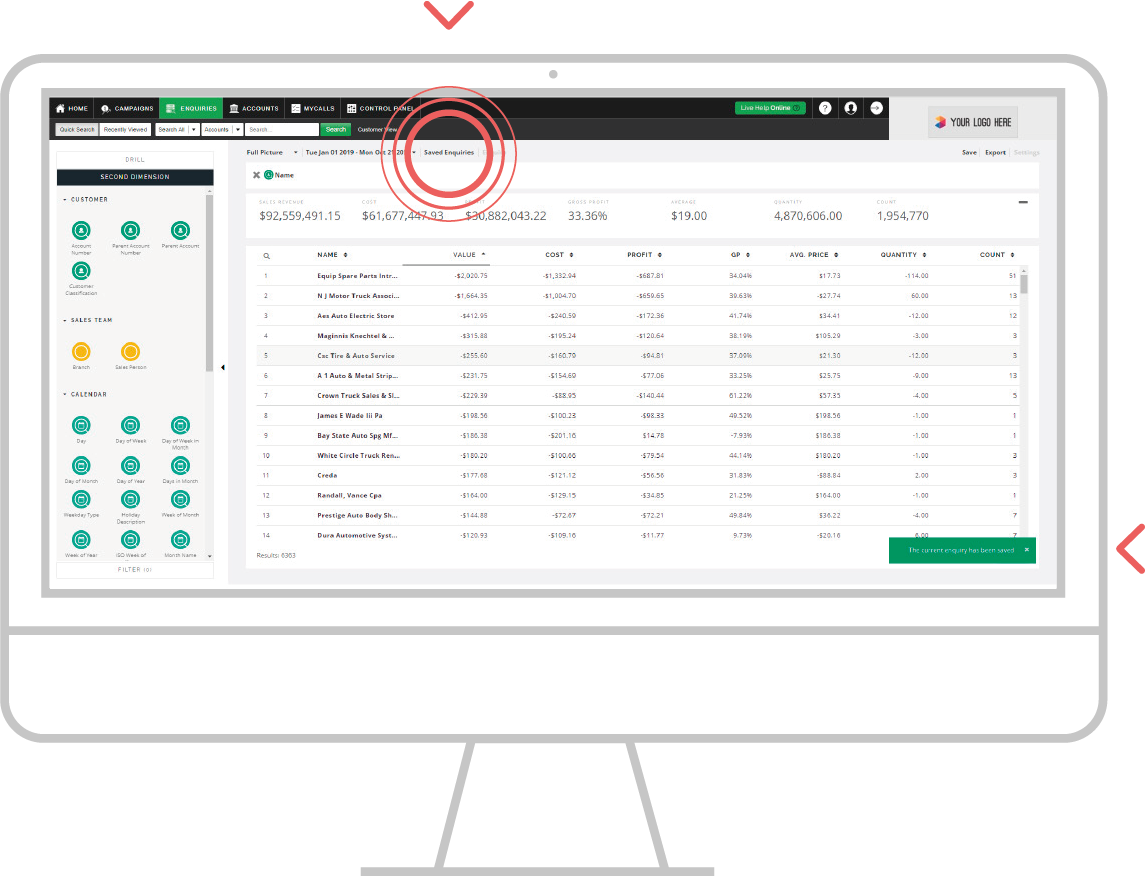
As confirmation that your Enquiry has been successfully saved, a green text box will appear in the bottom right corner of the screen.
To access this, and all of your previously saved Enquiries, tap on Saved Enquiries.
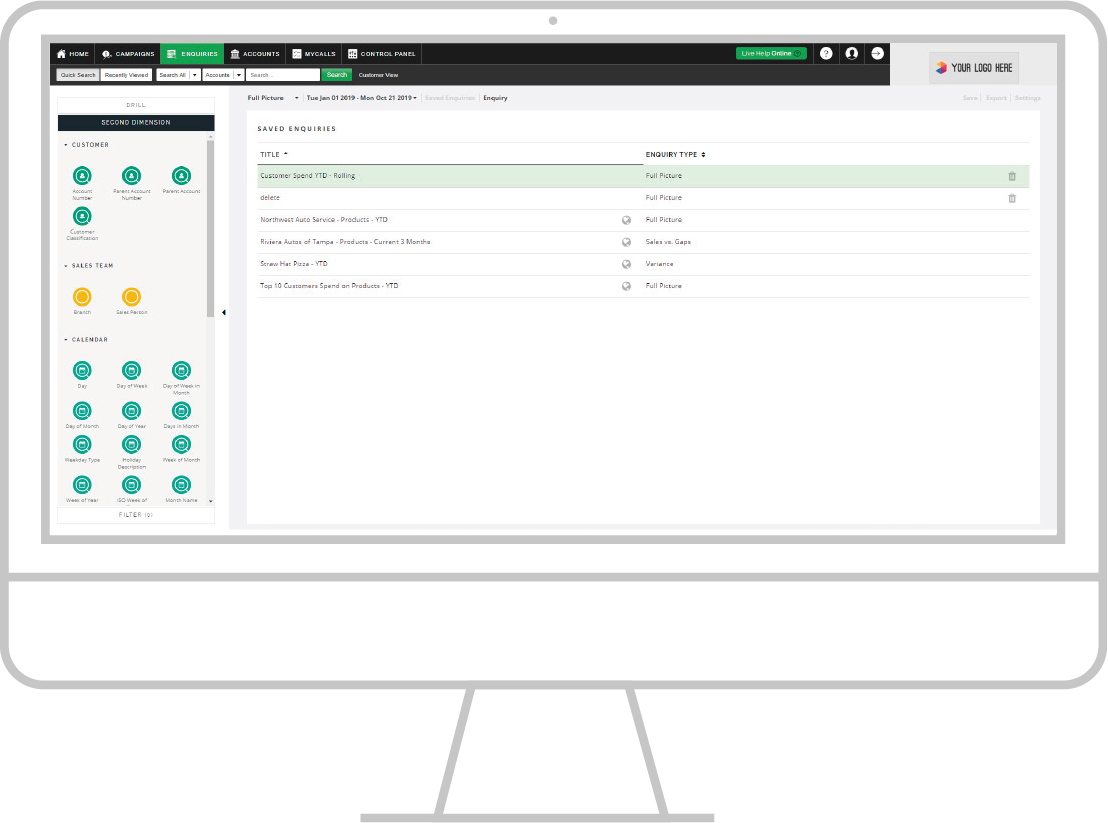
Step 10: Saved Enquiries
Your saved Enquiries will be listed in alphabetical order.
These will also be displayed on your sales-i homepage.
Apple
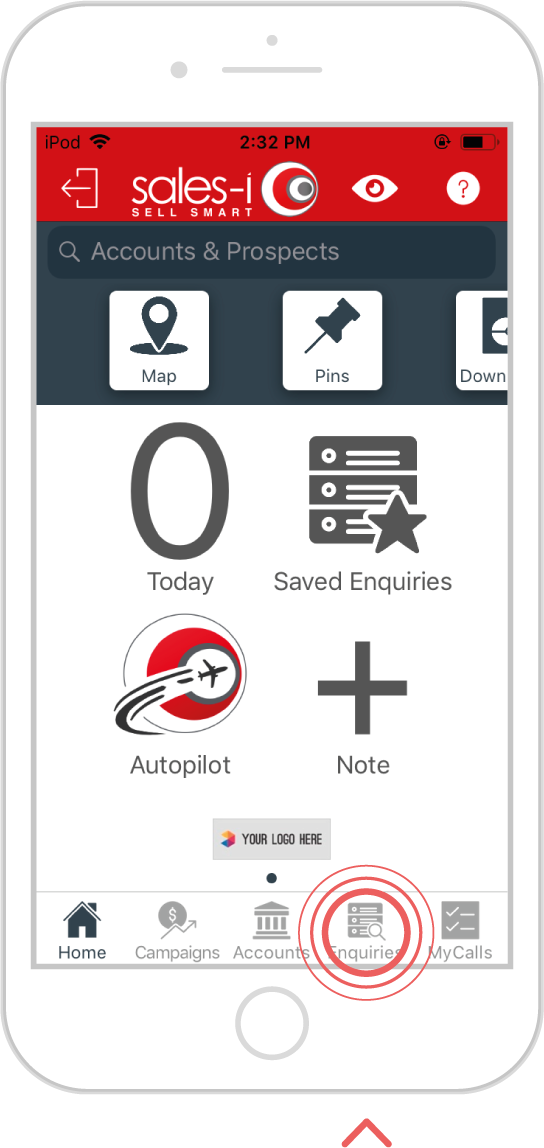
Step 1: Tap Enquiries
From the navigation bar at the bottom of the screen, tap Enquiries.
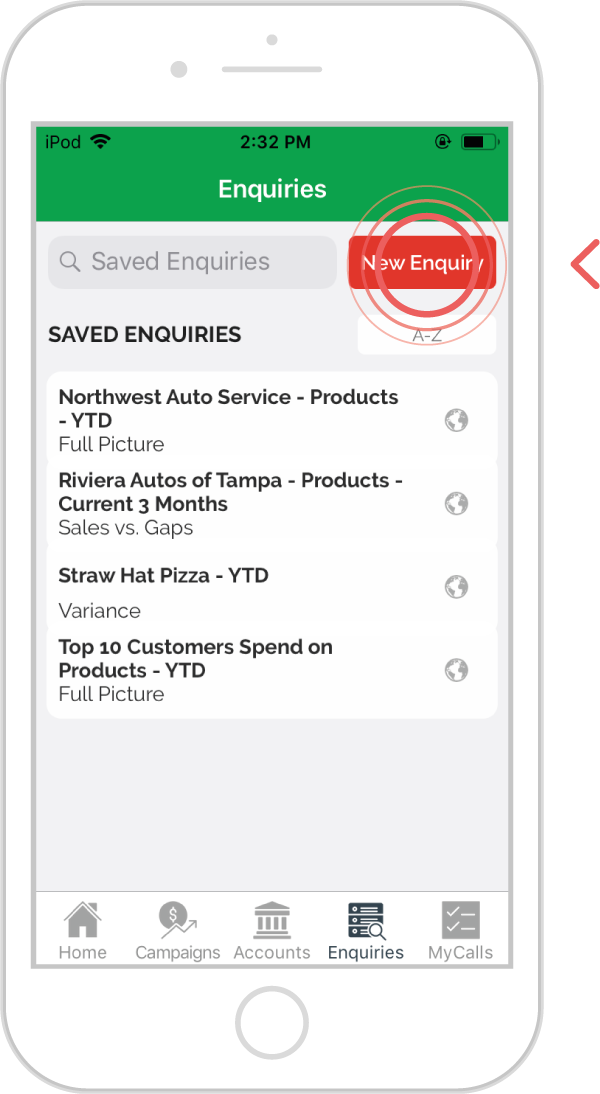
Step 2: Tap the new Enquiries button
You will see your saved searches appear on the Enquiries home page.
To start a new report, tap the red New Enquiry button in the top, right corner.
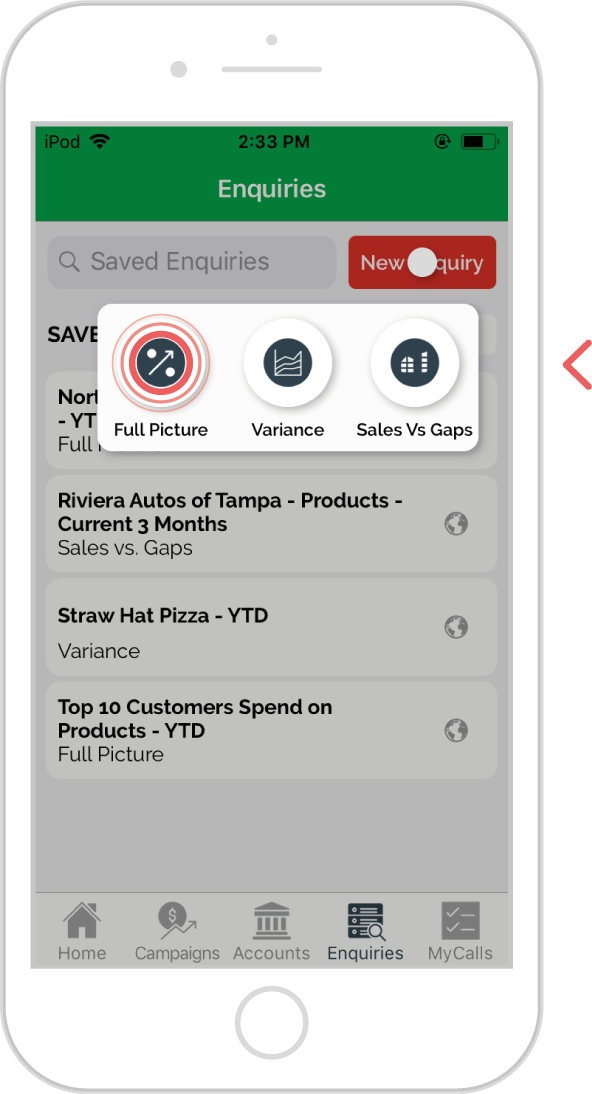
Step 3: Tap Full Picture
There are 3 enquiry types: Full Picture, Variance, and Sales vs Gaps.
Each report formats the data in a unique way to help you extract the information you need.
To find your biggest spending customers this year-to-date, tap Full Picture, this will use the default date range, which is year-to-date.
Step 4: Tap the name bubble
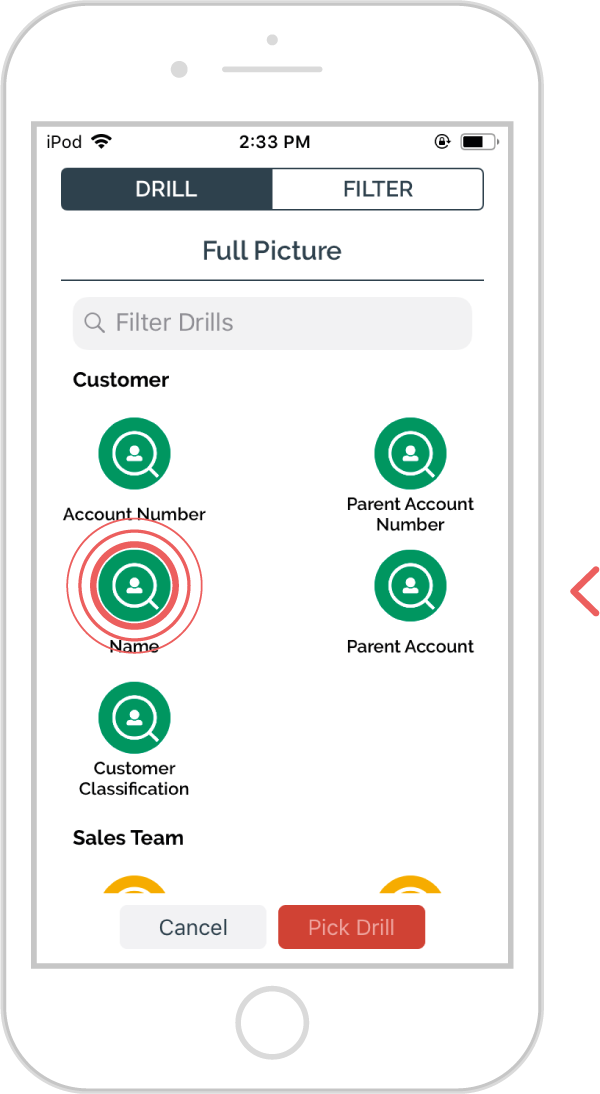
You will then see the Bubble screen.
Here, you can pick from the five main categories of bubbles: Customer, Sales Team, Calendar, Sales, and Product (you may have further categories depending on your data). Each helps you drill into your data from a different viewpoint.
To see your biggest spending customer, tap the Name bubble under the Customer category.
Step 5: Results table
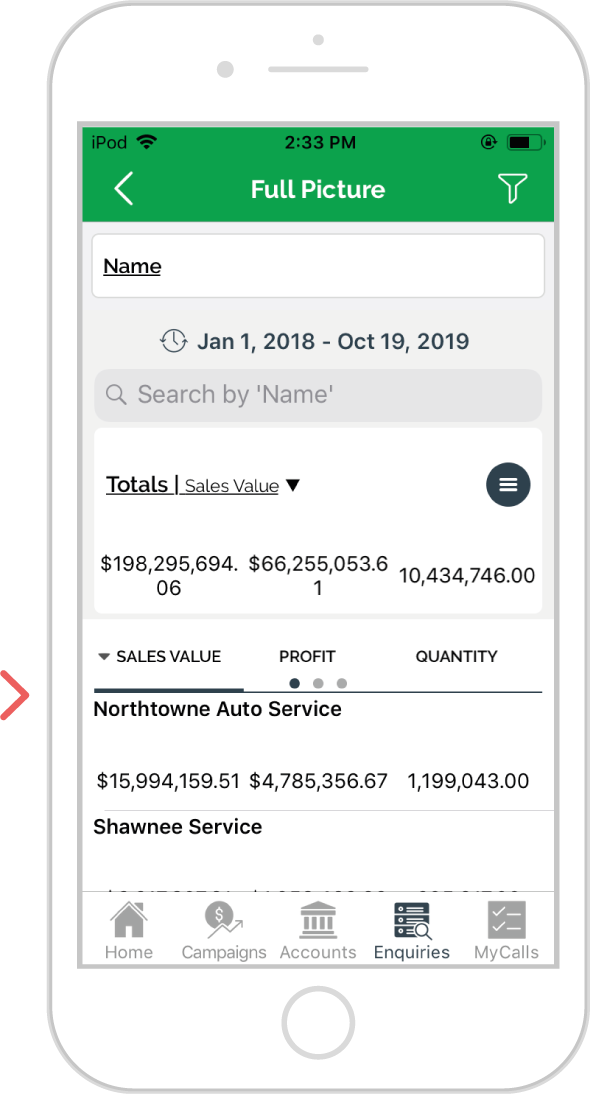
Your biggest spending customers year-to-date are now displayed by sales value.
These customers are automatically sorted in descending order in a results table.
Step 6: Explanation
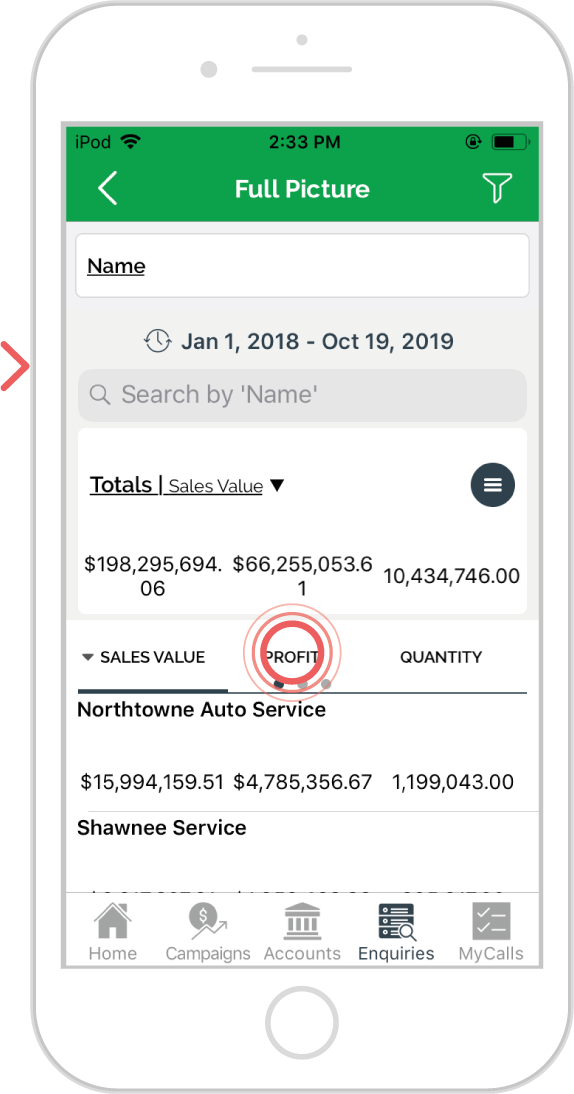
Also displayed are Profit, Quantity, Average Price, Sales Cost, GP, and Transaction Count.
These columns help you identify how much profit you are getting from your biggest customer, or what quantity of items they are buying from you.
Tap on any other column header to sort by that measurement instead.
Step 7: Save the report
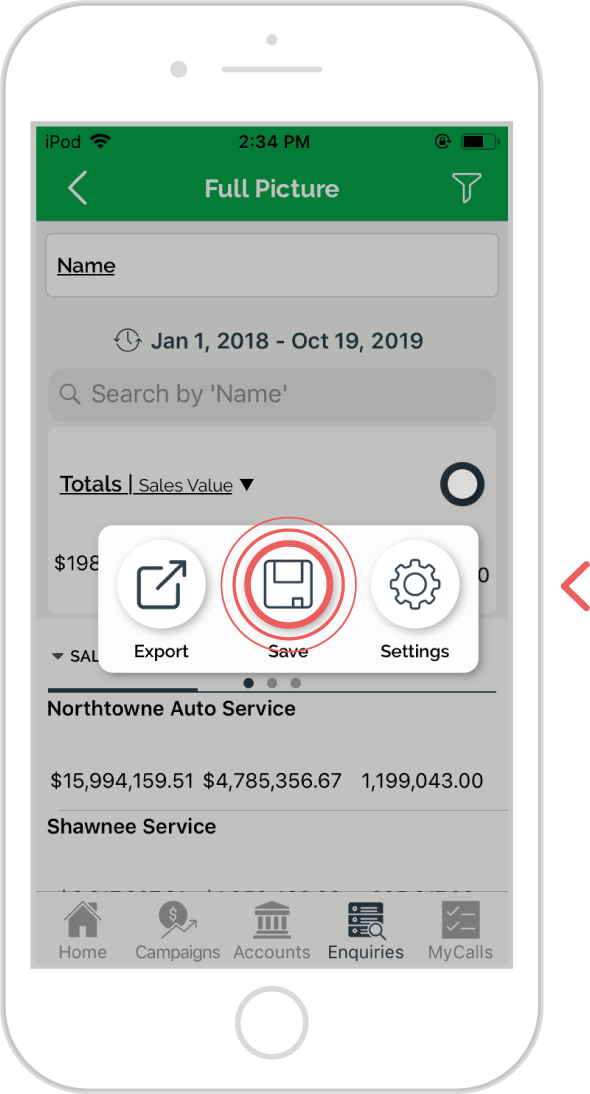
You can also save this enquiry for future reference.
To do so, tap the menu icon in the top right corner of the totals bar, then tap Save.
Step 8: Name enquiry
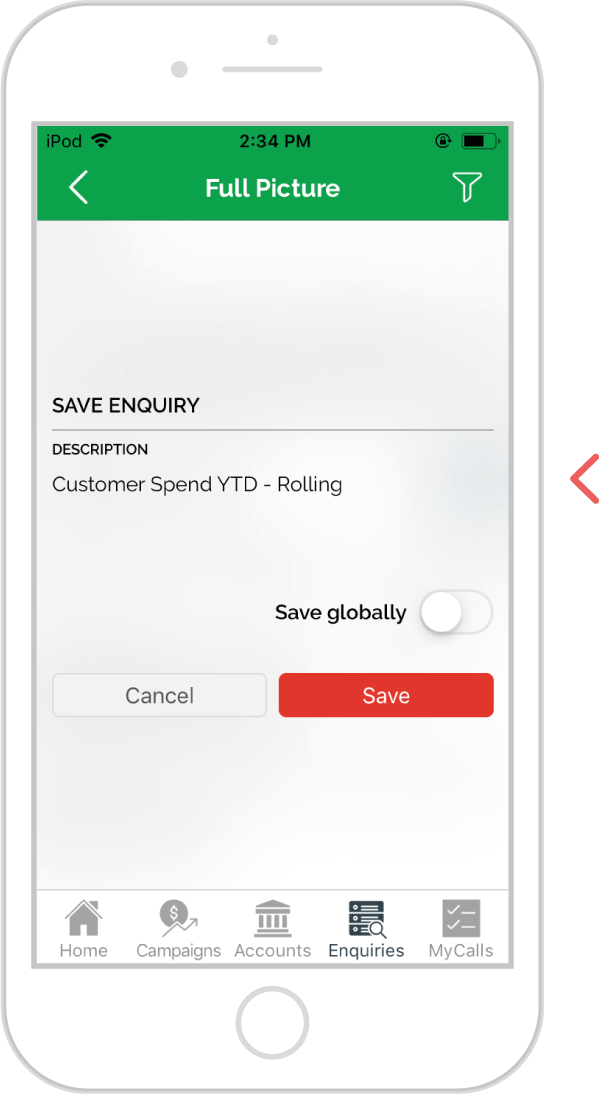
In the Description field, enter a name for this enquiry, such as “Customer Spend YTD (Rolling)”.
It is helpful to be as clear as possible when naming saved enquiries to remind you what the enquiry will encompass when you open it later.
Step 9: Tap Save
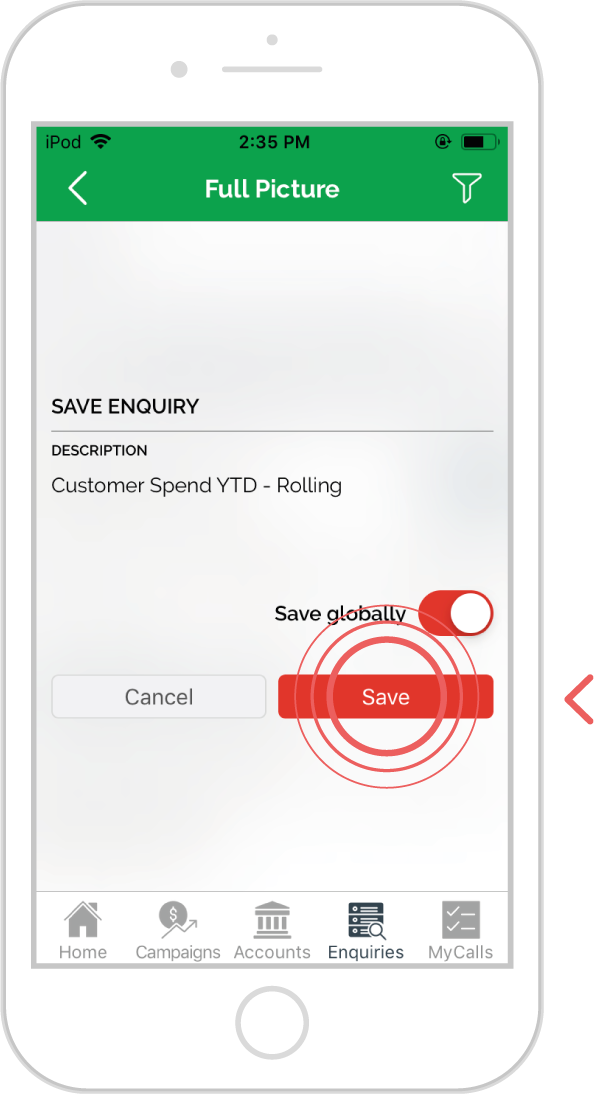
Tap Save.
This saved enquiry will now be accessible via the Saved Enquiries button on your Home Page and will automatically update with the latest sales data.
Note: When saving a report with a default date range, such as year-to-date, the report will automatically roll the dates forward to keep your data current.
Android
Step 1: Tap Enquiries
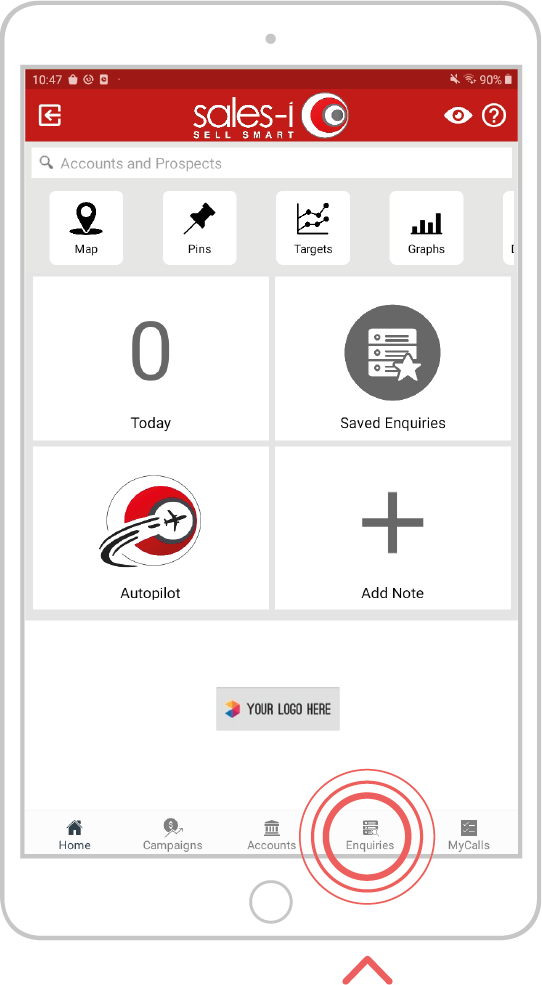
From the navigation bar at the bottom of the screen, tap Enquiries.
Step 2: Tap the new Enquiries button
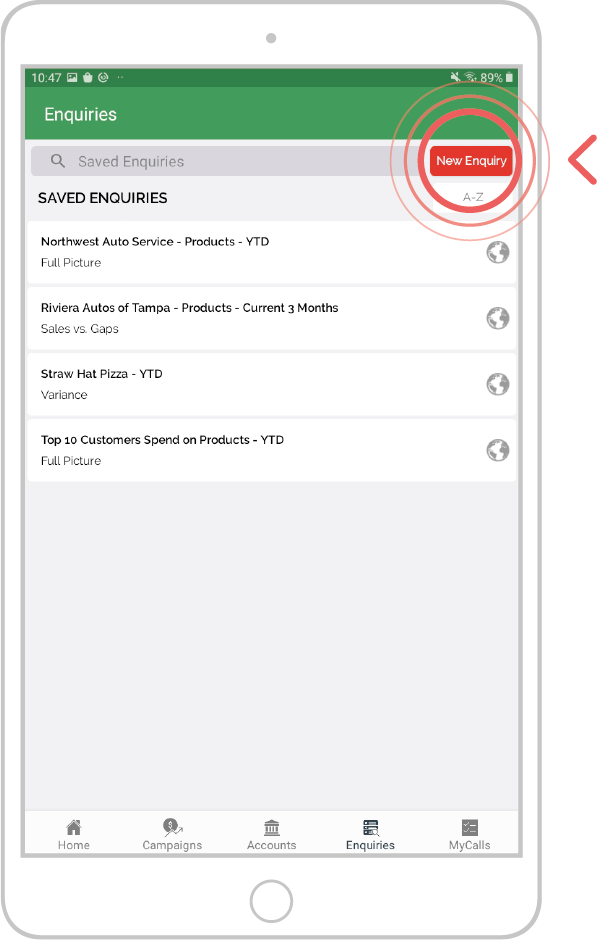
You will see your saved searches appear on the Enquiries home page.
To start a new report, tap the red New Enquiry button in the top, right corner.
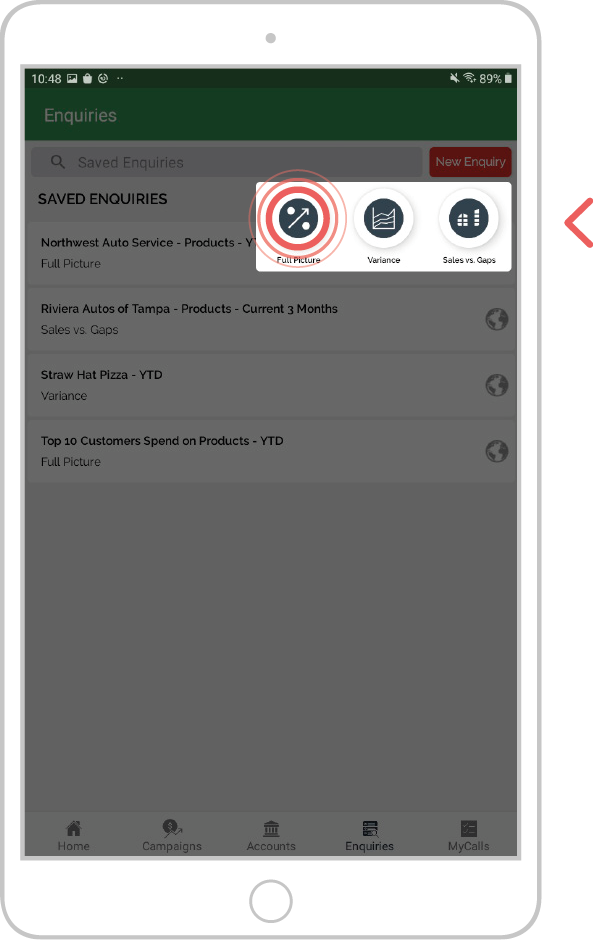
Step 3: Tap Full Picture
There are 3 Enquiry types: Full Picture, Variance, and Sales vs Gaps.
Each report formats the data in a unique way to help you extract the information you need.
To find your biggest spending customers this year-to-date, tap Full Picture, this will use the default date range, which is year-to-date.
Step 4: Tap the name bubble
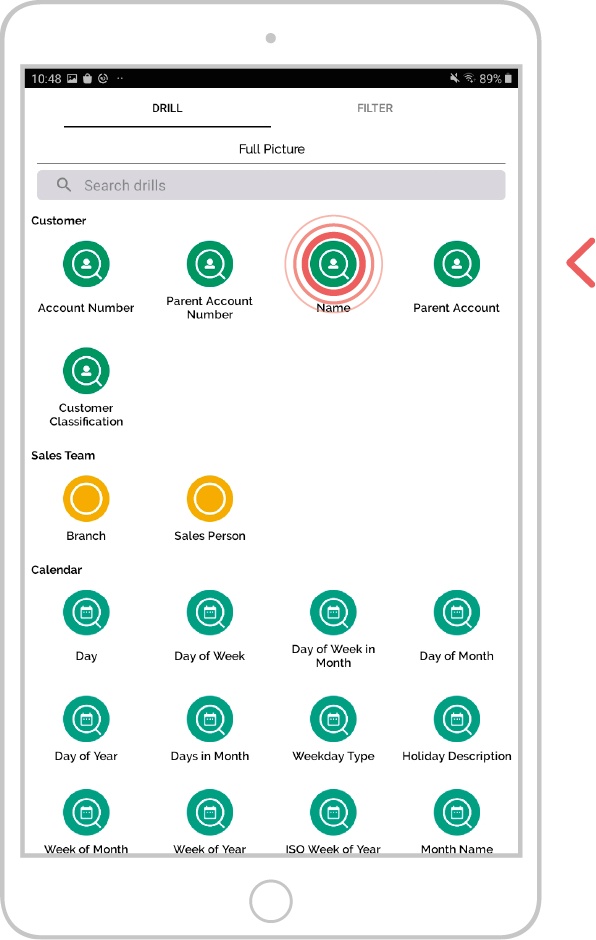
You will then see the Bubble screen.
Here, you can pick from the five main categories of bubbles: Customer, Sales Team, Calendar, Sales, and Product (you may have further categories depending on your data). Each helps you drill into your data from a different viewpoint.
To see your biggest spending customer, tap the Name bubble under the Customer category.
Step 5: Results table
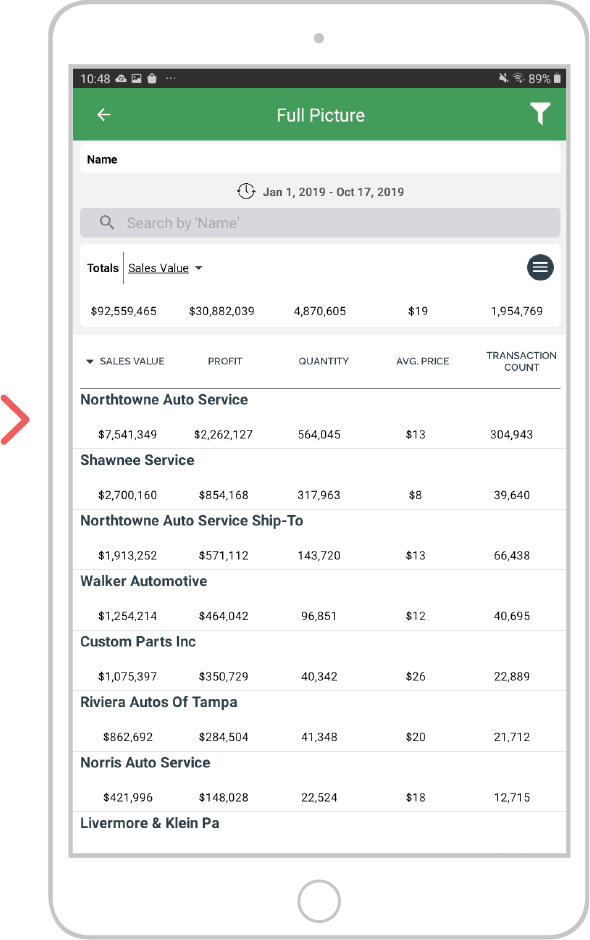
Your biggest spending customers year-to-date are now displayed by sales value.
These customers are automatically sorted in descending order in a results table.
Step 6: Explanation
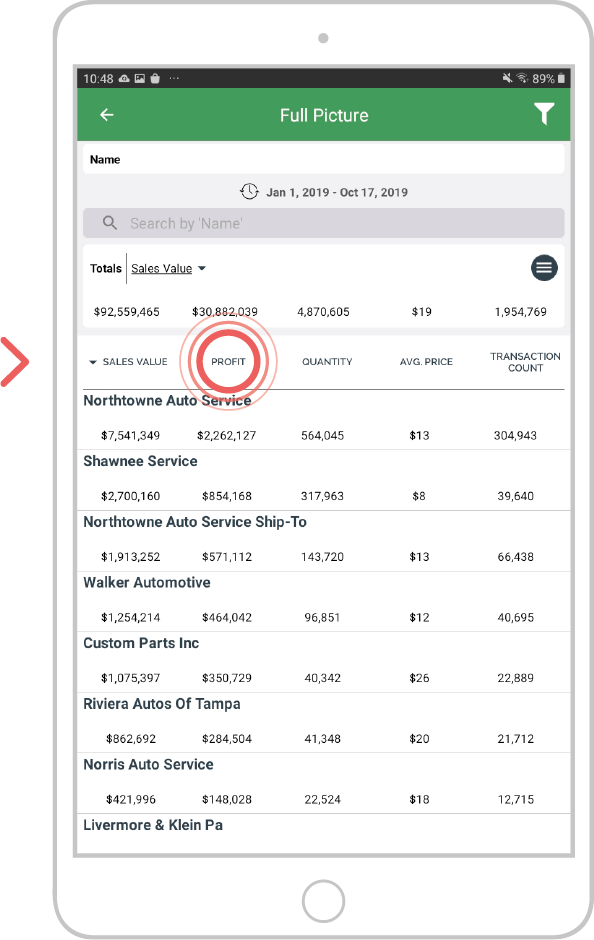
Also displayed are Profit, Quantity, Average Price, Sales Cost, GP, and Transaction Count.
These columns help you identify how much profit you are getting from your biggest customer, or what quantity of items they are buying from you.
Tap on any other column header to sort by that measurement instead.
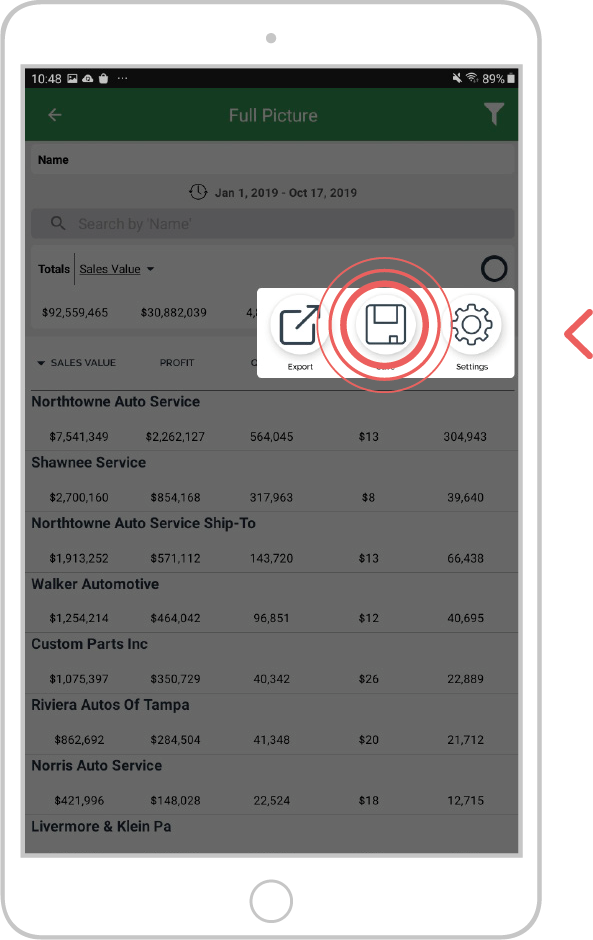
Step 7: Save the report
You can also save this enquiry for future reference.
To do so, tap the menu icon in the top right corner of the totals bar, then tap Save.
Step 8: Name Enquiry
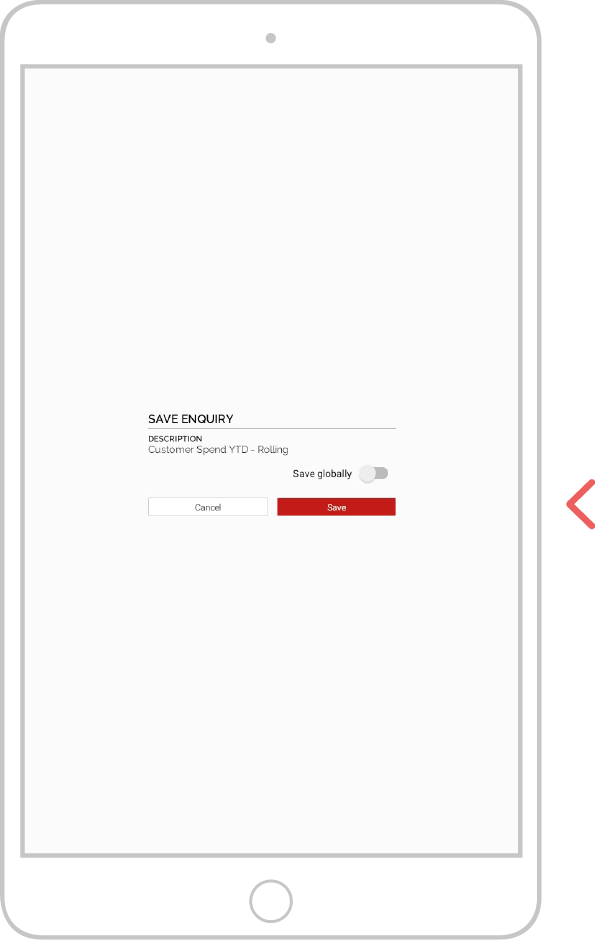
In the Description field, enter a name for this enquiry, such as “Customer Spend YTD (Rolling)”.
It is helpful to be as clear as possible when naming saved enquiries to remind you what the enquiry will encompass when you open it later.
Step 9: Tap Save
Tap Save.
This saved enquiry will now be accessible via the Saved Enquiries button on your Home Page and will automatically update with the latest sales data.
Note: When saving a report with a default date range, such as year-to-date, the report will automatically roll the dates forward to keep your data current.
