Service Console
Overview
Users with a Sugar Serve or Enterprise license type have access to Service Console, a Home page dashboard that provides a powerful work environment for customer service agents by incorporating SLAs and region-specific business hours, insightful dashlets, and a cohesive case research and action experience.
Its functionality is broken into two tabs:
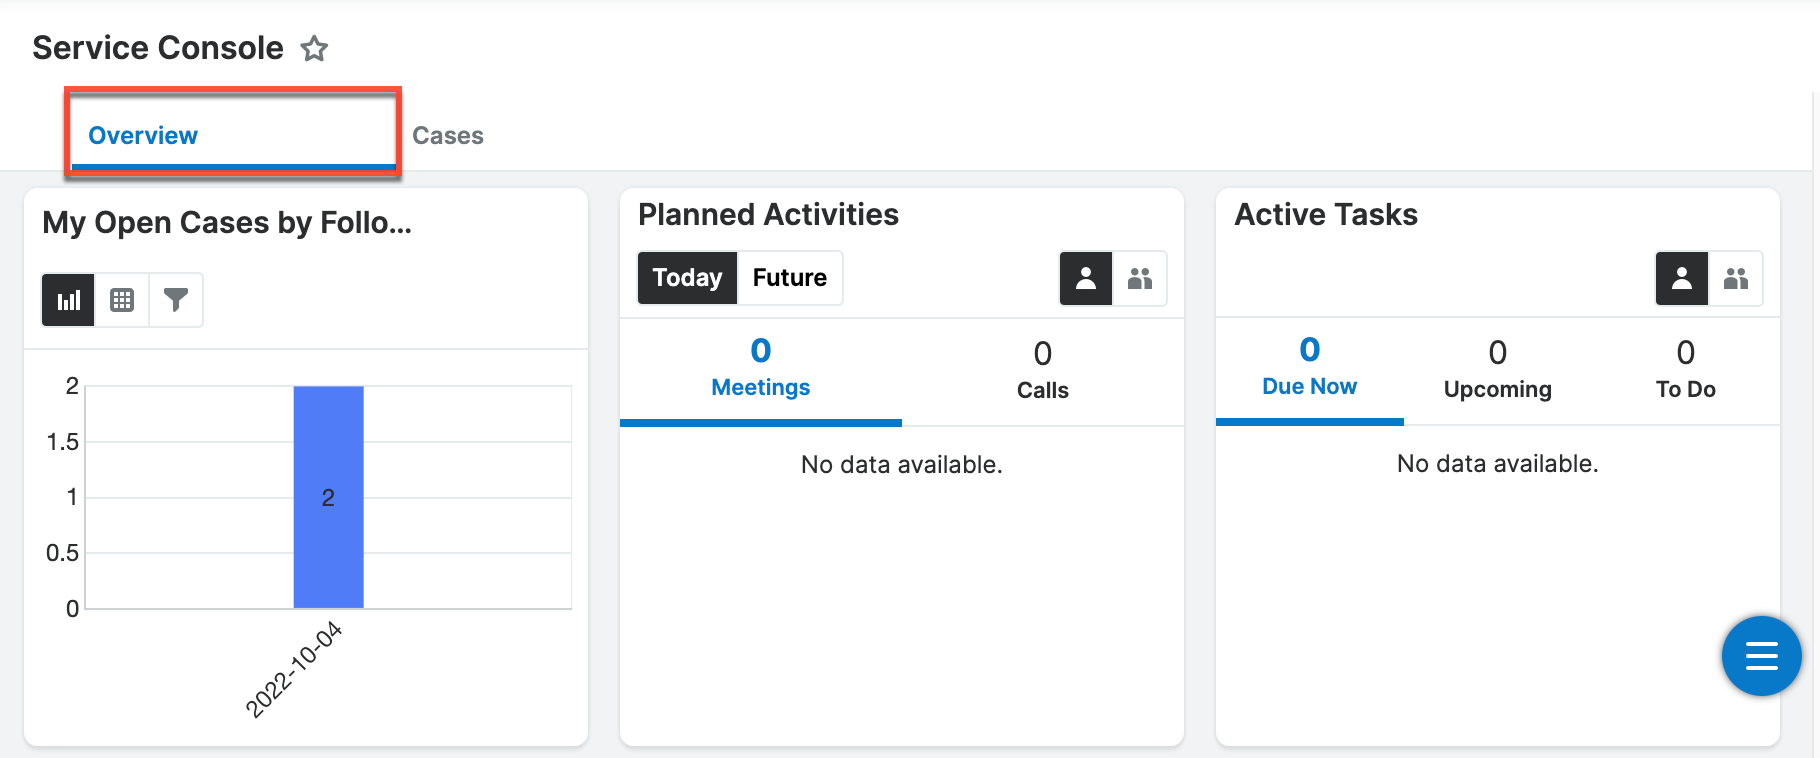
The Overview tab comes pre-built with nine dashlets focused on assisting customer service users track and complete their work.
The second tab, named "Cases", presents a tabbed view of prioritized lists of cases meeting different filter criteria. Clicking a case's row opens a Case focus drawer which displays a wealth of information and provides the tools needed to work the case to completion.
The floating actions button also appears on the console dashboard and allows users to perform actions such as create dashboards. For more information on the floating actions button, refer to the Dashboards and Dashlets documentation. Please note that admin users and the user assigned to the Service Console dashboard have the ability to configure the various parts of the console. For more information on how to configure the console, refer to the Console Management documentation.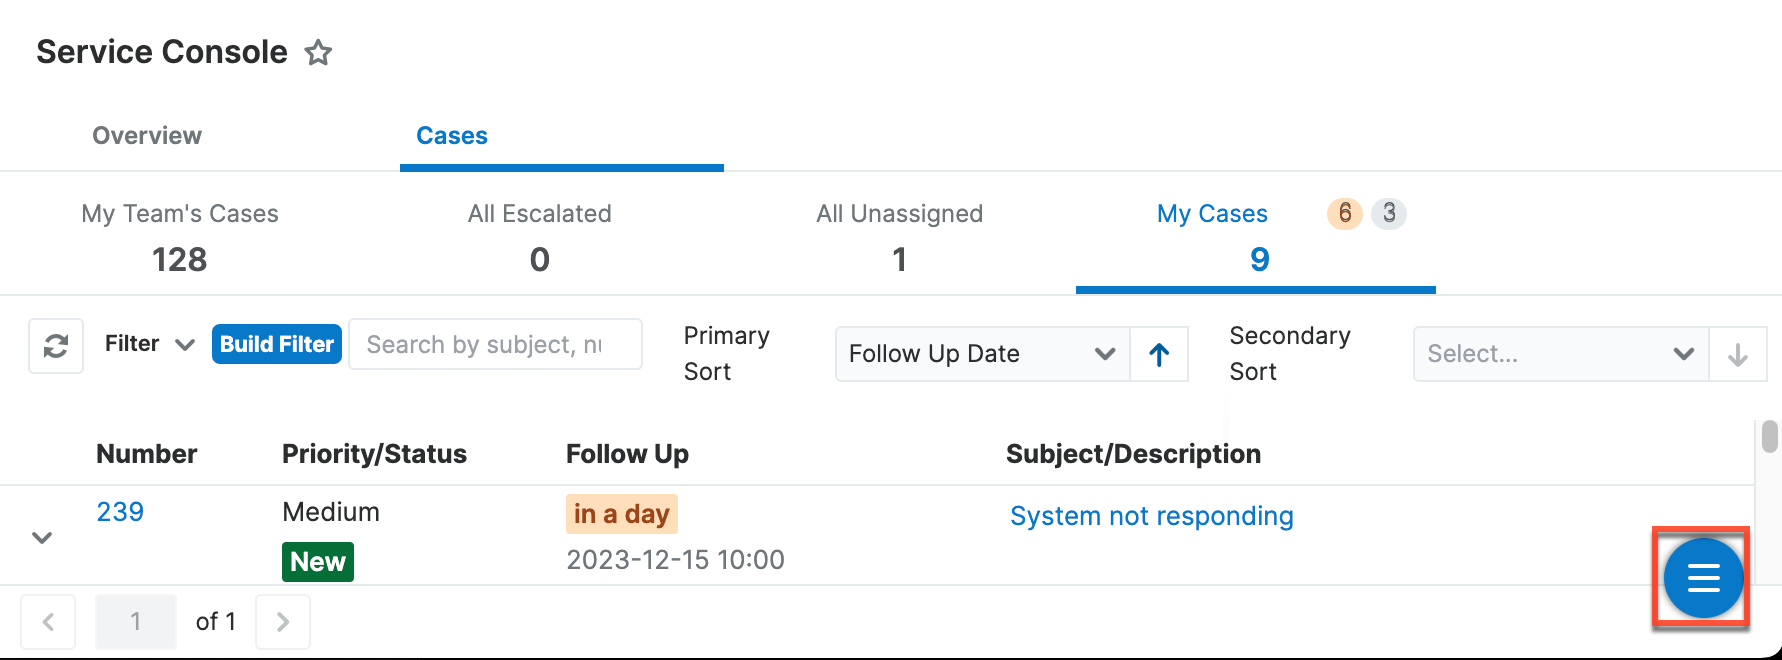
Out-of-the-box, Service Console is a shared, default Home page dashboard and can be accessed by clicking the Home module's three-dots menu and selecting "Service Console" from the menu.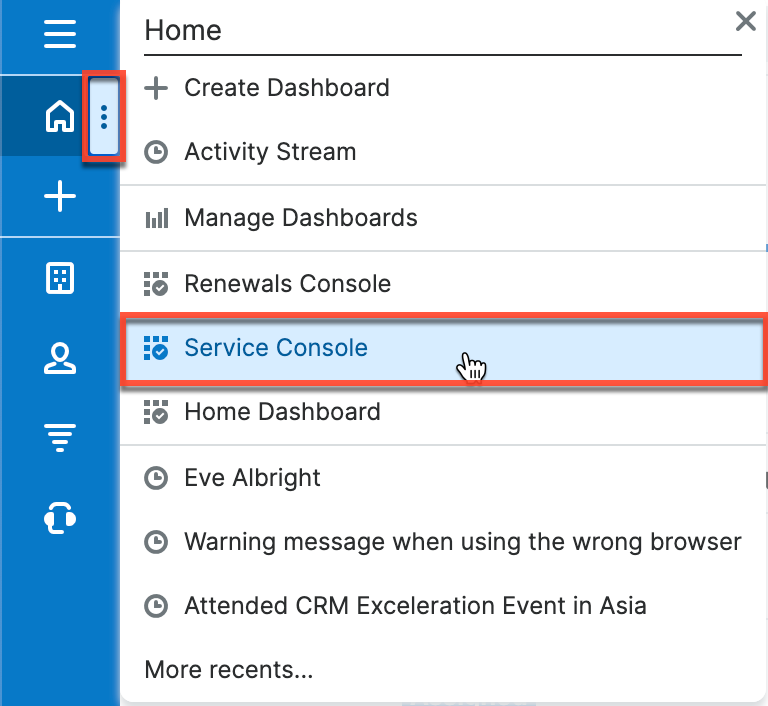
Prerequisites
Sugar Service Console Initialization
Service Console makes heavy use of the Case module's Follow Up Date field which is set according to your organization's SLAs and business hours by the Stock SugarBPM template. Several related records must be set up, and an admin must configure the SugarBPM template in order for follow-up dates to be calculated correctly. For detailed instructions, refer to the Getting Started With SugarBPM for Sugar Serve and Stock SugarBPM - Case Follow-Up Date Management articles.
Console Access
Although Service Console shares some behaviors with standard shared dashboards, it is also specialized and, therefore, has some key differences:
- Visibility: Service Console follows the visibility and availability rules of other shared dashboards with the additional requirement that users must have a Sugar Serve or Enterprise license type. By default, Service Console is shared with the Global team and set as a default dashboard, meaning it will appear in the home dashboards list for all users who are members of the Global team and have a Sugar Serve or Enterprise license type. An admin user may need to alter its Team field to push Service Console to additional users.
Overview Tab
Service Console's overview tab contains, by default, nine dashlets that aim to assist customer service professionals to track and organize their work. Admin users and the user assigned to the Service Console dashboard are able to edit the tab just like a standard dashboard to add, remove, or modify its dashlets. For more information on configuring the Overview tab, refer to the Console Management documentation. The following dashlets appear by default:
- My Open Cases by Followup Date
- Planned Activities
- Active Tasks
- My Open Cases by Status
- My Recently Viewed Cases
- My Cases in the Last Week by Status
- Open Cases by User by Status
- My Cases Resolved This Month by Week
- Status of Open Tasks Assigned by Me
All links in the Service Console can be clicked to reveal a focus drawer. There are two types of focus tabs that can be opened in a drawer: focus dashboards and focus record views. Clicking the Focus icon that appears when you hover over a link opens the focus dashboard, which displays a 360-degree view of the linked record through a set of dashlets containing relevant information such as the record's related records, related activities, and the case timeline. Clicking the link, and not the Focus icon, reveals a focus record view, which provides a thorough look into the record view, including the record view's dashlets and subpanels. For more information on focus drawers, refer to the User Interface documentation.
Cases Tab
Service Console's Cases tab contains a tabbed representation of prioritized list views of cases meeting different filter criteria which can be clicked to reveal a Case focus drawer where the case can be worked to completion. Its features and functionality are described in the following sections. 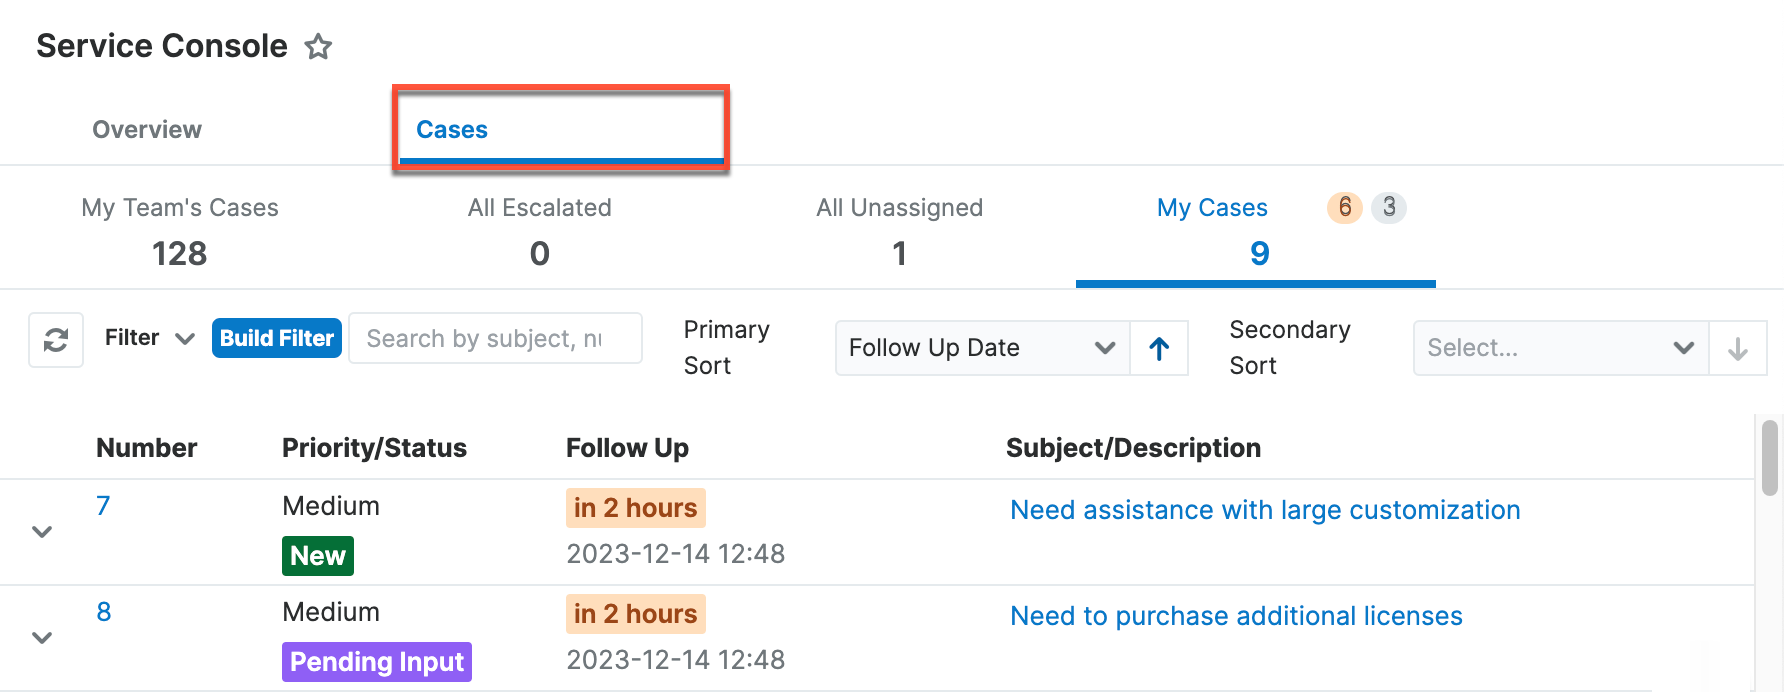
Prioritized List View
The Cases tab of the Service Console displays several metric tabs containing prioritized lists of cases in a paginated view. By default, these lists are ordered by the cases' follow-up dates, a value set according to your organization's SLAs and business hours by the Stock SugarBPM template, which requires admin configuration prior to use. Admins can set the default sort order, apply a filter to each tab, as well as choose which fields to display as columns in the list view and the order in which they appear. Users can also set their own sort order using the Primary and Secondary Sort dropdowns found to the right of the console's search bar. For more information on how administrators can configure these various settings, refer to the Console Management documentation.
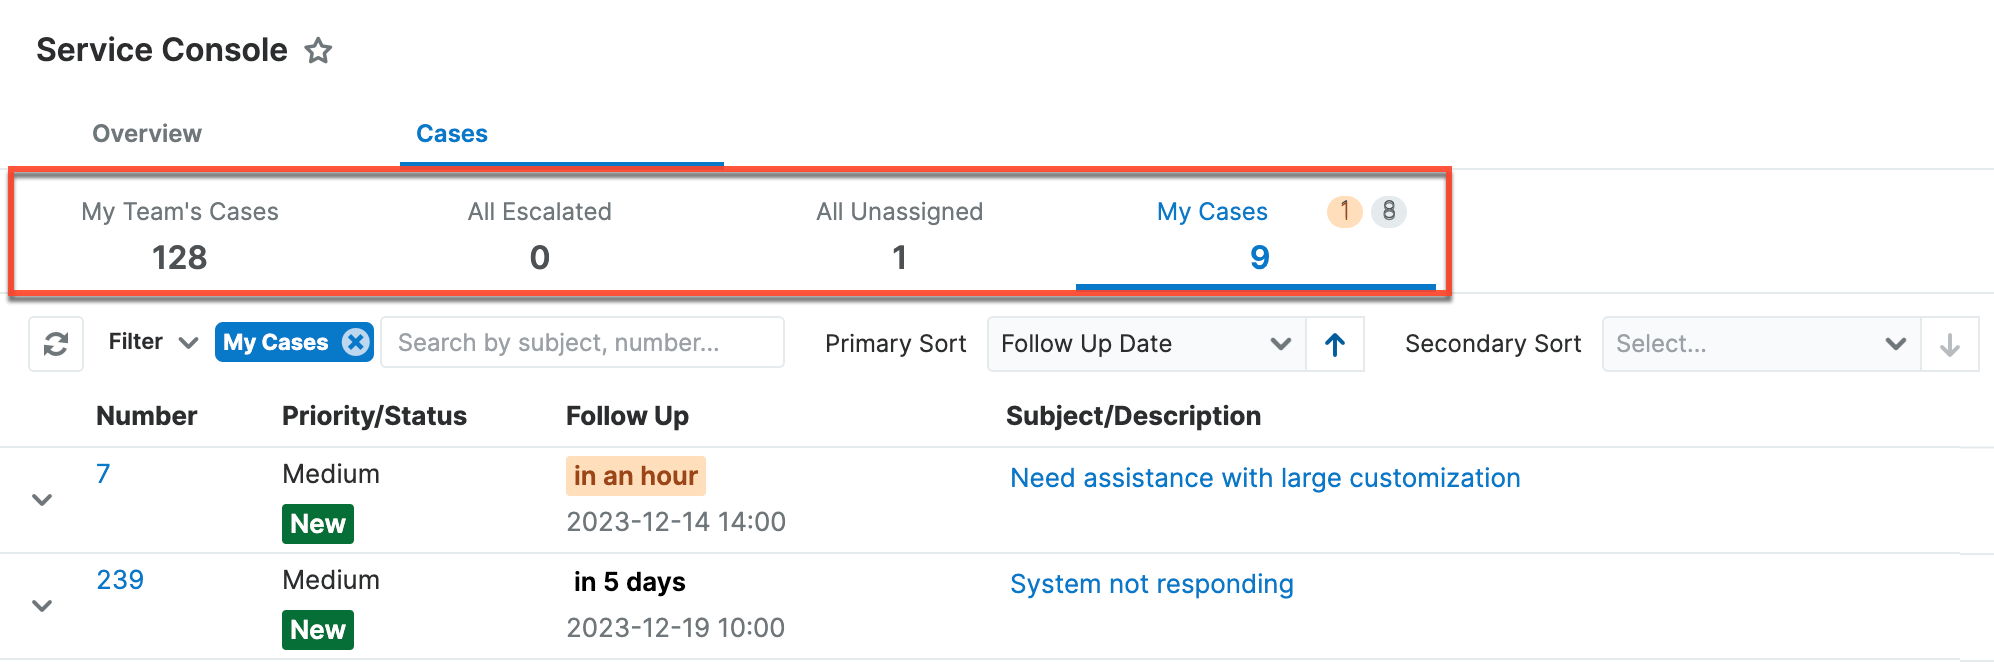
The Cases tab itself includes counts of cases grouped according to how soon their follow-up dates are due. The search bar below the metric tabs allows you to easily search for a case record in the currently displayed list view, and you can use the filter options in the search bar to narrow the list view results further. Actions you can take for each case are available in a dropdown menu to the left of each row. Each row of the prioritized list contains detailed case information and can be clicked to open a Case focus drawer in order to further investigate and work each case to resolution. The list view automatically refreshes every five minutes to keep its counts, statuses, and follow-up date information current.
Metric Tabs
Metric tabs are predefined filters deployed to teams for multiple unified team views. Metric tabs are located in the metric bar within the Cases tab. Each metric tab is clickable and when clicked will show a new filtered list view. Each tab has its own settings, and the metric bar also has its own settings. The following metric tabs are displayed in the Service Console by default: All Escalated cases, All Unassigned cases, My Cases, and My Team's Cases. Metric tabs can only be added and edited by an administrator; please see the Console Management and Metrics pages for more information.
Organizing Metric Tabs
Regular users can set their own order for metric tabs on the metric bar. Click the Organize option on the metric bar's three-dots menu. While metric tabs may be dragged to the visible column, you must click the "x" on the tab to send it to the hidden column.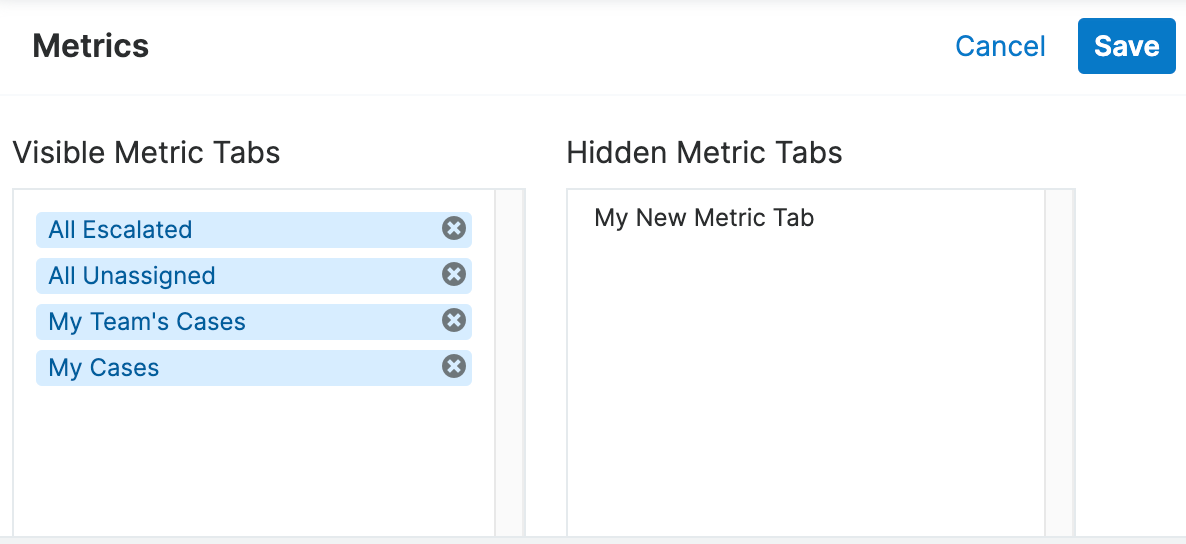
If all metric tabs are hidden from view, you will see "No Metric Tabs Visible. Choose "organize" to make metric tabs visible." Additionally, if no metric tabs are set up, the notification will read "No Metric Tabs Configured. Please contact your administrator." If you wish to reset your metric tabs to the default setting, click Organize on the three-dots menu on the metric bar and scroll to the bottom of the visible metrics settings. Here, there is an option to restore the default admin settings.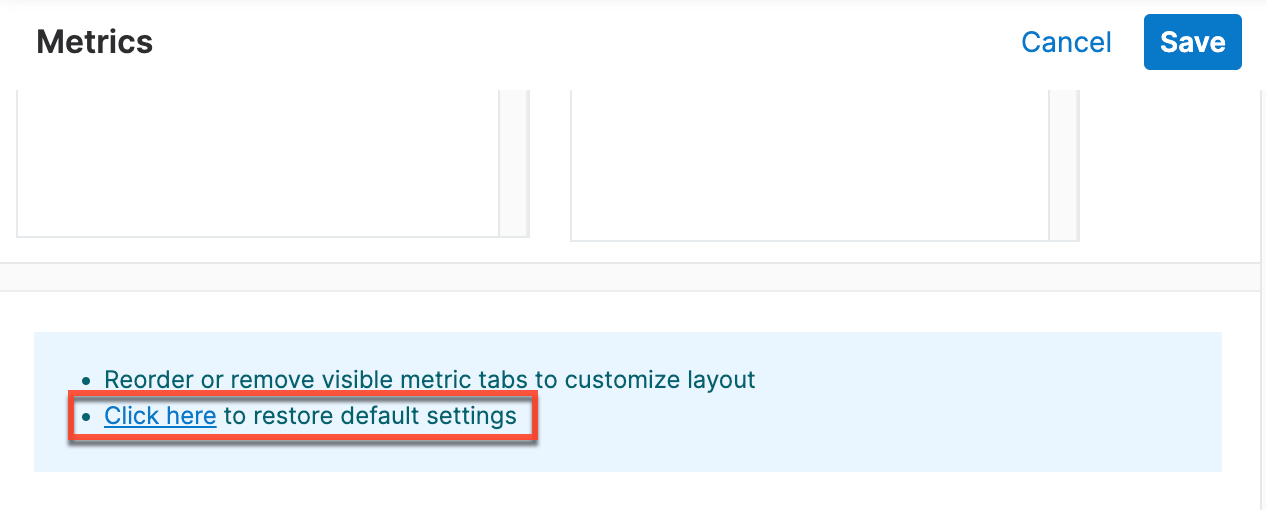
When an administrator deploys a new metric tab, it will show up as the first metric tab in the metric bar. Metric tabs are sorted by the Date Modified field by default, which means that newly changed tabs will appear first. Once deployed, each agent may use the "Organize" option to configure their tabs to their liking.
Alternatively, if you wish to simply remove a specific tab, you can use the Hide option on the individual tab. Hover over a metric tab to see the tab's three-dots menu to access the HIde option. If you wish to see the tab again, use the Organize option in the metric bar settings to display tabs that have previously been hidden.
To see all the details of how a specific metric tab is configured, use the View Details option. This will open a read-only view of the settings and filters set on the metric tab, as well as the list layout.
Metrics Module
The Metrics module is where metric tab settings and layouts are stored. For non-admin users, this module is read-only. You can use the Manage option in the metric bar settings to access this module. For further information on the fields, layouts, and settings in this module, please see the Metrics documentation in the Administration Guide.
Case Counts
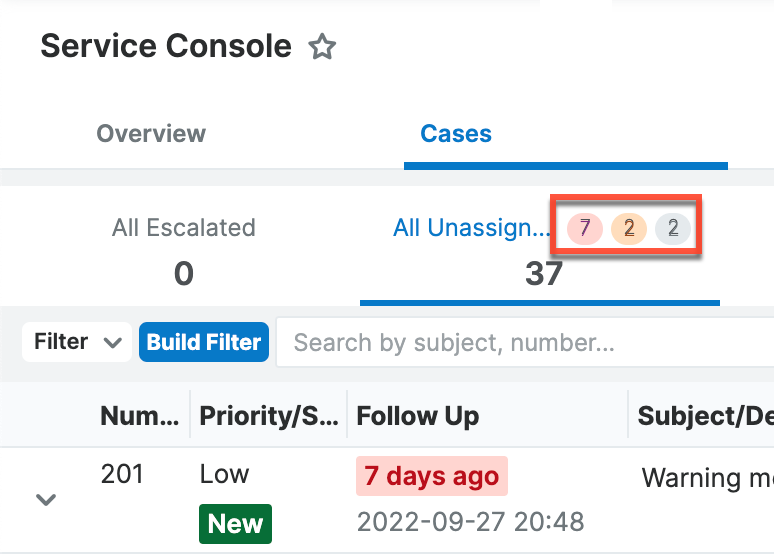
The Cases metric tabs include counts of all cases that are in the current user's view. The counts are broken into three groups according to follow-up date and colored red, yellow, or white based on how much time you have until they are due:
- Red: The number of cases assigned to the user with a follow-up date that has already passed
- Yellow: The number of cases assigned to the user with a follow-up date in the next 24 calendar hours
- White: The number of cases assigned to the user with a follow-up date more than 24 calendar hours in the future
Note: The Follow Up Date field is set according to your organization's SLAs and business hours by the Stock SugarBPM template which requires admin configuration prior to use.
Note: The yellow and white counts use 24 calendar hours and do not take into account business hours. This means that cases due within the next work day may not appear in the yellow box. For example, when a business center is closed over the weekend, on Friday afternoon, a case due Monday morning will be counted in the white box rather than the yellow box even though it is due within the next business day.
Console Search and Sorting
Below the Cases tab's metric bar, a search bar displays which allows users to easily search by the case's subject or number and pull up matching records in the list view. The search bar also includes a Filter option allowing you to narrow your search further using one of the default filter options. Please note that admin users and the user assigned to the Service Console dashboard have the ability to define a filter for the list view, but you can apply additional filters or create new filters via the Build Filter option of the search bar to narrow the list view results further. For more information on how to apply and create filters, refer to the User Interface documentation. To update the filtered list view with the most recent results, click on the Refresh icon to the left of the search box.
To the right of the search bar, all users can set the primary and secondary sort order of the currently selected metric tab. This overrides the primary and secondary sort order set by the administrator when the metric tab was created and allows users to organize and prioritize cases to suit their needs. 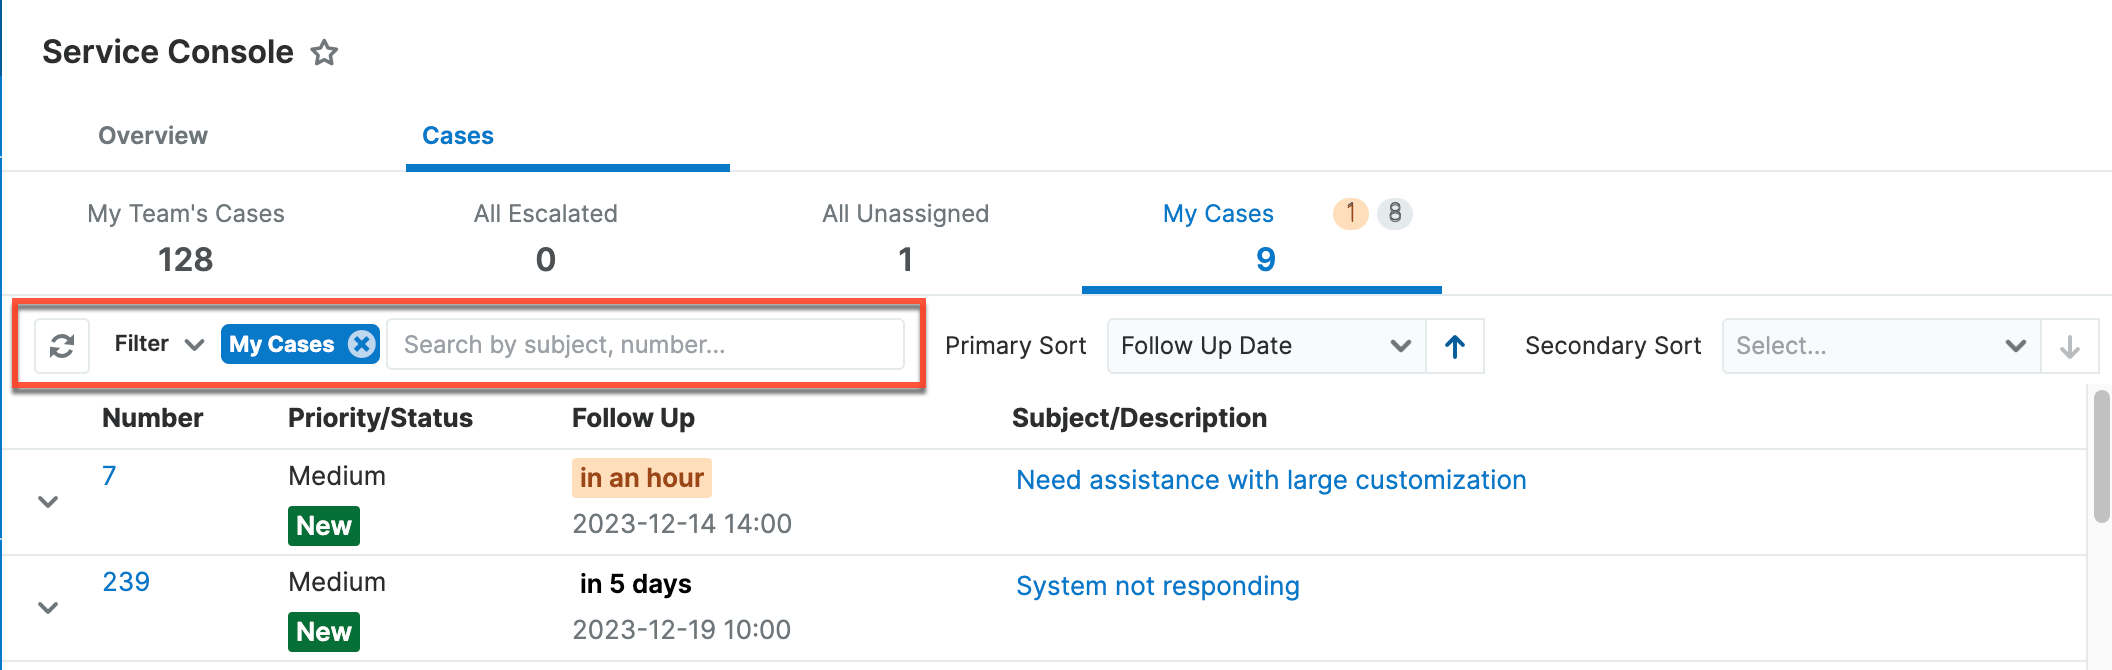
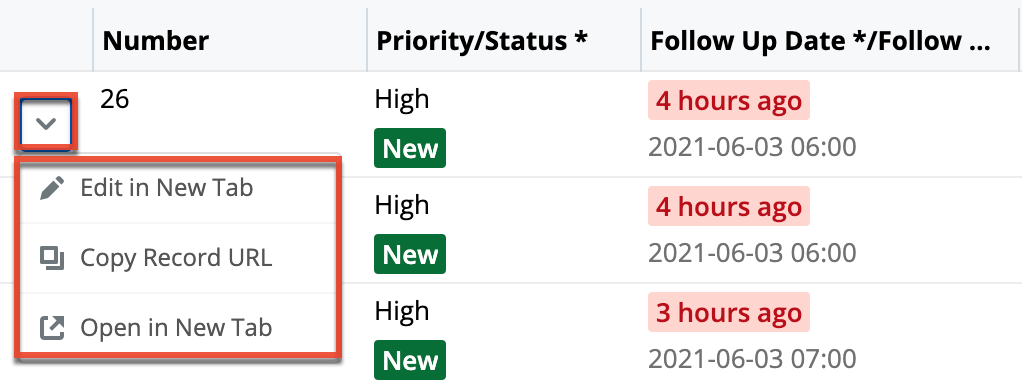
Row Actions
To the left of each row is a dropdown menu of actions you can take on the row's case. Click the down arrow to access the following options:
- Edit in New Tab: Opens a new tab with the case's record view in edit mode
- Copy Record URL: Copies the URL of the case to your clipboard
- Open in New Tab: Opens a new tab with the case's record view
To the right of each row, there is a pencil icon to inline edit from the prioritized list view quickly. Click this button to begin editing the row and when complete, click the checkmark icon to save the changes or click the X to cancel. Additionally, instead of clicking the pencil icon, you can also double-click the row to start editing.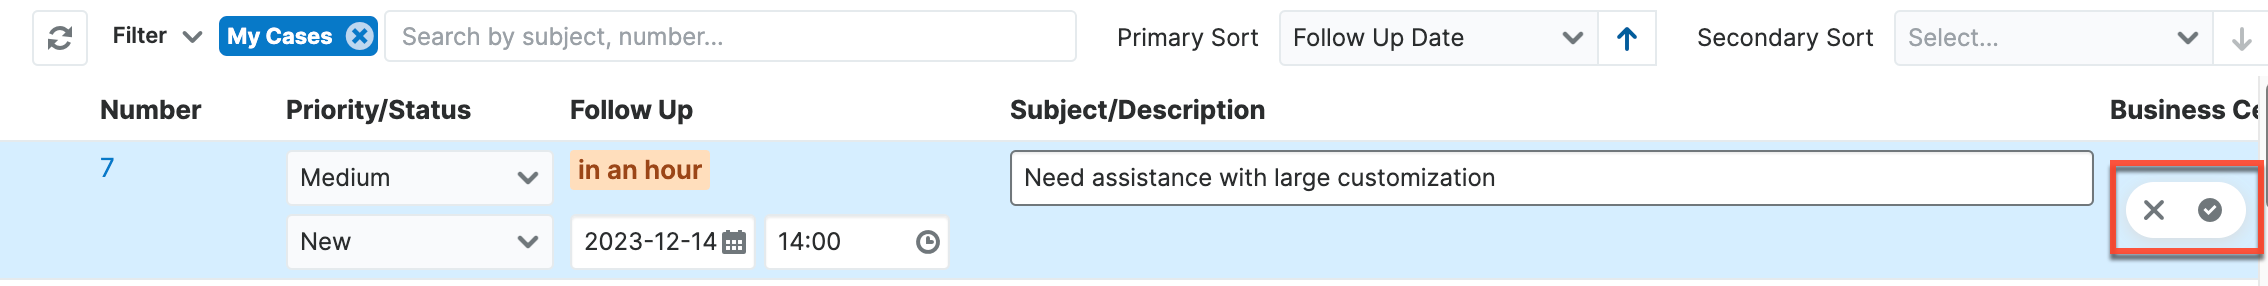
Case Information
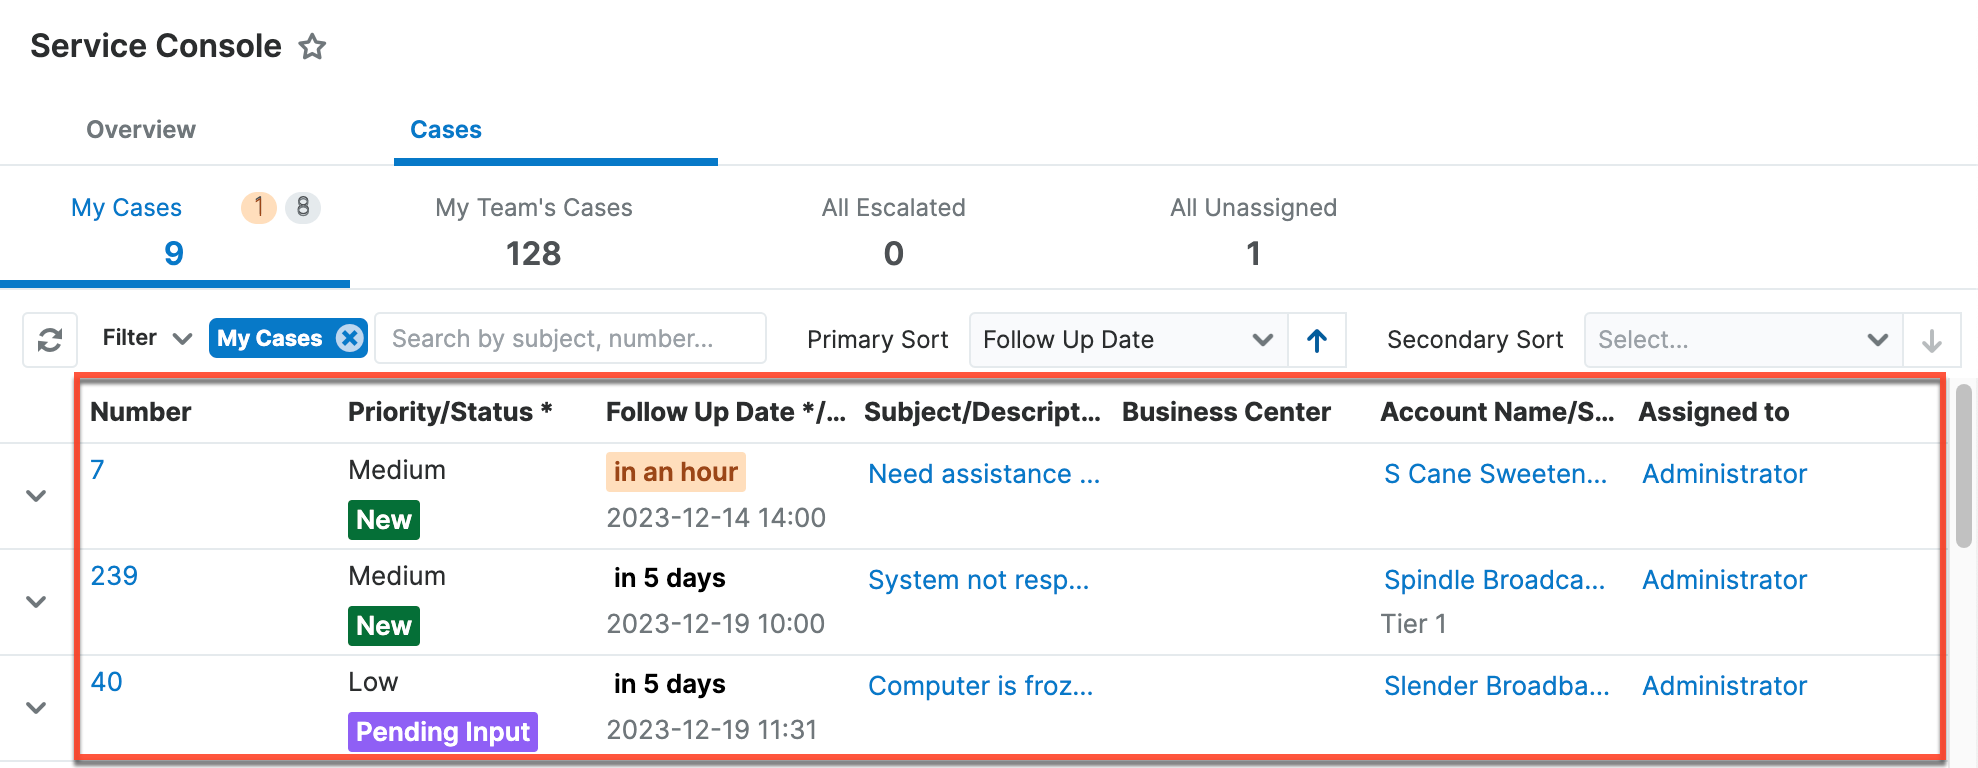
Clicking anywhere within a case's row in a list of cases opens the Case focus drawer within the Service Console. Fields with an asterisk to the right of the field name (e.g., Status *, Follow Up Date *) are widget-type fields that provide data from one or more fields in the module in a different manner.
By default, the following information is displayed in the list view for each case in the Service Console:
Note: Admins and the user assigned to the Service Console dashboard can configure the Cases tab lists to choose which fields to display as columns in the list view as well as the order in which they appear. They can also enable or disable column freezing for the first column.
- Number: The case's Number field
- Priority: The case's Priority field
- Status: The case's Status field, stacked beneath its priority and color-coded as follows:
- Green: New
- Blue: Assigned
- Purple: Pending Input
- Time until follow Up: The amount of calendar time until or since the follow-up date and color-coded as described below, stacked on top of the case's Follow Up Date field
- Red: A follow-up date that has already passed
- Yellow: A follow-up date in the next 24 calendar hours
- White: A follow-up date more than 24 calendar hours in the future
- Follow Up Date: The case's Follow Up Date field, stacked beneath the amount of time until or since the follow-up date
Note: The Follow Up Date field is set according to your organization's SLAs and business hours by the Stock SugarBPM template which requires admin configuration prior to use. - Subject: The case's Subject field, stacked on top of its description
- Description: The case's Description field, stacked beneath its subject
- Business Center: The case's Business Center field
- Account Name: The case's related account's name, stacked on top of the account's service level
- Account's Service Level: The case's account's service level, stacked beneath the account's name
- Assigned To: The user assigned to the case
For more information on case fields, please refer to the Cases documentation.
Case Focus Drawer
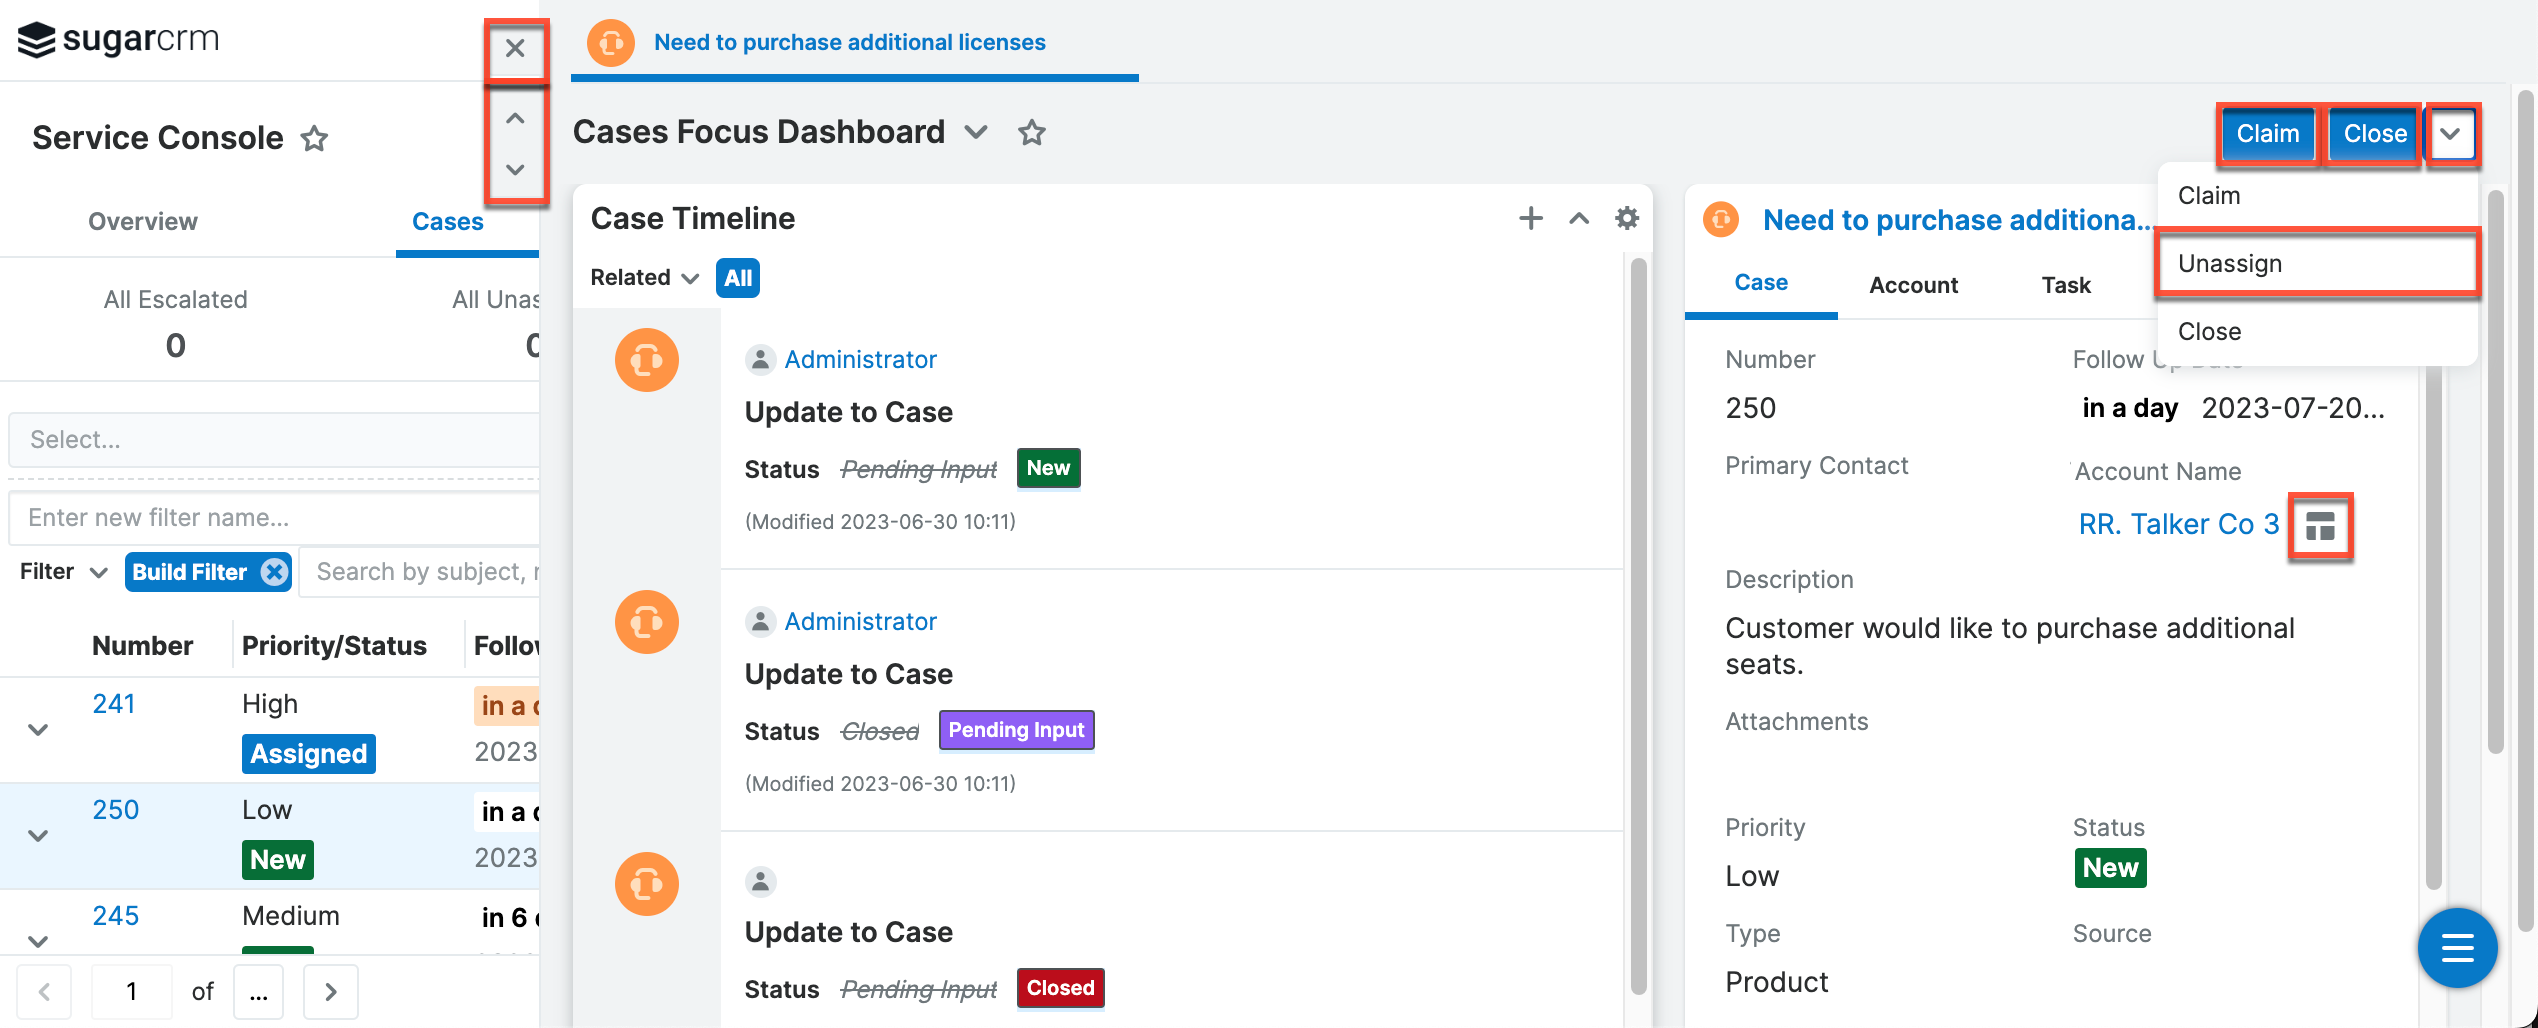
Clicking a case's row in the Service Console opens a focus drawer that serves as a single location to gather information about the case and its related records, review past interactions and progress, communicate with the customer, and process the case to its completion. You can view key details related to the next or previous case record in the list view by clicking the up or down arrow to the left of the drawer. To close the drawer, click the "x" icon at the top left of the drawer or press your Escape (esc) key. While the prioritized list view is refreshed automatically every five minutes or after the focus drawer is closed, the Cases focus drawer does not. Switch between cases or close and reopen the drawer to see the latest information.
There are two types of focus tabs that can be opened in a drawer: focus dashboards and focus record views. Clicking the Focus icon opens a focus dashboard, which displays a 360-degree view of the linked record through a set of dashlets containing relevant information such as the record's related records, related activities, and the case timeline. You can also click anywhere in a case's row in the console's list view to open the focus dashboard. In contrast, clicking a link, and not the Focus icon, will reveal a focus record view, which provides a thorough look into the record, including the record view's dashlets and subpanels. For more information on focus drawers, refer to the User Interface documentation.
The Service Console's focus dashboards can have Action Buttons in the header as configured by an admin. Out of the box, the Service Console has two Action Buttons, "Claim" and "Close", and an Action Menu option, "Unassign". To learn more about these options, please refer to the Cases documentation.
Note: Admin users with a Sugar Serve or Enterprise license type and a regular Serve or Enterprise user assigned to the "Service Console" and "Cases Focus Dashboard" dashboards have the ability to change the layout and the configuration of dashlets. For more information about editing dashlets, refer to the Dashboards and Dashlets documentation or the documentation for each of these specific dashlets linked in the sections below.
The dashboard you see could have the following dashlets, depending on how the admin has configured it: the Case Timeline dashlet, Case Record dashlet, Knowledge Base Search dashlet, and Purchase History dashlet.
Case Timeline Dashlet
The Case Timeline dashlet dashlet displays the case's related emails, calls, meetings, notes, messages, and tasks along with select field updates (e.g., Assigned To) in the form of record cards. Each card in the dashlet displays key information (e.g., subject, description, guest's name) for the related record and the cards are sorted in chronological order based on the date they occur or are due (for tasks), with the most recent at the top.
When previewing emails, any email attachments can be downloaded by clicking the attachment's name. You can also quickly create new interactions by clicking the Plus icon in the dashlet header and selecting the type of record you wish to create. Doing so will open a quick-create drawer and automatically select the current case in the new record's Related To field. For more information on Timeline dashlet, refer to the Sugar Dashlets documentation.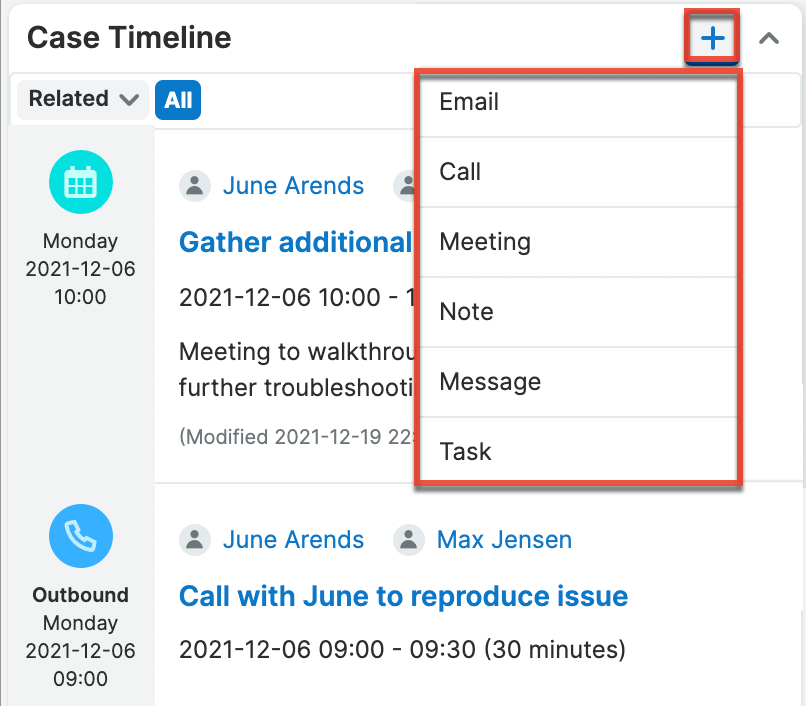
You can open focus tabs for records found in the Timeline dashlet by clicking record links or the Focus icon that appears next to them on hover. This allows you to navigate a wide array of data without leaving the console.
Case Record Dashlet
On the top right of the Case focus drawer is a Record View dashlet by default. Out-of-the-box, it is configured to display the case you are currently viewing as well as additional tabs containing its related account, tasks, contacts, and documents. The dashlet, as a whole, provides a concise replacement for the case's full record view by displaying not only the case's fields but also making the case's most important subpanel contents available via additional tabs within the dashlet. The case record and its account can be edited directly in the dashlet by clicking an individual field or clicking the Edit button on the appropriate tab. Once you are done editing, click the Save button to preserve your changes.
Hovering over certain links such as the Account Name will display a Focus icon that can be clicked to open a new focus tab. Additional links clicked will open additional tabs in the focus drawer.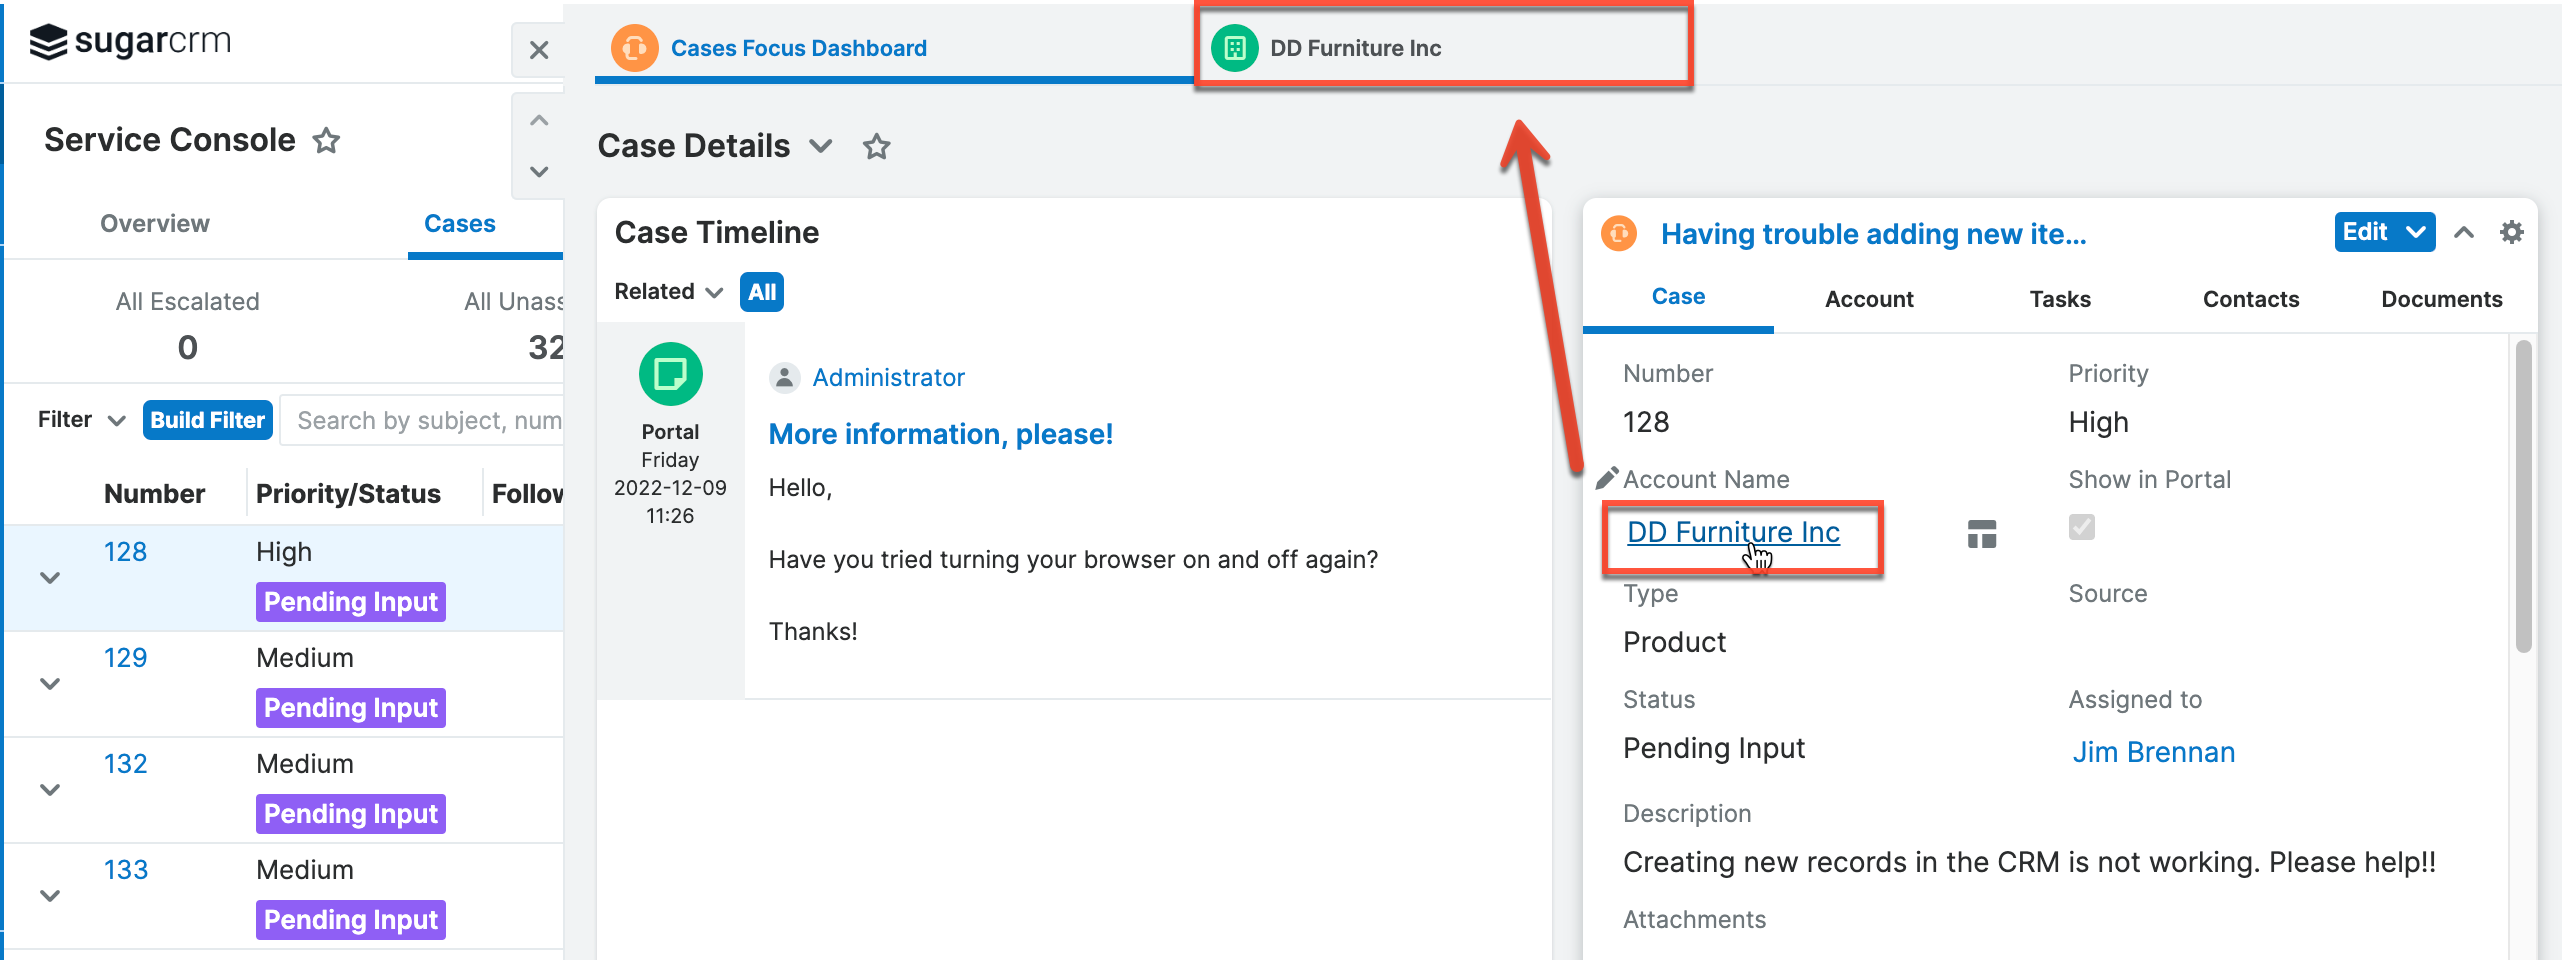
Additionally, an Actions menu is available in the Case Record View dashlet allowing you to escalate the case. For more information, refer to the Escalations documentation.
If you wish to access the case's complete record view, click the dashlet title to open a focus tab containing the record. If you would rather see the information outside of the focus drawer (e.g., a new browser tab), simply hover over the case's name in the dashlet and click the arrow icon that appears to navigate to the record. The other related record tabs in the dashlet display lists of records with a relationship to the current case record. For more information, refer to the Sugar Dashlets documentation. 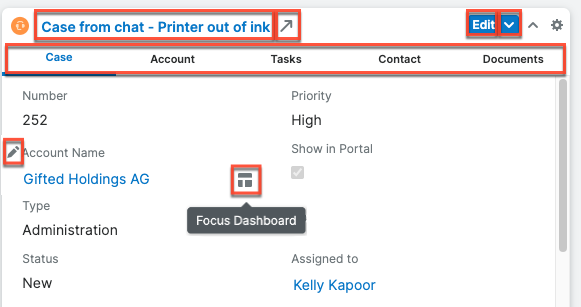
Knowledge Base Search Dashlet
The Knowledge Base Search dashlet is displayed in the bottom right corner by default to give you quick access to published articles that may help in troubleshooting a customer issue. It includes a search bar that lets you find articles with matching titles or contents. To search, simply enter a keyword and a dropdown will appear containing matching articles. Clicking an article opens it in a new browser tab.
Below the search bar, you can see a tree-based view showing the structure of the knowledge base. Here, you can navigate through the folders to browse articles in specific categories and click articles to open them in a new browser tab. See the Sugar Dashlets page for more details on this dashlet. 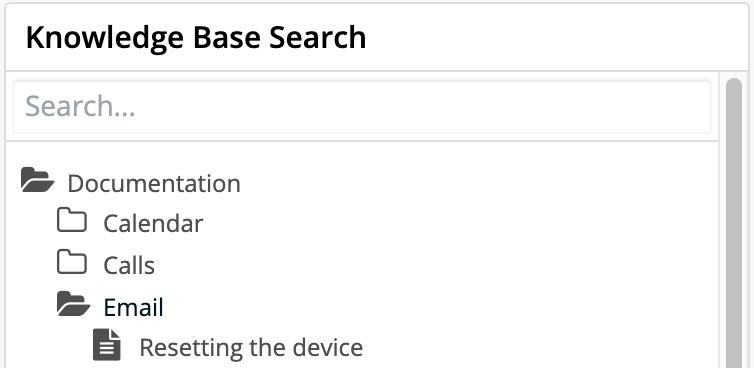
Purchase History Dashlet
While not available by default, it is worth mentioning that the Purchase History dashlet can be added to the Case focus Drawer by an administrator or the user assigned to the Service Console dashboard. The dashlet shows a list of all the current account's purchases regardless of the start or end date of the purchase record. The dashlet shows each purchase's name, date range, quantity, and total. For more information, refer to the Purchase History Dashlet section of the Sugar Dashlets documentation.