Reports
Overview
Sugar's Reports module allows users to build, generate, and manage reports for modules such as Accounts, Contacts, Calls, etc. Reporting is a valuable tool in Sugar as users can gather data from various modules to generate vital information for their organization.
There are four types of reports (Rows and Columns Report, Summation Report with Details, Summation Report, Matrix Report) available in Sugar. Some reports can be rendered as charts that allow you to drill through to see the corresponding records. This page covers functionality specific to the Reports module. For instructions concerning views and actions that are common across most Sugar modules, such as viewing, editing, etc., please refer to the Working With Sugar Modules section of this page.
Note: Some of the examples in this documentation contain steps to create Opportunity reports. Users with Revenue Line Items enabled should adjust the steps to target the Revenue Line Items module. Users with Sugar Serve license types will not have access to opportunities or revenue line items but can adapt the steps to other modules in their Sugar instance. For more information on license types and the module functionality available for each type, refer to the License Types Matrix.
Report Fields
The Reports module contains a number of stock fields that come out-of-the-box with Sugar. For information on using and editing various field types, refer to the User Interface documentation. The definitions below are suggested meanings for the fields, but the fields can be leveraged differently to best meet your organization's needs. The following fields are available when viewing the Reports list view.
| Field | Description |
| Accessed On | The date the report record was last opened. |
| Chart Type | The chart type (if applicable) defined for the report. |
| Date Created | The date the report record was created. |
| Date Modified | The date the report record was last modified. |
| Description | A description or other key information about the report. Note: The Description field is only viewable and editable via the list view preview. |
| Integration Sync ID | The sync key field used by external integrations to identify Sugar records in the external application. See the Integrate REST API endpoints in the Developer Guide for more details on how to use this field. Note: This field is not visible in the user interface. |
| Module | The target module (e.g., Accounts) associated with the report. |
| Name | The name of the report. |
| Report Type | The report type (Rows and Columns Report, Summation Report, Summation Report with Details, Matrix Report) specific to the report. |
| Tags |
User-created keywords that can be used to identify, organize, and group report records by common attributes. Note: The reports module contains over 100 report templates that are pre-tagged using a combination of the following out-of-the-box tags:
For more information on tags in Sugar, please refer to the Tags documentation. For more information on report templates, please refer to the Report Templates documentation. |
| Team | The Sugar team(s) assigned to the report record. |
| User | The Sugar user assigned to the report record. |
Report Types
There are four types of reports (Rows and Columns Report, Summation Report, Summation Report with Details, Matrix Report) available for users to create in Sugar. Please note that each report type provides users with information for records that meet the specified criteria, but each type displays the report results in different layouts. All report types can be displayed on a dashboard via the Report Dashlet.
Rows and Columns
The Rows and Columns report is the most basic report to create out of the four report types. The report results display the data in a simple rows-and-columns format displaying values for the selected display column fields for all records meeting the specified criteria. For more information about creating a Rows and Columns report, please refer to the Rows and Columns Report section.
Summation
The Summation Report provides computed data based on the selected fields for records meeting the specified criteria. You can group the report based on one or more fields from the target or related module. The report result displays the data in groups, summarized using computed derivatives (e.g., SUM, AVG, MAX, MIN) from numeric-type field values (e.g., Likely) as well as weighted amounts. Summation Reports can be viewed in a chart format. For more information about creating a Summation Report, please refer to the Summation Report section.
Summation Report with Details
The Summation Report with Details is a combination of the Summation-type and Rows and Columns-type report as you can group the data, get the total count of records, and choose display columns (e.g., Contact Name, Account Name, Email Address) as well. You can group the report based on one or more fields from the target or related module. Summation Report with Details can be viewed in a chart format. For more information about creating a Summation Report with Details, please refer to the Summation Report with Details section.
Matrix
The Matrix Report is also similar to the Summation-type report as it provides an overview of the computed data and displays the total summary count. The report results display in a grid table with row and column headers. The numeric field values for all display summaries appear on the table along with the total amounts for each row and column. Matrix Reports can be viewed in a chart format. For more information on creating a Matrix Report, please refer to the Matrix Report section.
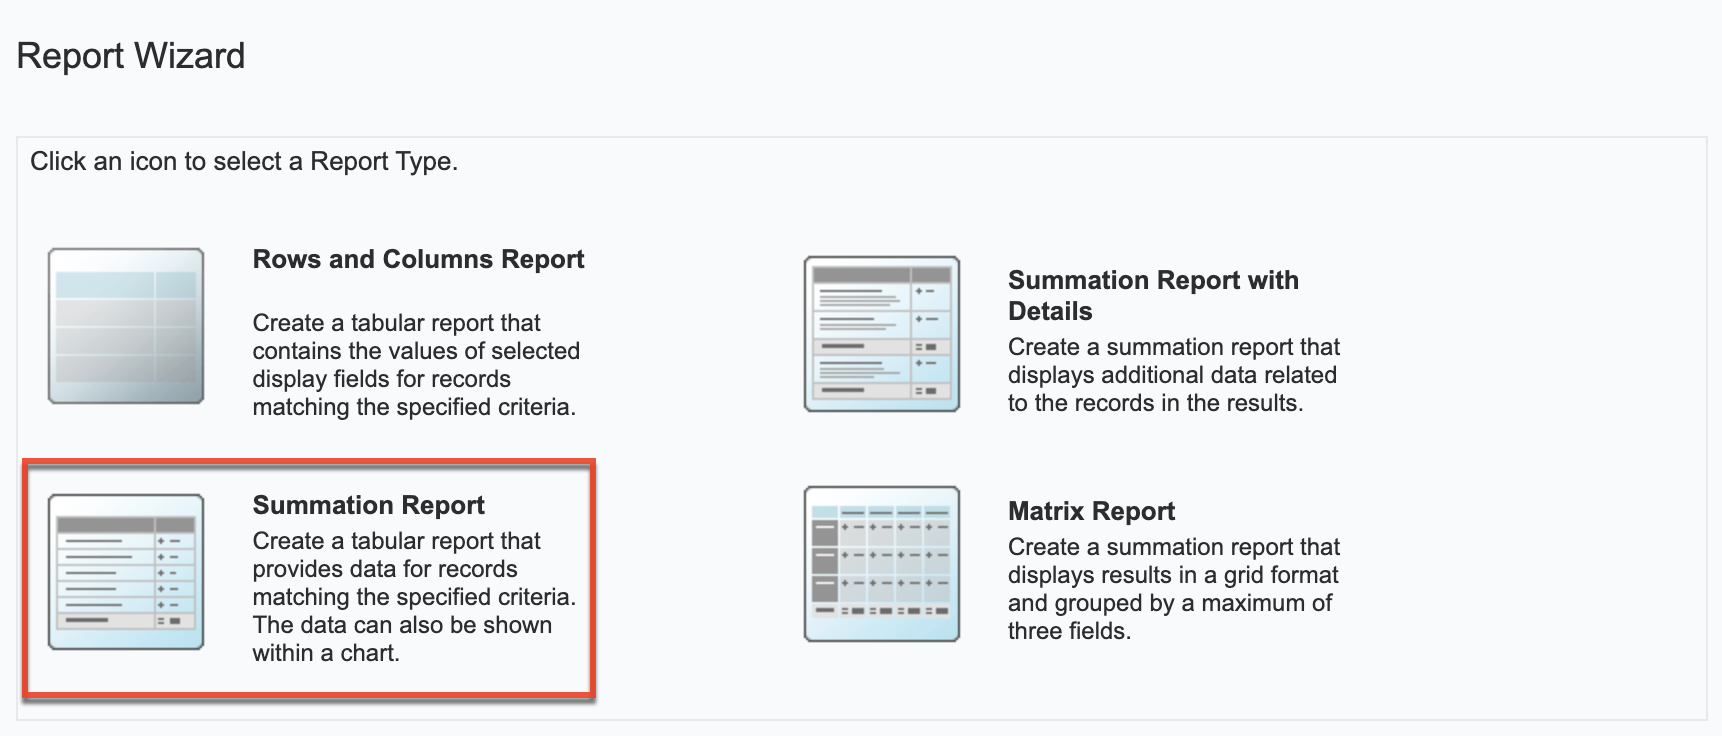
Creating Reports
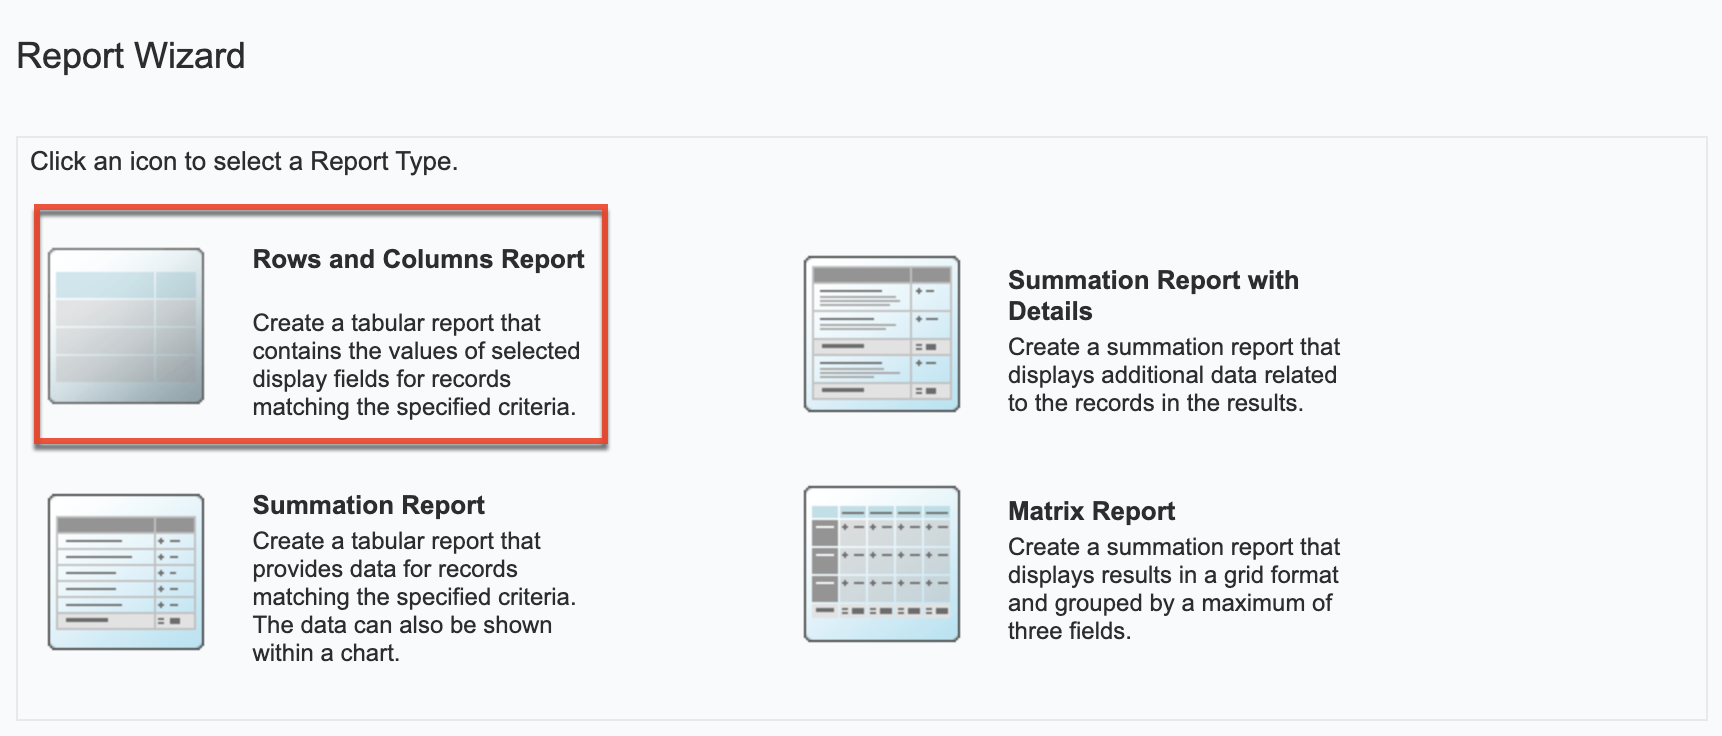
There are various types of reports (e.g., Rows and Columns Report, Summation Report with Details, Summation Report, Matrix Report) you can create via the Reports module. The first step of creating a report via the Report Wizard is to choose the report type, and the steps to create the report vary slightly depending on the report type chosen. Please note that you can create reports in Sugar via the Reports module itself using the Create option as well as by duplicating an existing report via the Duplicate option.
Creating via Reports Module
The most common method of report creation is via the Reports module using the Create button in the list view or the Create Report option in the module tab. This opens the Report Wizard which allows you to build the necessary report and generate the results accordingly. The following sections cover creating the four different report types via the Report Wizard.
Creating a Rows and Columns Report
Of the four report types, the Rows and Columns report is the most basic one to create in Sugar. Users can simply define filters to determine which records the report will include or exclude then choose the fields (e.g., Name, Email Address) they would like displayed in the report result. The Rows and Columns report creates a tabular report containing the values of selected display column fields for all records meeting the specified criteria.
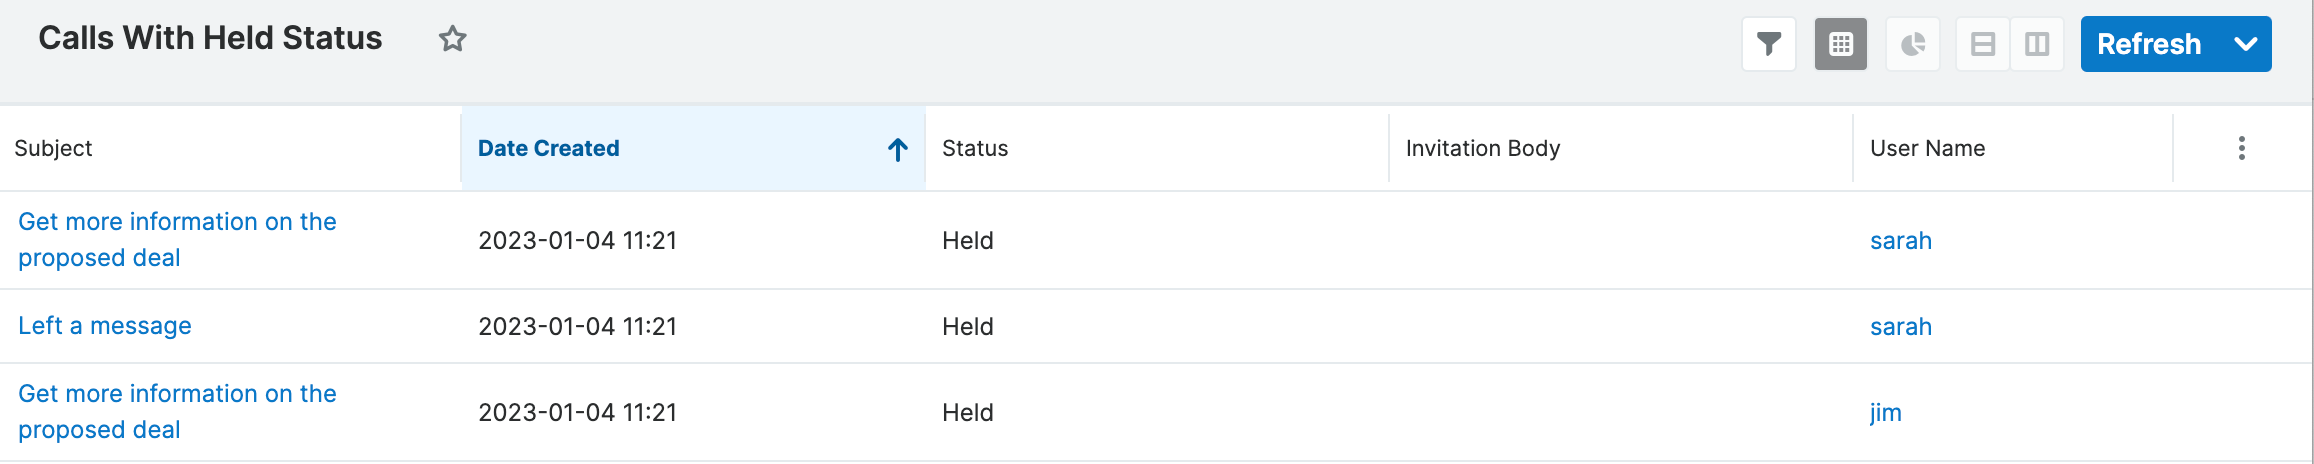
The following steps cover creating a Rows and Columns report for calls with a status of "Held" as an example:
- Click the three-dots menu in the Reports module tab and select "Create Report".
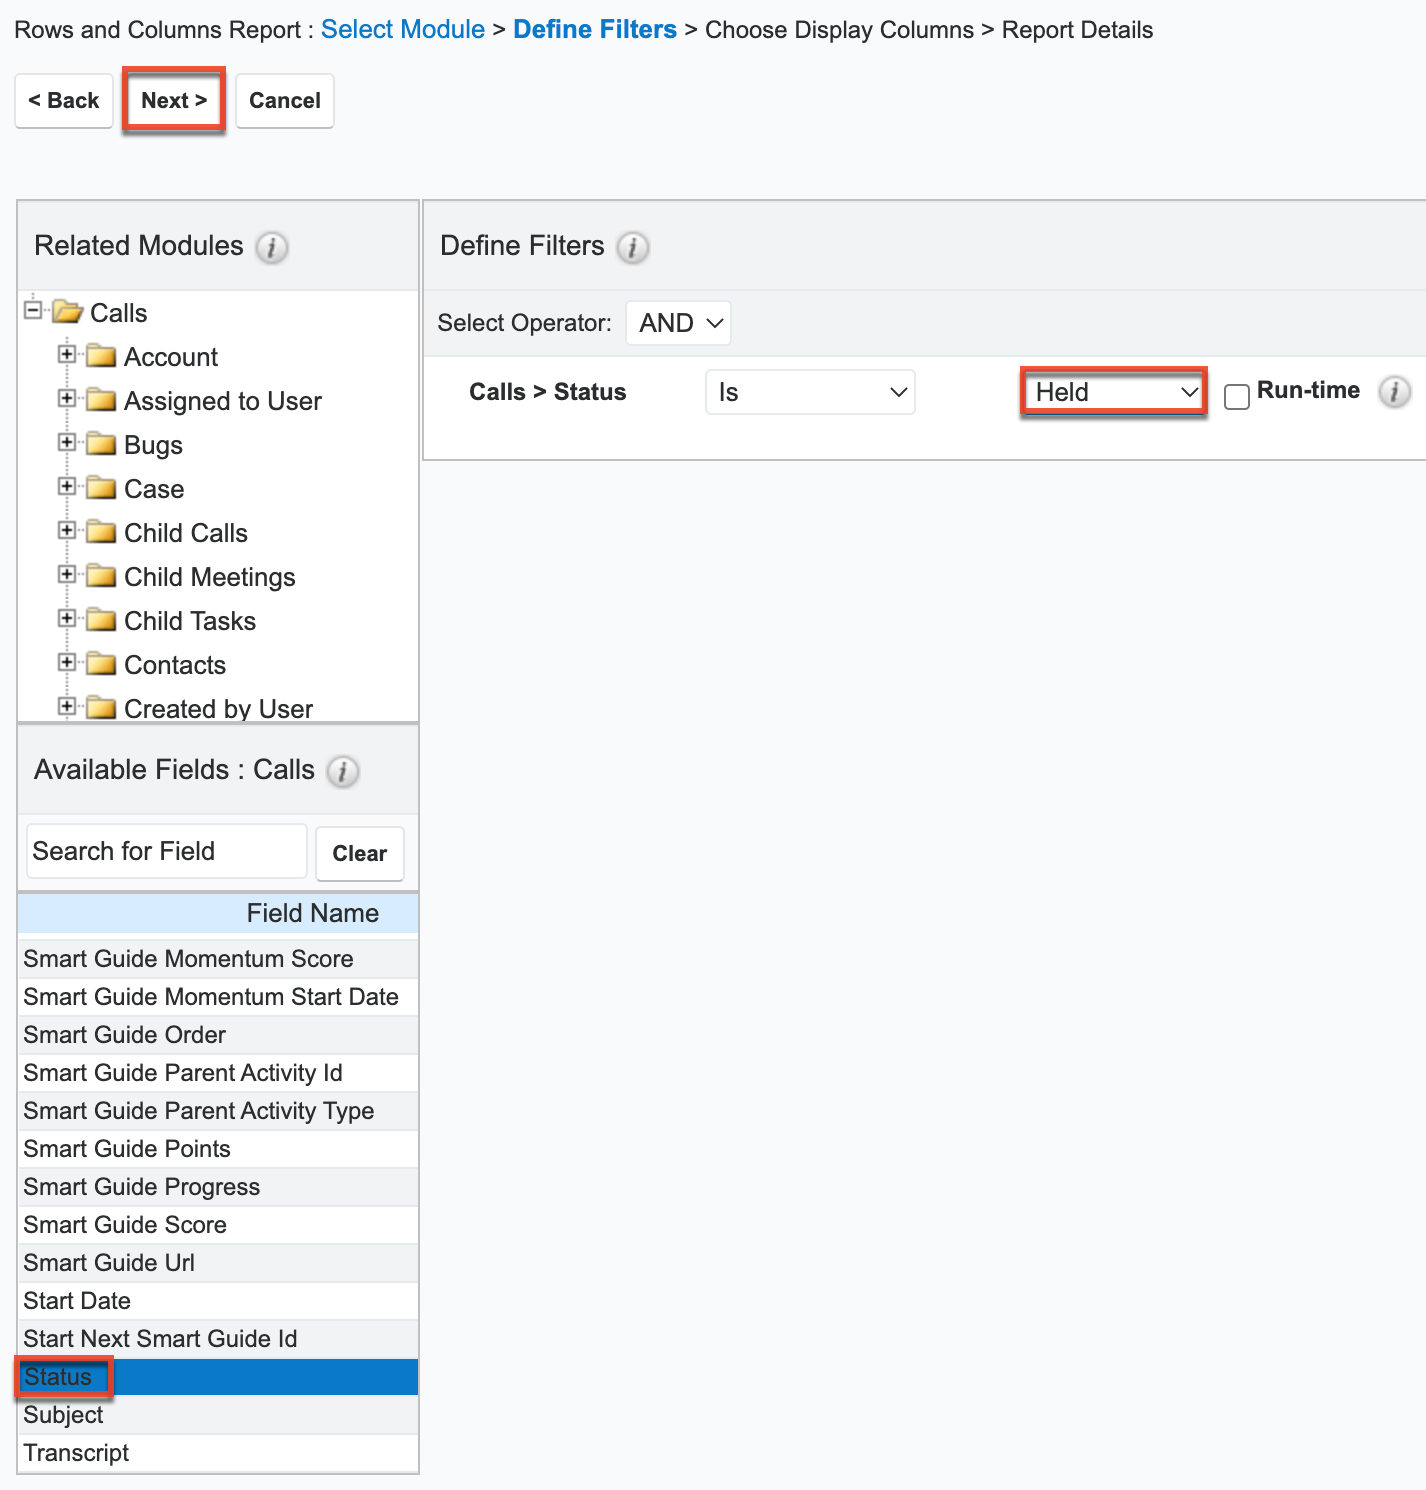
- Choose "Rows and Columns Report" as the report type and "Calls" as the target module in the following step.
- To filter on a field related to the target module, select it from the Available Fields list on the bottom left to add it to the list of filters. In this example, select "Status" to filter the report based on call records already held. Click "Next".
- For more information on report filters, please refer to the Report Filters section.
- For more information on report filters, please refer to the Report Filters section.
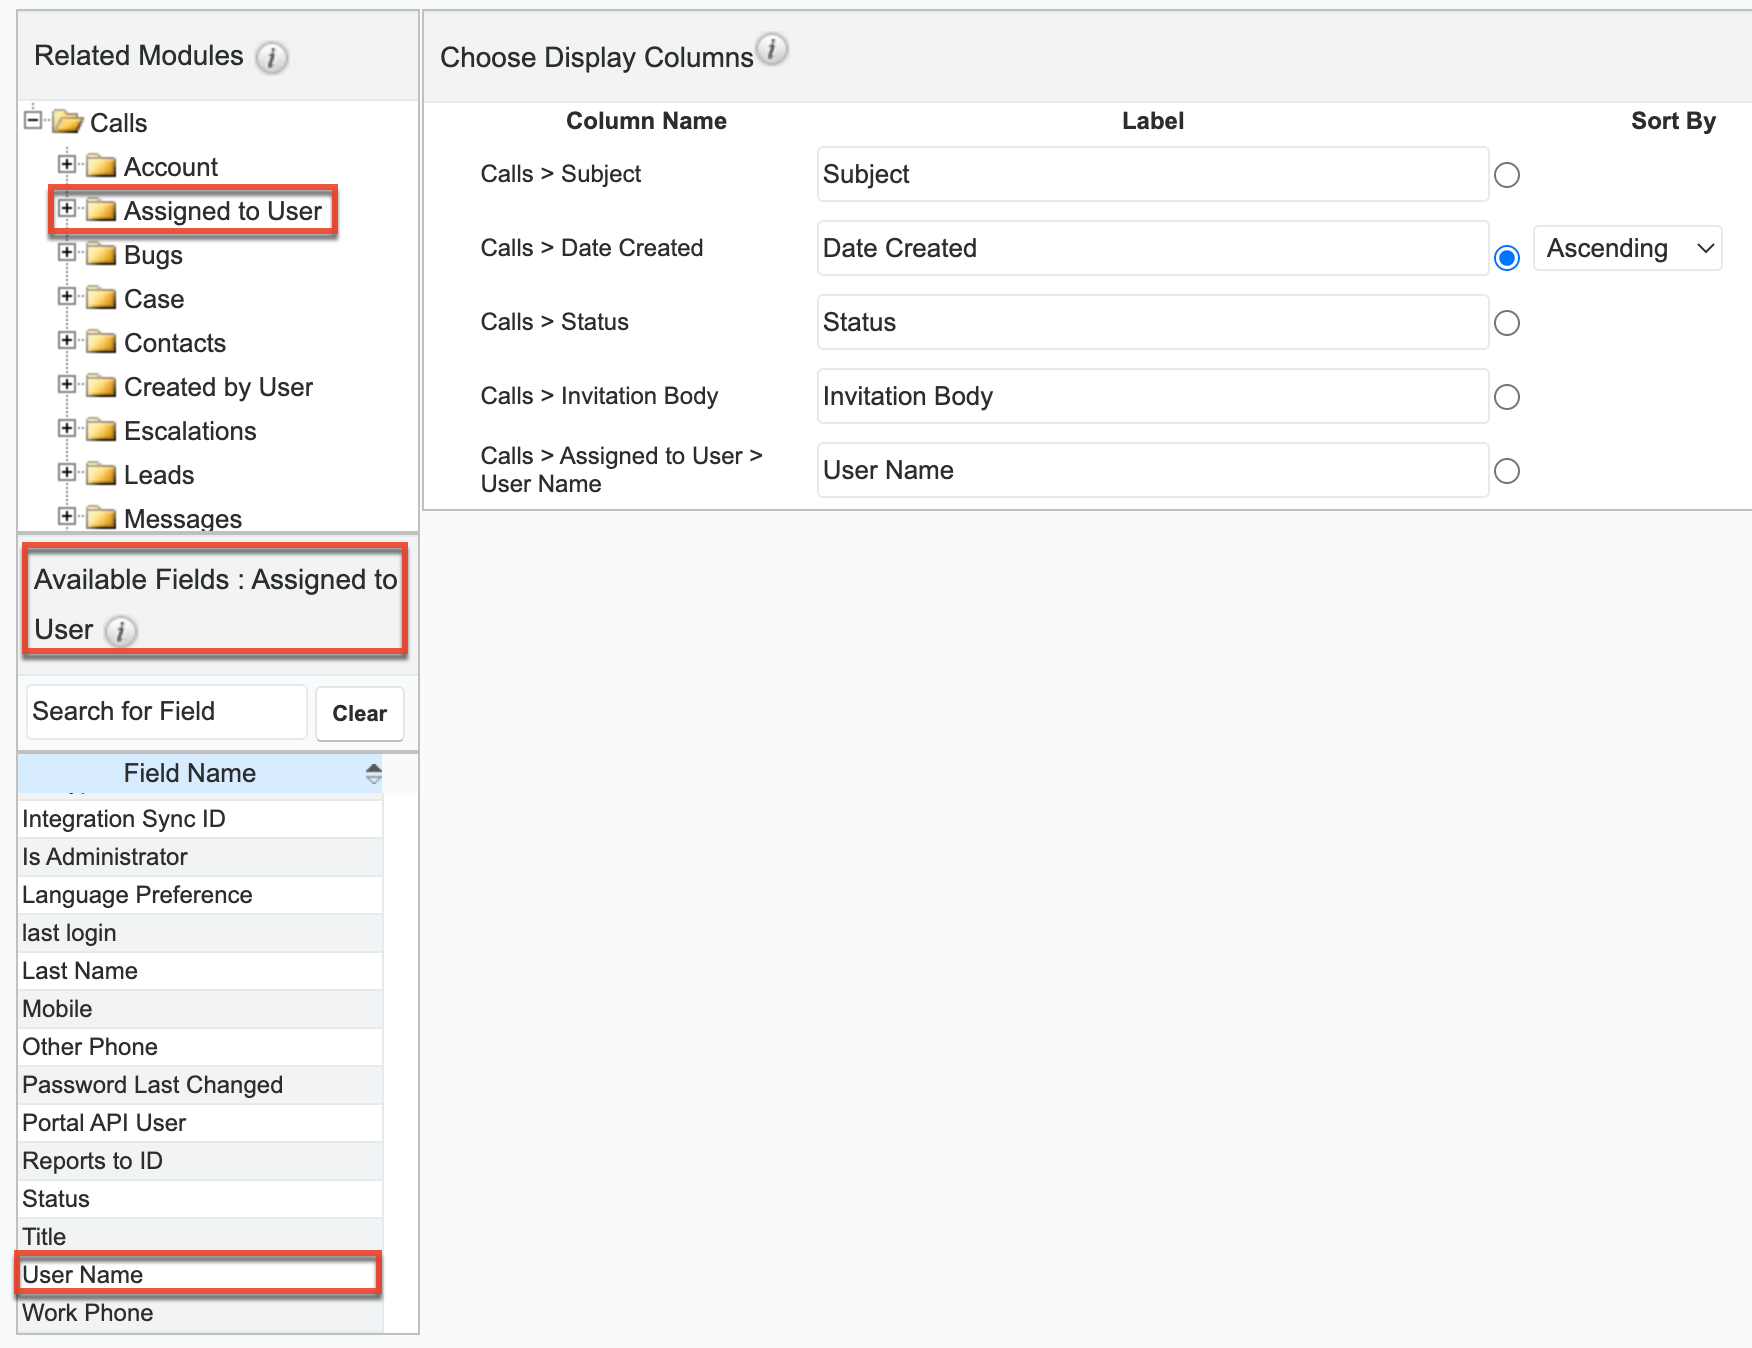
- On the Choose Display Columns step, select the fields you would like included in the report results from the Available Fields list then click "Next". We are adding the following fields as an example: Subject, Status, Invitation Body, Date Created, User Name, Contacts Name, and Account Name.
- For more information on selecting display column fields, please refer to the Report Display Columns section.
- Select "Subject", "Date Created", "Status", and "Invitation Body" in the "Available Fields: Calls" list, as these are fields contained in the Calls module. By default, the target module's fields display in the Available Fields list.
- Note: You can designate the generated report to be sorted by a specific display column field in either ascending or descending order. Simply mark the radio button next to the field label then select "Ascending" or "Descending" in the corresponding dropdown list.

- Note: You can designate the generated report to be sorted by a specific display column field in either ascending or descending order. Simply mark the radio button next to the field label then select "Ascending" or "Descending" in the corresponding dropdown list.
- For the User Name field, click "Assigned to User" from the Related Modules list at the top left then select "User Name" from the "Available Fields : Assigned to User" list.
- Note: User names are stored in their own table in the database and are related to the modules in Sugar. So even though the Assigned User field appears in various module layouts, they are not direct fields in those modules.
- Note: User names are stored in their own table in the database and are related to the modules in Sugar. So even though the Assigned User field appears in various module layouts, they are not direct fields in those modules.
- For the Contact Name field, click "Contacts" from the Related Modules list then select "Name" from the "Available Fields : Contacts" list.
- By default, the label for the Name field displays "Name", but you can change the label to "Contact Name" to differentiate the field between accounts and contacts. For more information on changing display column labels, please refer to the Changing Display Column Labels section.
- For the Account Name field, click "Account" from the Related Modules list then select "Name" from the "Available Fields : Account" list.
- Change the label for the Name field to display "Account Name". For more information on changing display column labels, please refer to the Changing Display Column Labels section.
- To place the fields in a different order on the report, drag and drop the field rows within the display column list.
- The first field (Subject) on the display columns list represents the first column of the report, the second field (Date Created) is the second column, and so forth. For more information on changing the display column order, please refer to the Changing Display Column Order section.
- Click "Next" after adding all of the appropriate fields.
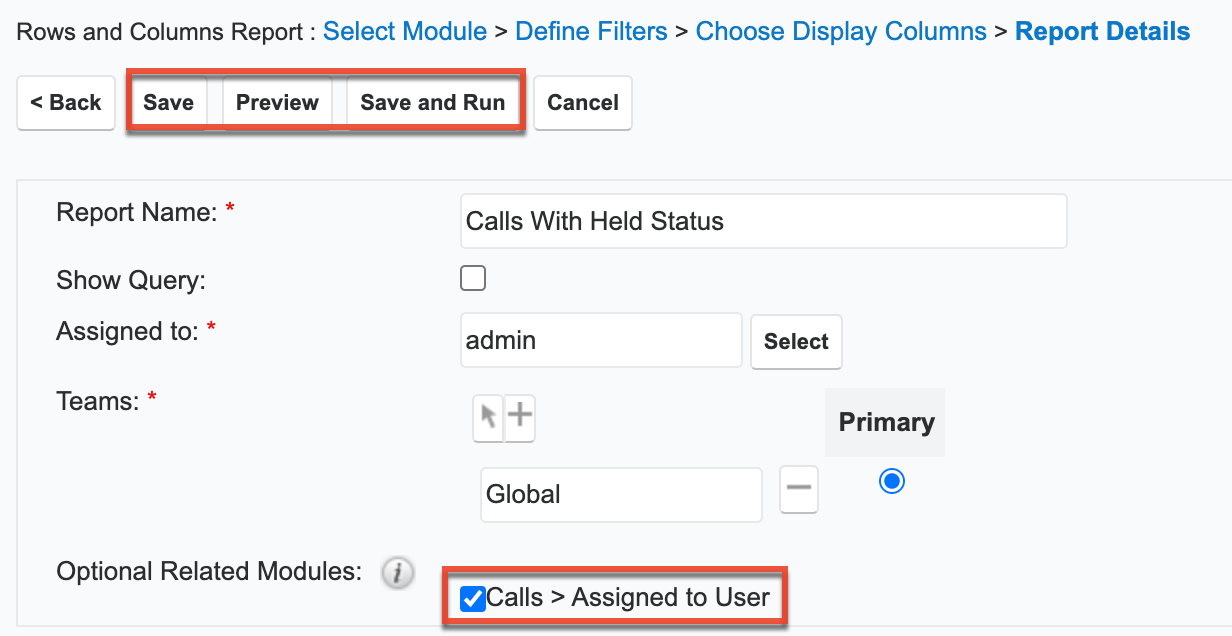
- On the Report Details step, enter the report name and assign it to the desired user and team.
- Please note that if you want your report to include all held calls whether or not they have an assigned user, related contact, or account, you must mark the Optional Related Modules boxes. For more information on marking related modules as optional, please refer to the Optional Related Modules section.
- Please note that if you want your report to include all held calls whether or not they have an assigned user, related contact, or account, you must mark the Optional Related Modules boxes. For more information on marking related modules as optional, please refer to the Optional Related Modules section.
- After entering the report details, click "Save and Run" to save and generate the report immediately.
- Clicking the Preview button allows you to preview the report before saving.
- Clicking the Save button saves the report without running it immediately.
Creating a Summation Report
The Summation Report groups and provides computed data for records that meet the specified criteria. You can choose a number of group-by columns to group the data in the report and can define group-by data for related modules as well. You can also drag and drop the group-by fields to a different order in the Define Group By step to change the layout in the report results. Please note that the Summation Report does not provide detailed information like Summation Report with Details and will not include any display columns in the report.
The following steps cover creating a report to capture closed won opportunities for Q1 2023 grouped by assigned user and the month it was closed as an example:
- Click the click the three-dots menu in the Reports module tab and select "Create Report".
- Choose "Summation Report" as the report type and "Opportunities" as the target module.
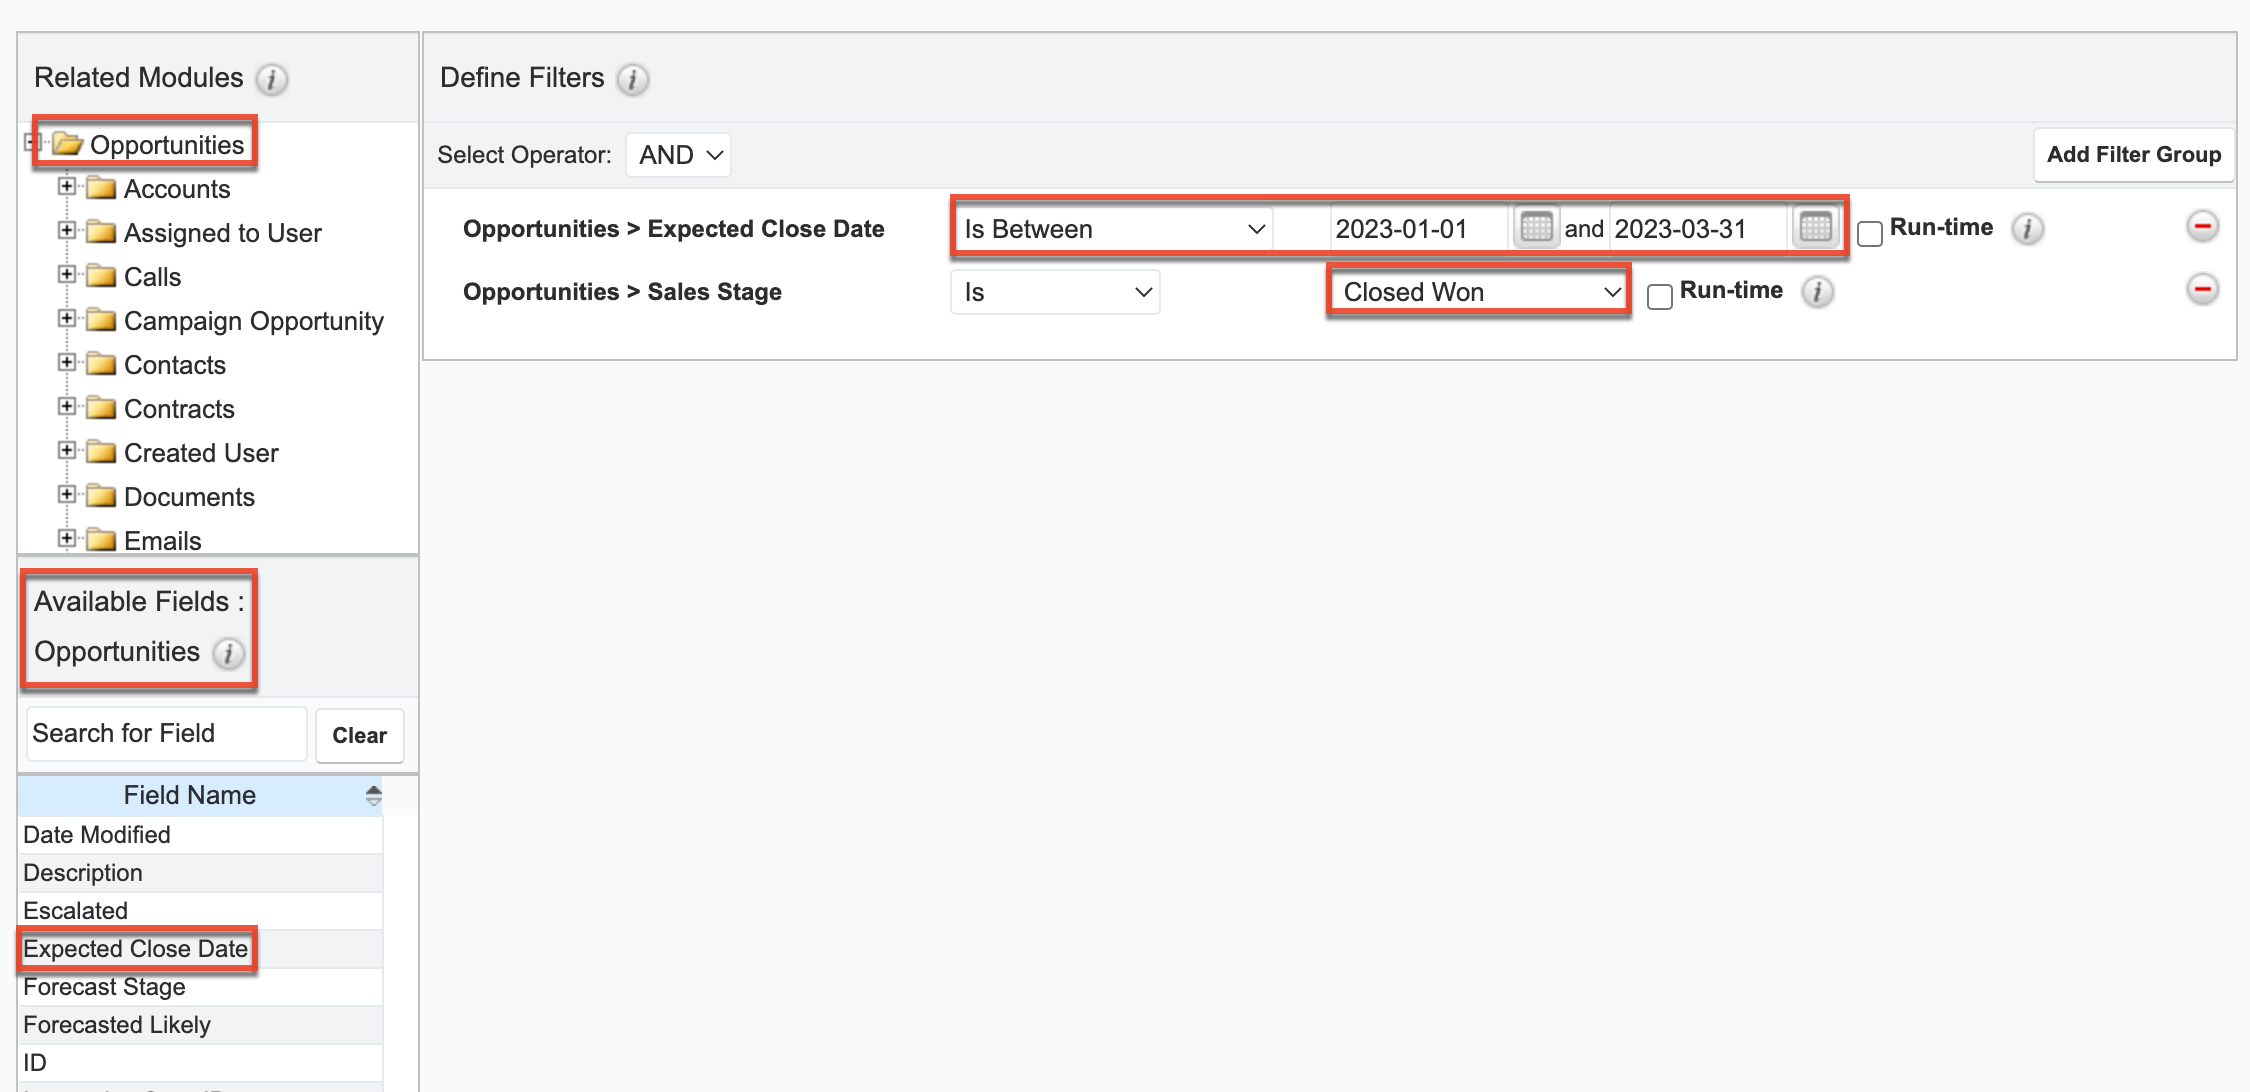
- Next, define the report filters as follows then click "Next":
- Select "Expected Close Date" from the Available Fields panel, then choose "Is Between" and select "2023-01-01" and "2023-03-31" from the options appearing to the right of the Expected Close Date filter.
- Select "Sales Stage" from the Available Fields panel, then choose "Is" and "Closed Won" in the dropdowns appearing to the right of the Sales Stage filter.
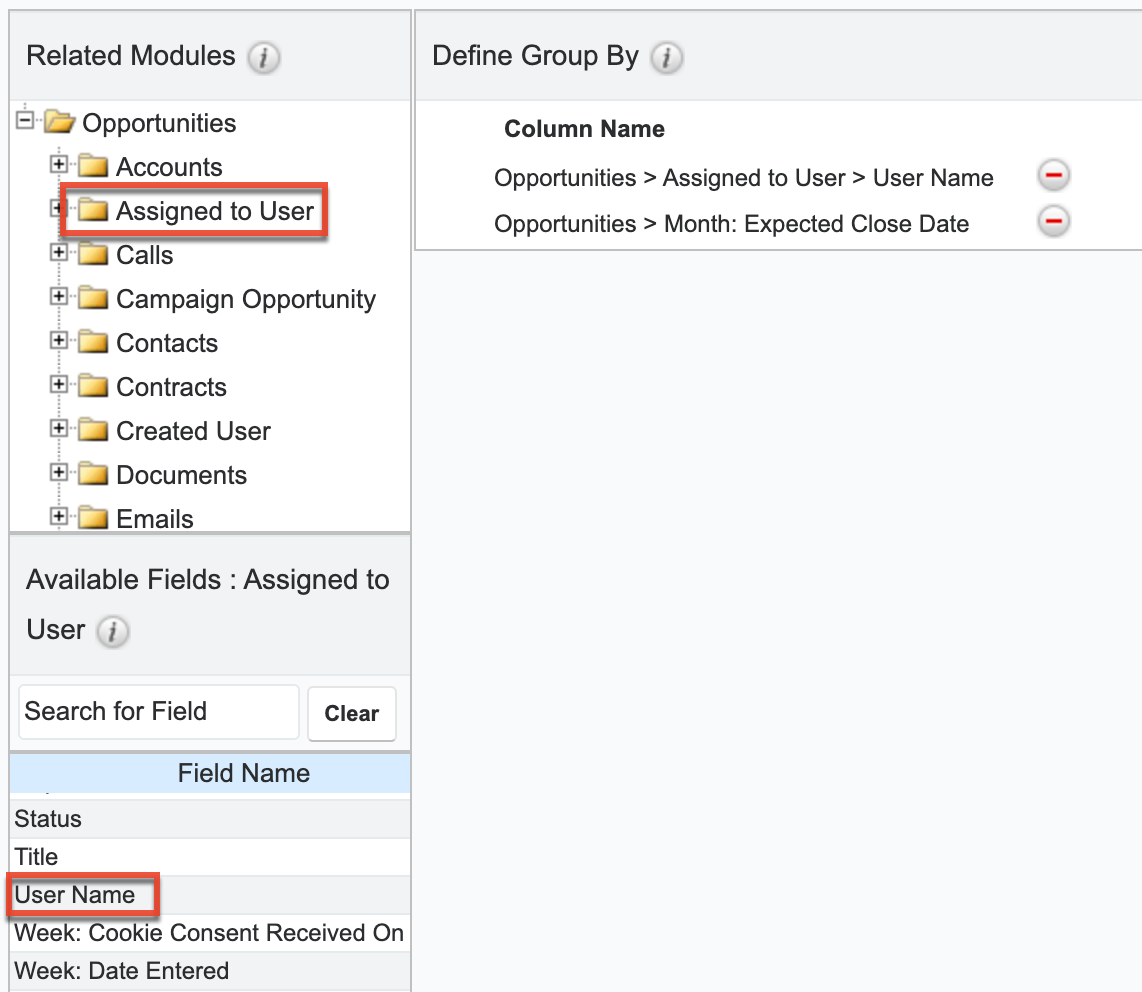
- On the Define Group By step, select "User Name" and "Month: Expected Close Date", which will group the closed won opportunity records by the assigned user and month it was closed. Click "Next".
- On the Choose Display Summaries step, select "SUM: Likely" to summarize the report based on the opportunity's likely total amounts. Click "Next". Please note that the field(s) selected in the Define Group By step are automatically included in the Choose Display Summaries step.
- Note: You can sort results by a specific field column in either ascending or descending order. Simply select the radio button next to the field label (e.g., Month: Expected Close Date) then select "Ascending" or "Descending" in the corresponding dropdown list.
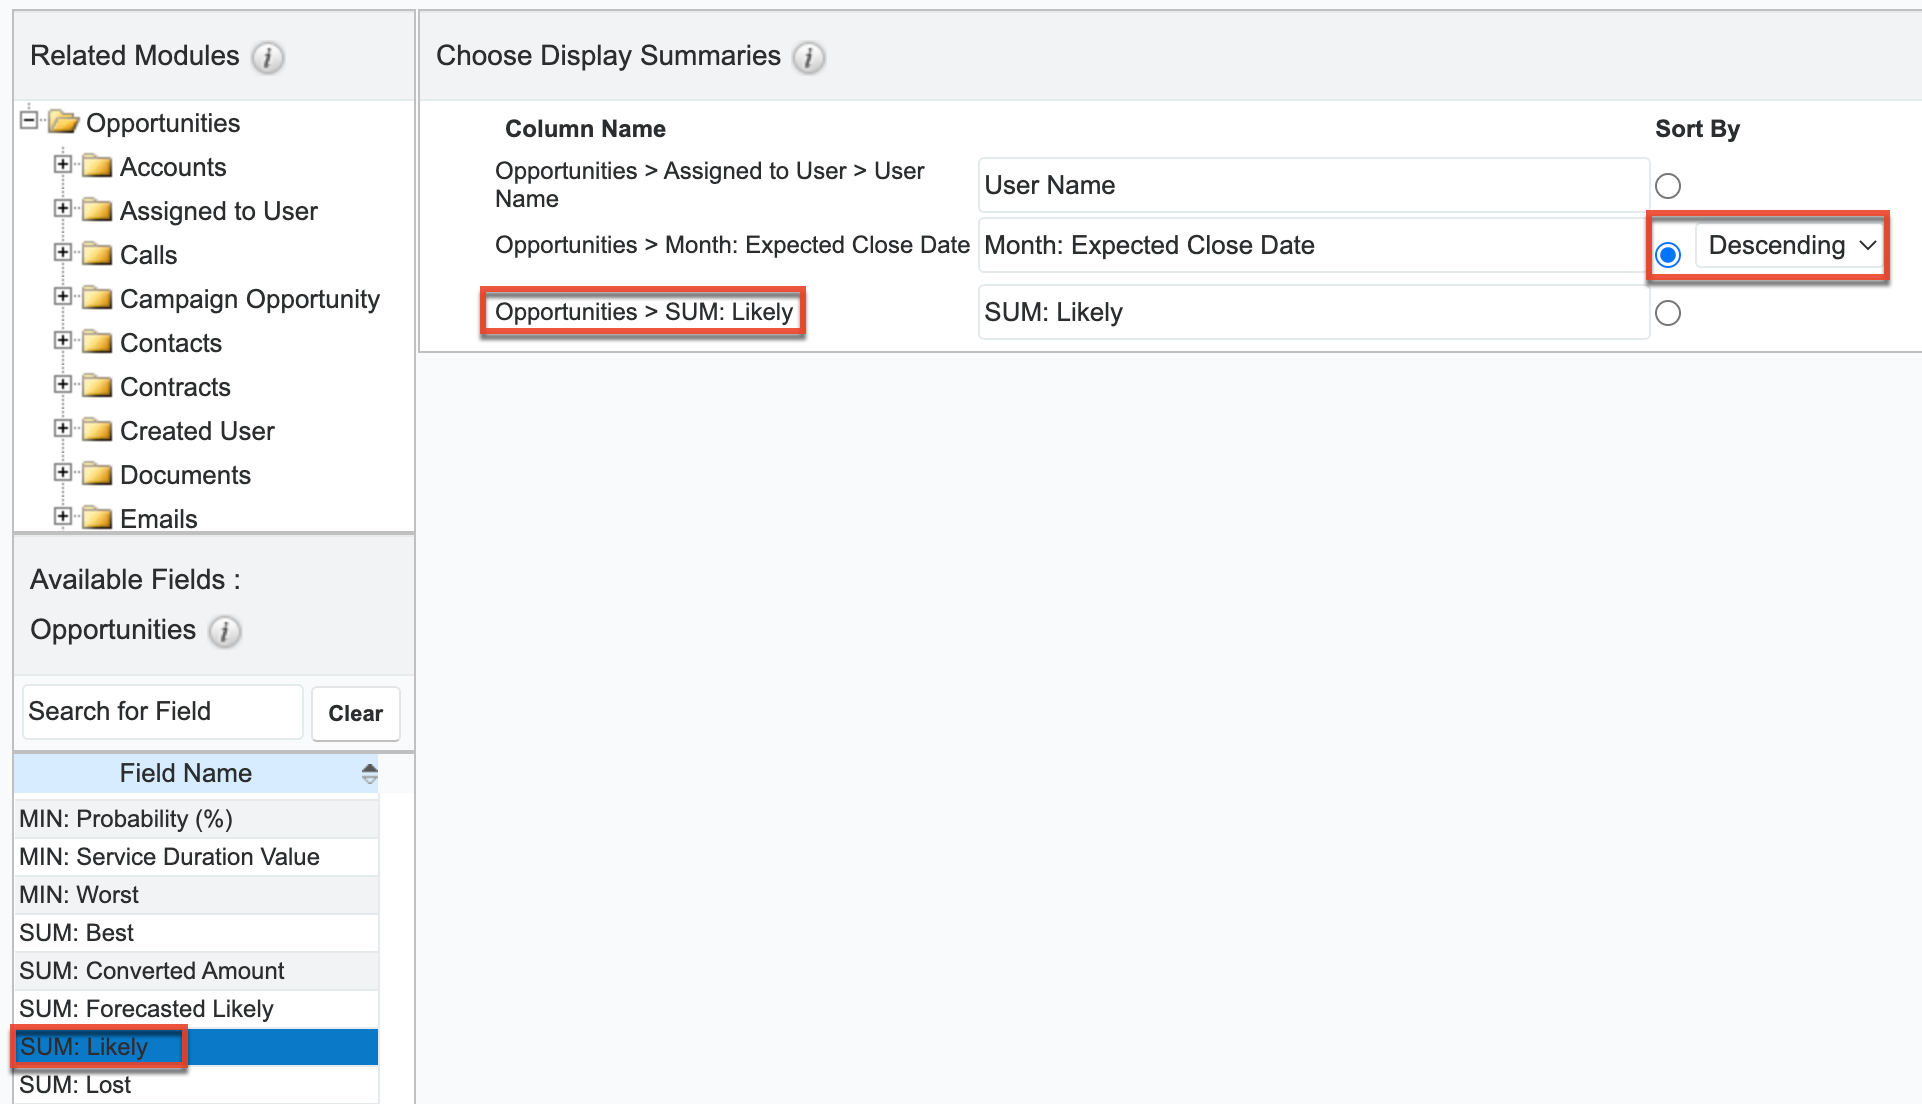
- Note: You can sort results by a specific field column in either ascending or descending order. Simply select the radio button next to the field label (e.g., Month: Expected Close Date) then select "Ascending" or "Descending" in the corresponding dropdown list.
- On the Chart Options step, select the type of chart, if any, that you wish to display in the report as well as how the data should be summarized on the chart (below we use "Vertical Bar (Stacked)"), then click "Next". For more information on setting up the chart options, please refer to the Report Chart Options section.
- On the Report Details step, enter a name for the report and assign it to the appropriate user and team.
- Note: Enable the "Optional Related Modules" box to include all closed won opportunities whether or not they are assigned to a user. For more information regarding this option, please refer to the Optional Related Modules section.
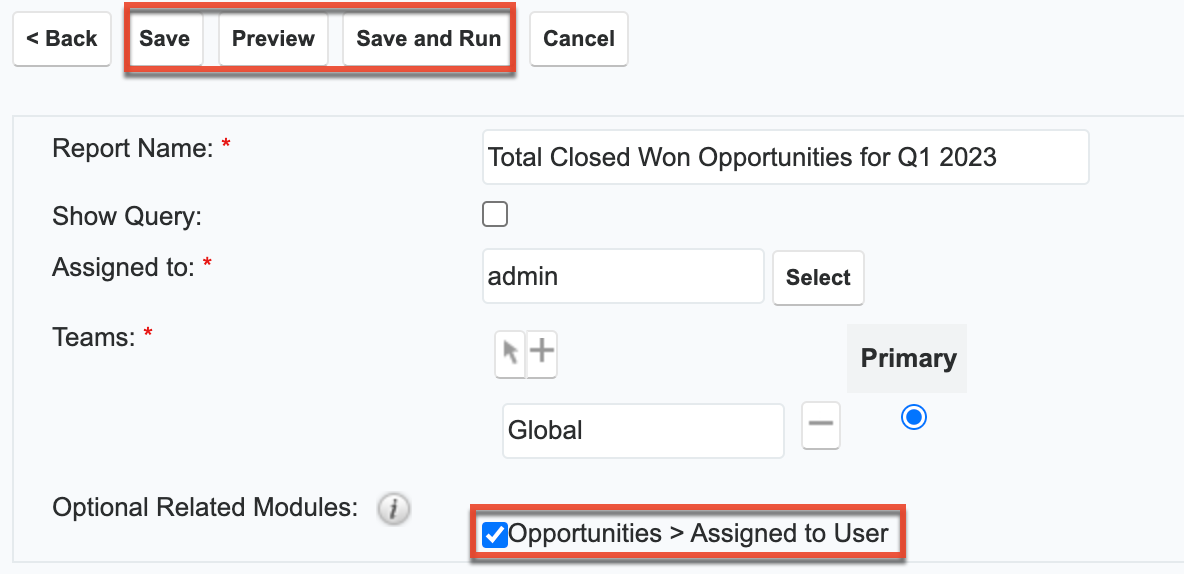
- Note: Enable the "Optional Related Modules" box to include all closed won opportunities whether or not they are assigned to a user. For more information regarding this option, please refer to the Optional Related Modules section.
- After entering the report details, click "Save and Run" to save and generate the report immediately.
- Click the Preview button to preview the report before saving.
- Click the Save button to save the report without running it immediately.
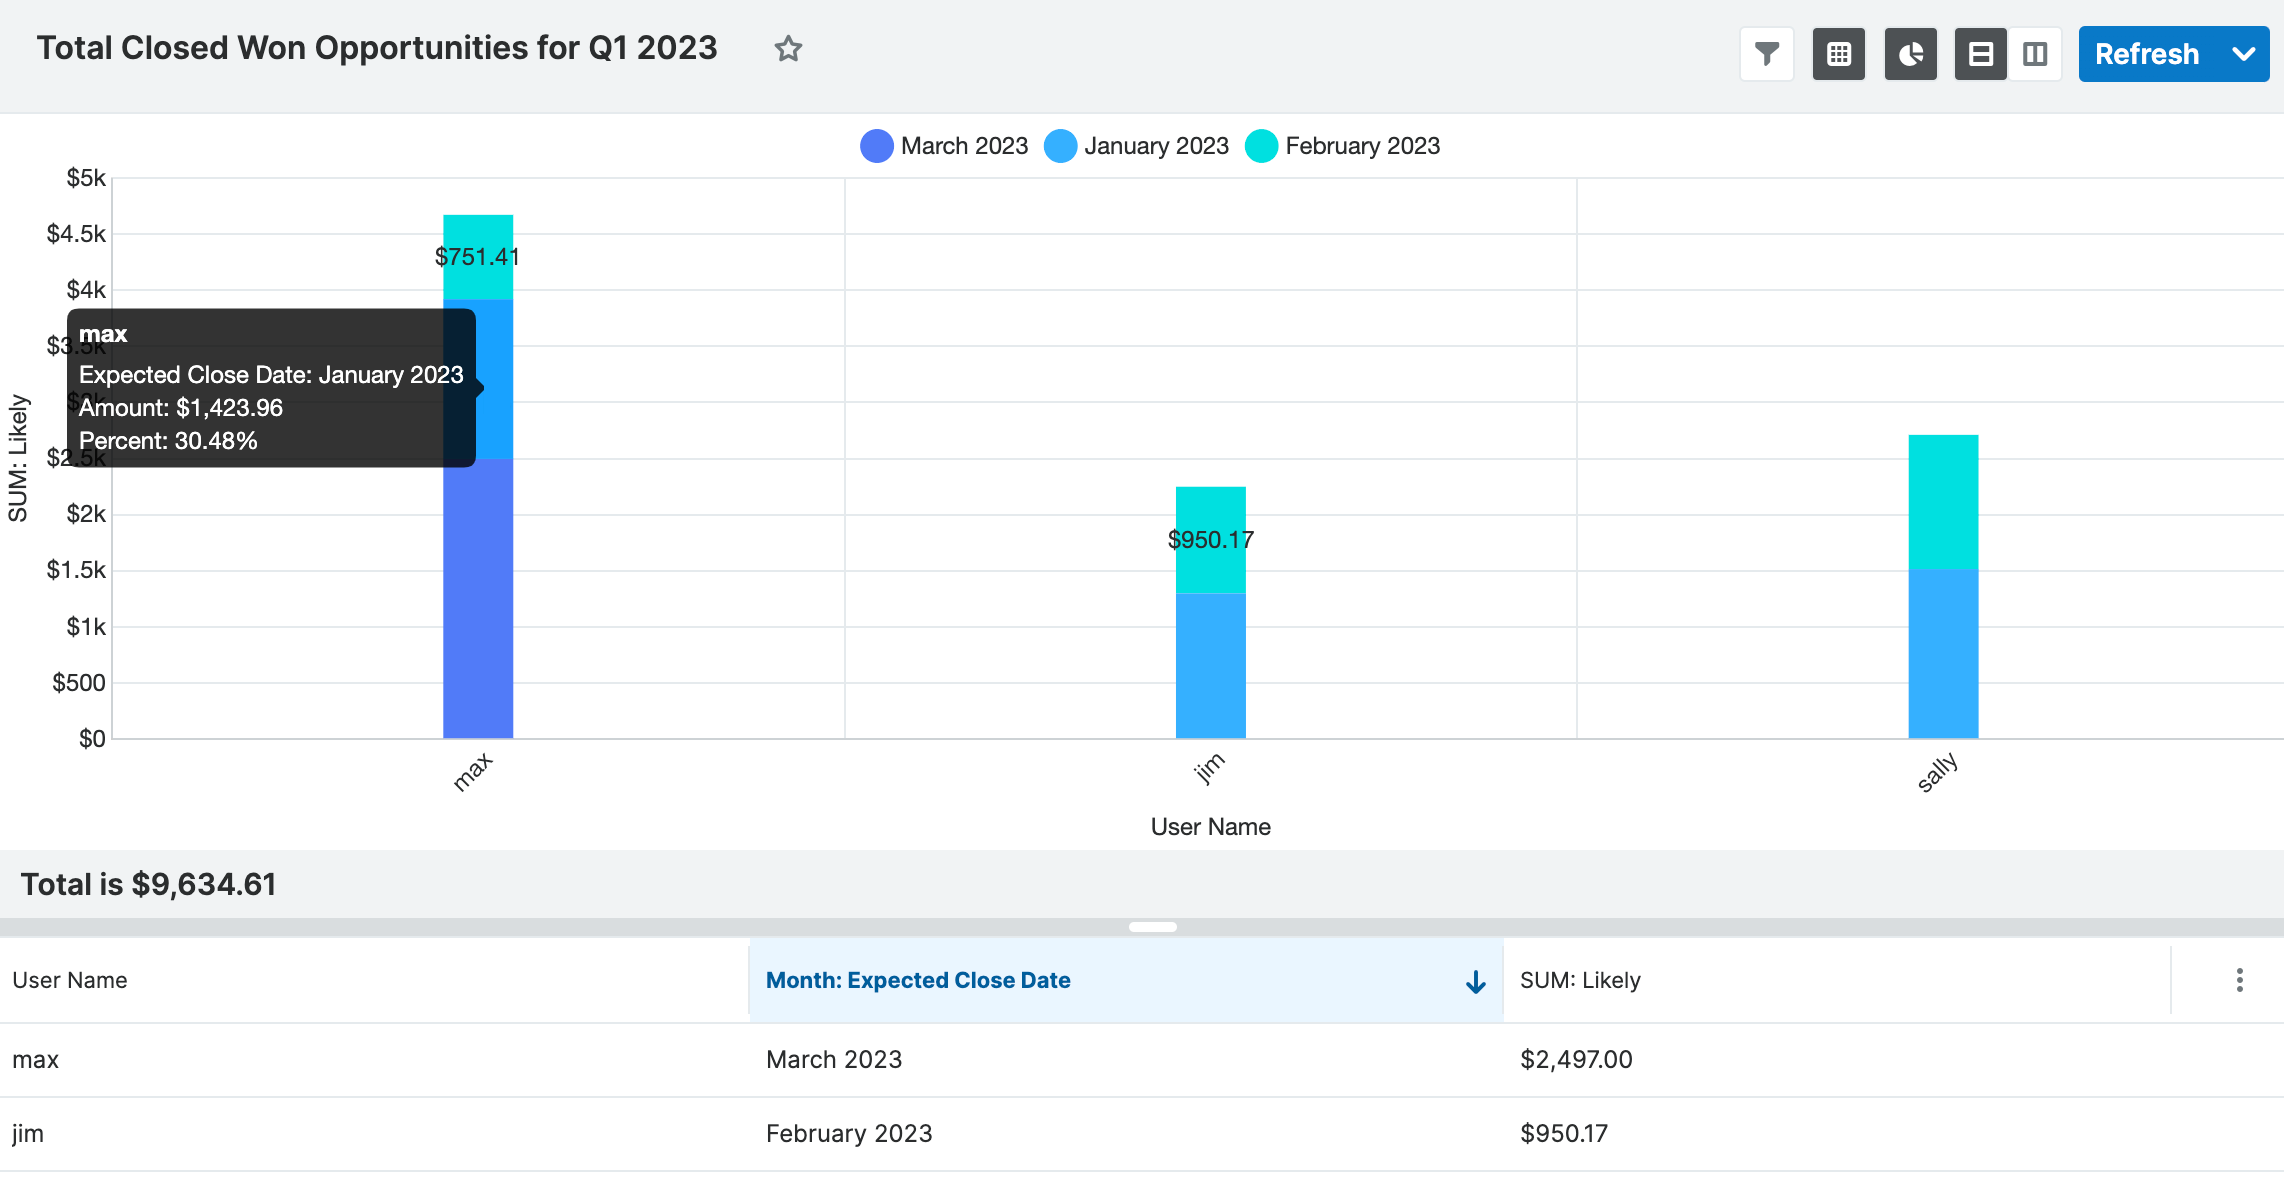
- To view the values corresponding to a section of the chart, hover your mouse over the section.
- To view the list records corresponding to a section of the chart, simply click the bar in the chart. For more information, refer to the Drilling Through Charts section.
Creating a Summation Report with Details
The Summation Report with Details groups and summarizes data with detailed information related to records in the report. You can group the report based on one or more fields from the target or related module. Grouping the report by particular fields allows the report results to display data in categories by the specified field values. You can also drag and drop the group-by fields to a different order in the Define Group By step to change the layout of the report results.
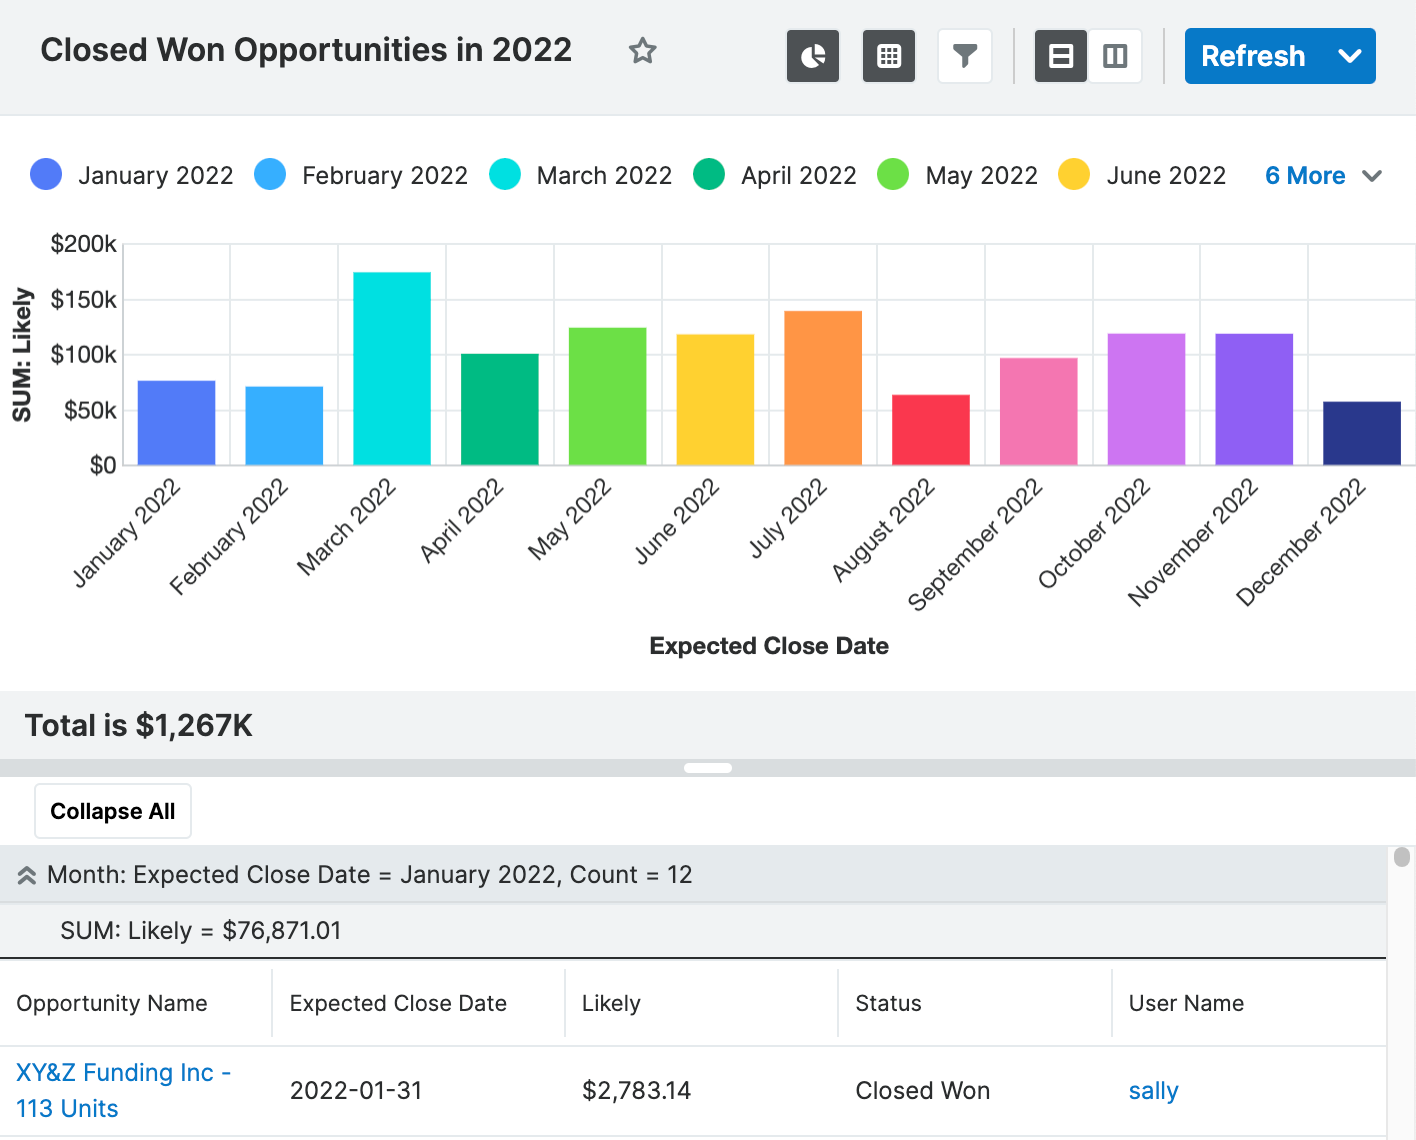
The following steps cover creating a Summation Report with Details to capture closed won opportunities in 2022 grouped by month as an example:
- Follow Steps 1-5 of the Summation Report section and complete the report criteria as follows:
- Report Type: Select "Summation Report with Details"
- Target Module: Choose "Opportunities"
- Define Filters: Define the report filters as follows then click "Next":
- Select "Expected Close Date" from the Available Fields panel, then choose "Is Between" and select "2022-01-01" and "2022-12-31" from the options appearing to the right of the Expected Close Date filter.
- Select "Sales Stage" from the Available Fields panel, then choose "Is" and "Closed Won" in the dropdowns appearing to the right of the Sales Stage filter.
- Define Group By: Select "Month: Expected Close Date" from the Available Fields panel then click "Next".
- Choose Display Summaries: Select "SUM: Likely" from the Available Fields panel then click "Next".
- Note: The field(s) selected in the Define Group By step are automatically included in the Choose Display Summaries step.
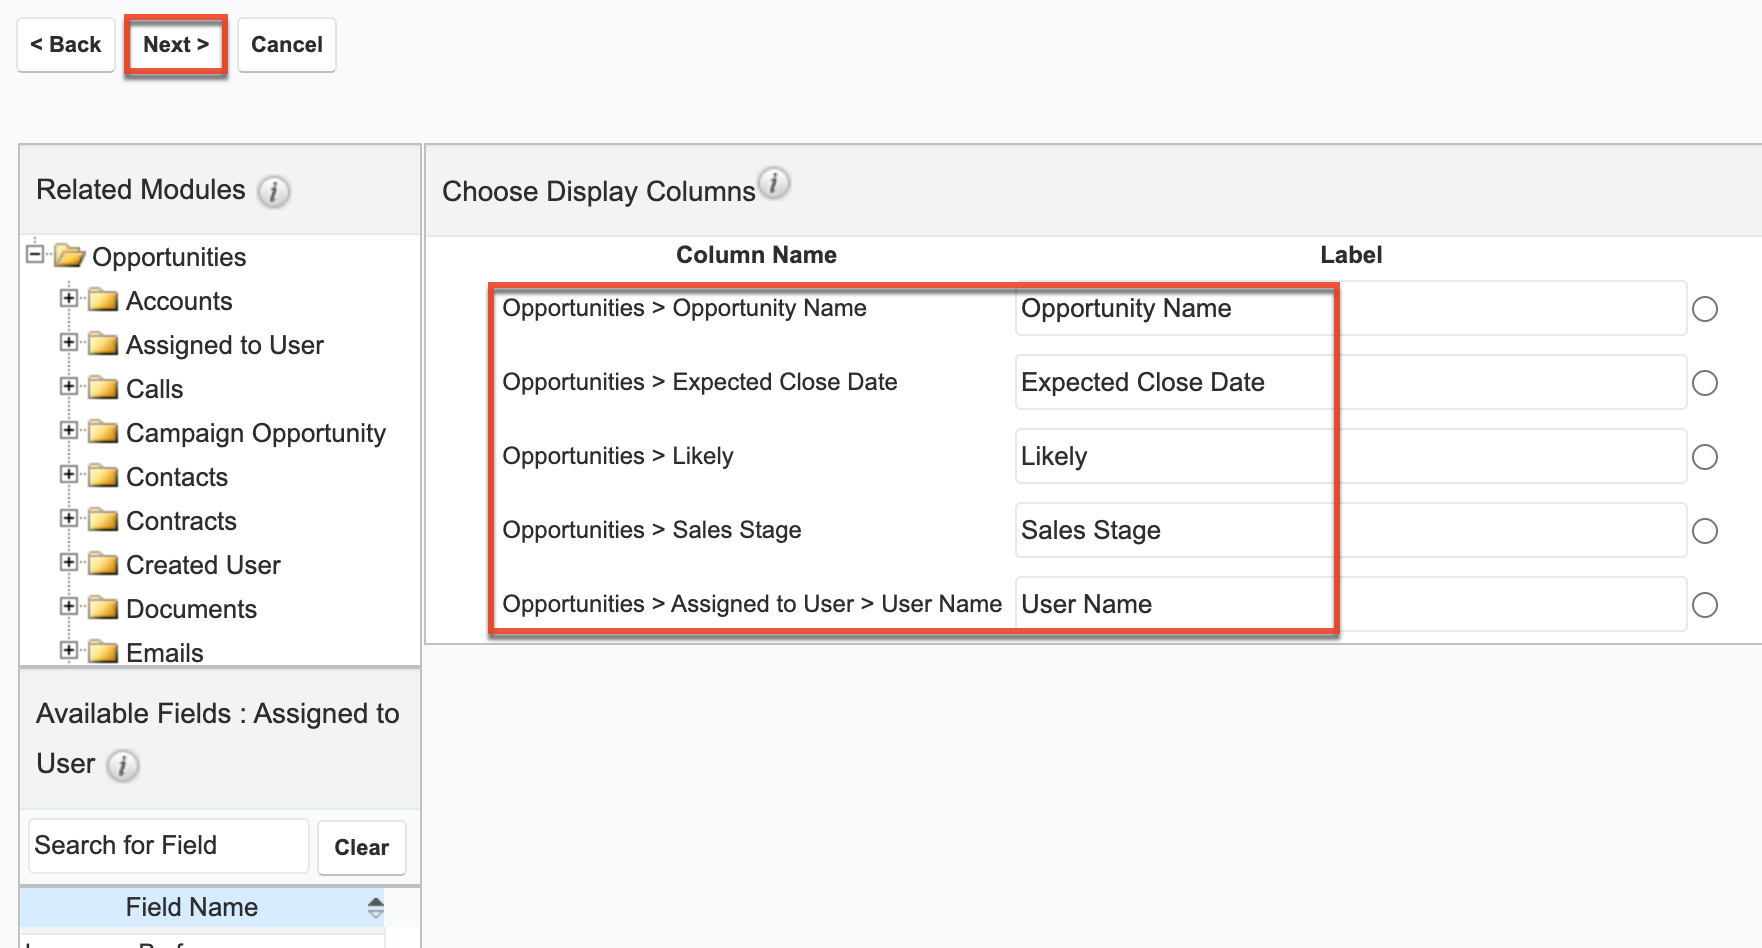
- On the Choose Display Columns step, select the fields (e.g., "Opportunity Name", "Expected Close Date", "Likely", "Sales Stage", and "User Name") you would like included on the report from the Available Fields panel then click "Next".
- Refer to Steps 5-10 of the Rows and Columns Report section for instructions on adding fields as display columns.
- For more information on selecting display column fields, please refer to the Report Display Columns section.
- On the Chart Options step, select the type of chart, if any, that you wish to display in the report as well as how the data should be summarized on the chart (below we use "Vertical Bar (Stacked)") and then click "Next".
- On the Report Details step, enter a name for the report and assign it to the appropriate user and team.
- Note: Select the "Optional Related Modules" box to include all closed won opportunities whether or not they are assigned to a user. For more information regarding this option, please refer to the Optional Related Modules section.
- After entering the report details, click "Save and Run" to save and generate the report immediately.
- Click the Preview button to preview the report before saving.
- Click the Save button to save the report without running it immediately.
- To view the corresponding chart values, simply hover your mouse over the bar in the report chart.
Creating a Matrix Report
The Matrix Report provides an overview of the data and displays the total for display summaries in a grid format. The numeric field values for all display summaries appear on the table along with the total amounts for each row and column. You can choose a maximum of three group-by columns to group the data in the report.
You can also choose specific layout options (e.g., 1x2 and 2x1) on the Report Details step of the Report Wizard if you selected three group-by columns on the Define Group By step. The 1x2 layout option displays the data for the first group-by field in a row and displays the data for the other two group-by fields in columns. The 2x1 layout option displays the data for the first two group-by fields in rows and displays the data for the third group-by field in a column. If you only have two group-by columns, you can manually change the report layout by dragging and dropping the group-by fields to a different order on the Define Group By step. Please note that the Matrix Report does not provide detailed information like Summation Report with Details and will not include display columns in the report.
The following steps cover creating a Matrix Report to capture closed won opportunities in 2022 grouped by assigned user and the month it was closed as an example:
- Follow Steps 1-5 of the Summation Report section and complete the report criteria as follows:
- Report Type: Select "Matrix Report"
- Target Module: Choose "Opportunities"
- Define Filters: Define the report filters as follows then click "Next":
- Select "Expected Close Date" from the Available Fields panel, then choose "Is Between" and select "2022-01-01" and "2022-12-31" from the options appearing to the right of the Expected Close Date filter.
- Select "Sales Stage" from the Available Fields panel, then choose "Is" and "Closed Won" in the dropdowns appearing to the right of the Sales Stage filter.
- Define Group By: Select "Month: Expected Close Date" and "User Name" from the Available Fields panel then click "Next"
Note: You must click the related Assigned to User module to select the User Name field as user names are not direct fields of the Opportunities module. - Choose Display Summaries: Select "SUM: Likely" from the Available Fields panel then click "Next"
Note: The field(s) selected in the Define Group By step are automatically included in the Choose Display Summaries step.
- On the Chart Options step, select the chart type that you wish to display in the report as well as how the data should be summarized on the chart (below we use "Horizontal Bar (Stacked)"), then click "Next". For more information on setting up the chart options, please refer to the Report Chart Options section.
- On the Report Details step, enter a name for the report and assign it to the appropriate user and team.
- Mark the "Optional Related Modules" box to include all closed won opportunities whether or not they are assigned to a user. For more information regarding this option, please refer to the Optional Related Modules section.
- Note: The Layout Options dropdown list (1x2 and 2x1) will appear if you selected three group-by columns on the Define Group By step. Select the appropriate layout depending on how you want the data to be displayed on the report grid.
- After entering the report details, click "Save and Run" to save and generate the report immediately.
- Click the Preview button to preview the report before saving.
- Click the Save button to save the report without running it immediately.
When viewing the report's chart, hover your mouse over the bar in the report chart to see the corresponding chart values.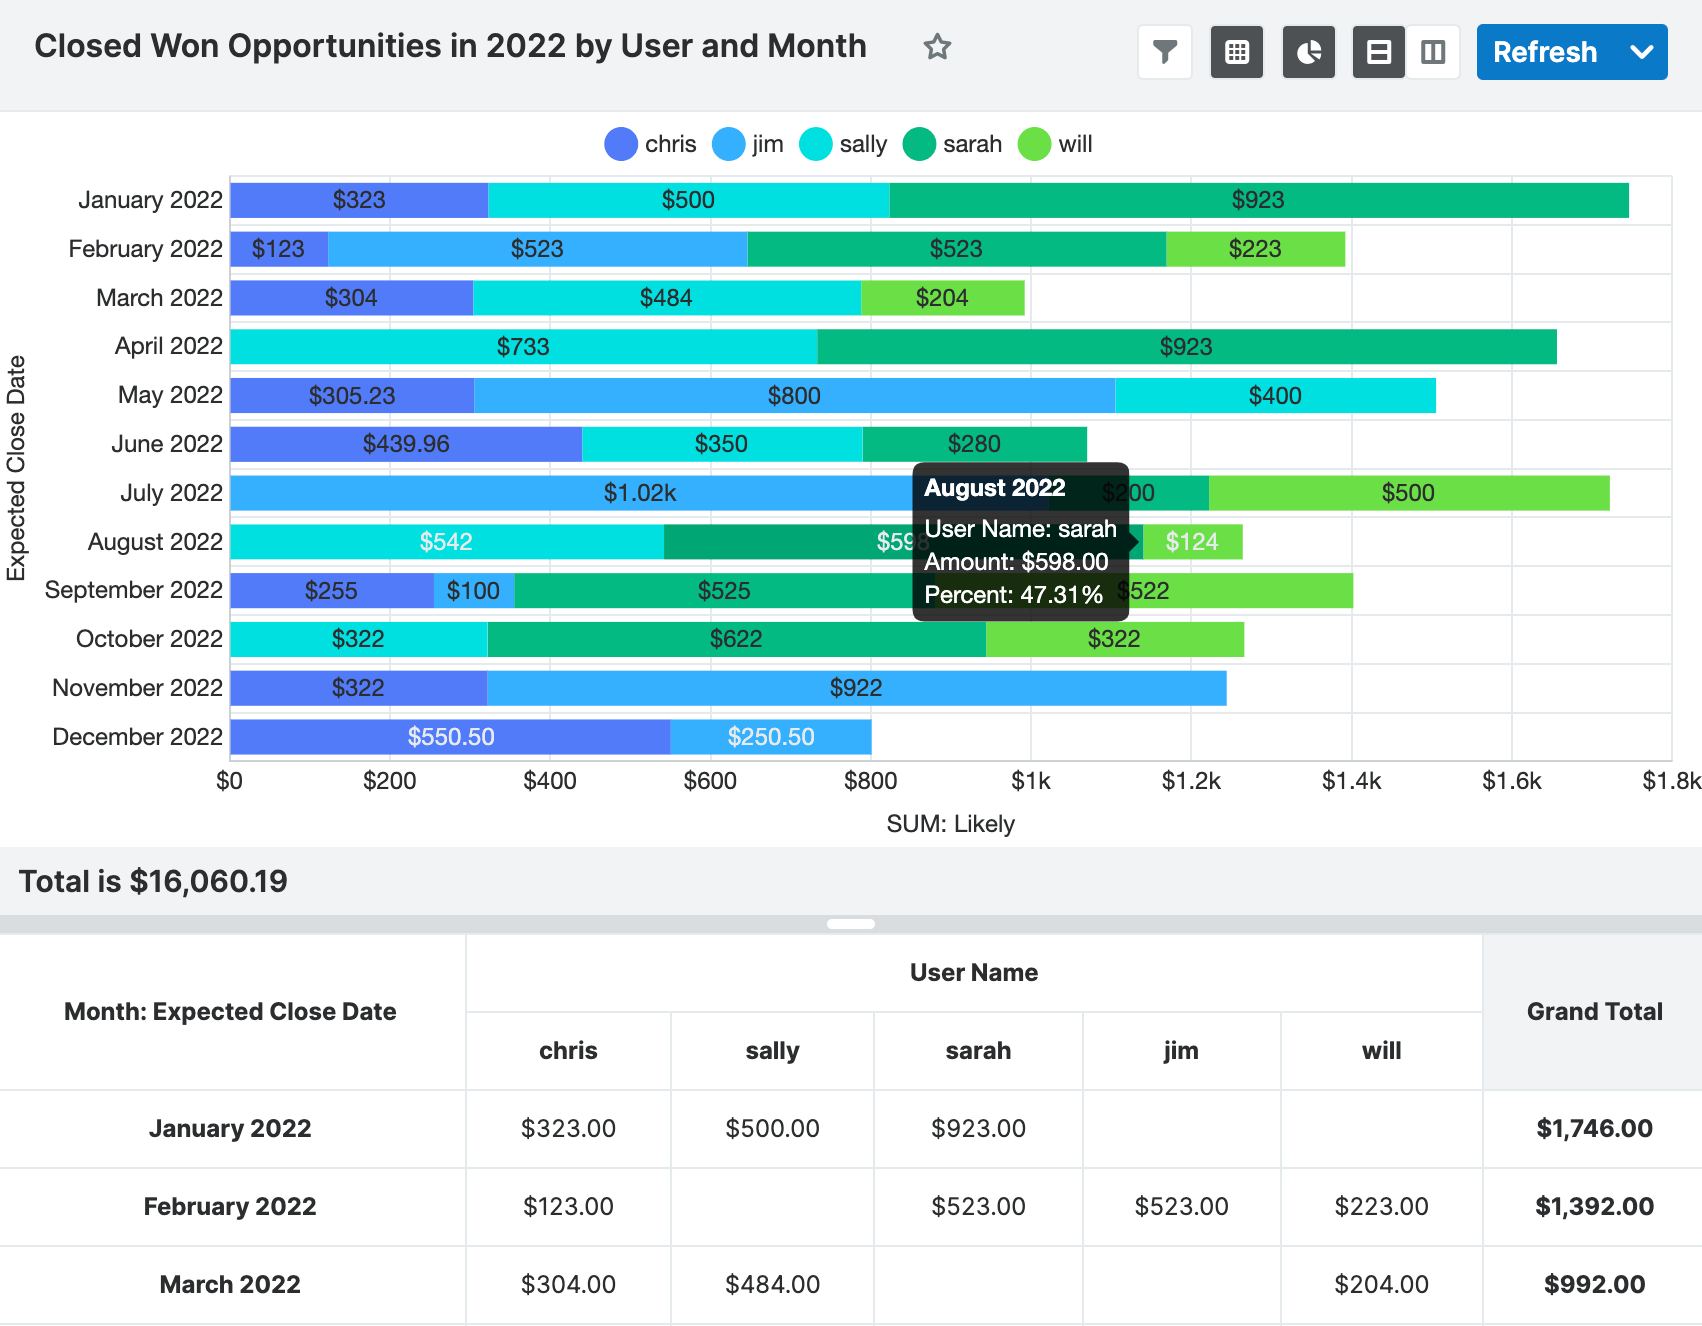
Creating Reports via Duplication
You can also create a new report by duplicating an existing report in Sugar. The Duplicate option is useful if the report you are creating has similar information to an existing report. You can also duplicate a report if you would like to view the same or similar data as a different report type. This option is presented when you select "Duplicate" from the report's Actions menu.
Note: If any report schedule records have been created and related to the original report, they will not copy over to the new report. For more information on creating report schedule records, please refer to the Scheduling Reports section.
The following steps cover creating a report by duplicating an existing Rows and Columns-type report as an example:
- Navigate to a report's results view.
- Click the Actions menu and select "Duplicate".
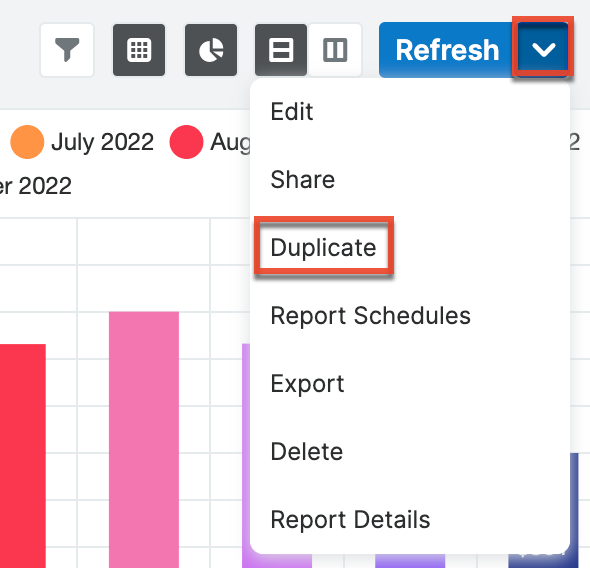
- Choose the report type you would like to create from the Duplicate-As submenu. To keep the new report's type the same, choose the option that includes the "Current Report Type" text in blue.
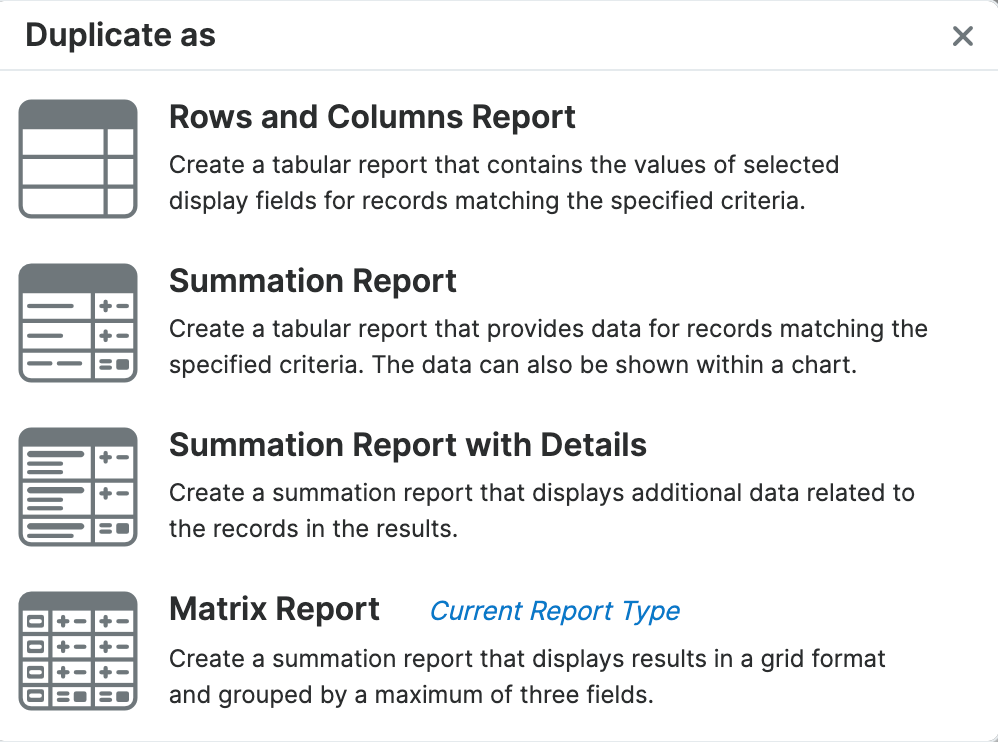
- Go through the Report Wizard to select and enter new data as described in the sections under Report Options. If you selected a report type other than the original type, there may be additional or fewer steps in the Report Wizard to complete and you may need to edit the report to meet the new report type's requirements.
- In the final step, enter a new name for the report and click "Save and Run".
Report Options
There are various steps involved when creating reports in Sugar and the steps can vary slightly depending on the report type (e.g., Summation report versus Rows and Columns). The following sections provide details concerning the steps involved when creating reports.
Report Filters
The Define Filters step of the Report Wizard determines which records the report includes or filters out. Filter groups and operators allow for additional levels of complexity as you combine filters to get the precise result set you desire.
Target Module Filters
By default, the fields for the Target Module you are creating the report on will be displayed in the Available Fields list. To filter on the field related to the target module, select it from the Available Fields list on the bottom left, and it will be added to the list of filters. Please note that only fields marked as "Reportable" in Studio will display in the Available Fields list. For more information on marking fields as reportable, please refer to the Studio documentation in the Administration Guide.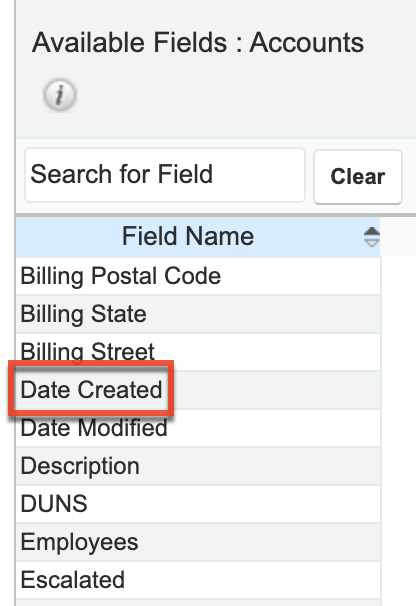
You can also use the search feature above the Available Fields list to easily locate a field. Enter the appropriate keyword (e.g., billing, date) in the search field and the matching results will display in the Available Fields list. Sugar automatically appends the wildcard character (%) to the beginning and end of your search phrase, so the system will return all fields that contain the keyword.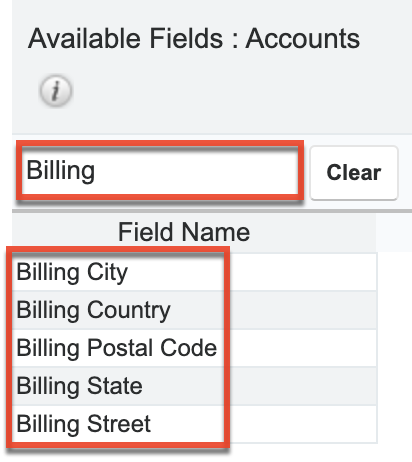
Related Module Filters
The Related Modules list shows all modules that have a relationship with the target module. To filter on a field in a related module, choose the name of the module (e.g., Documents) in the Related Modules list, and the Available Fields list below will display fields belonging to the related module. You can select the desired field(s) from the related module to add as a filter for your report. Please note that only fields marked as "Reportable" in Studio will display in the Available Fields list. For more information on marking fields as reportable, please refer to the Studio documentation in the Administration Guide. 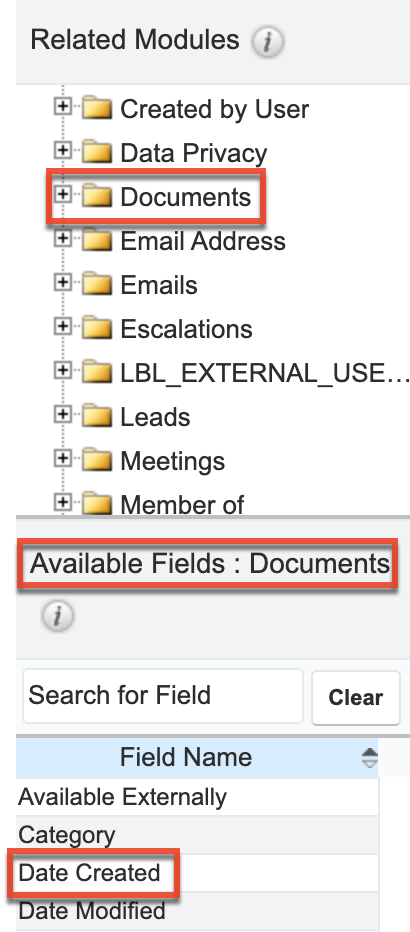
You can also use the search feature above the Available Fields list to easily locate a field. Enter the appropriate keyword (e.g., billing, date) in the search field and the matching results will display in the Available Fields list. Sugar automatically appends the wildcard character (%) to the beginning and end of your search phrase, so the system will return all fields that contain the keyword.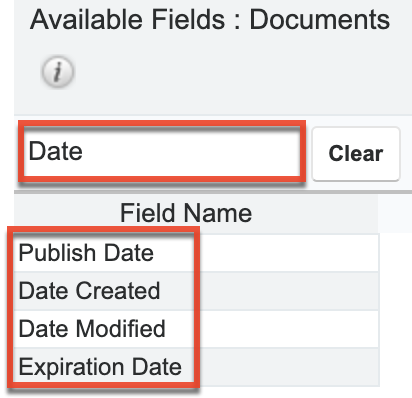
Filter Values
Once the filter has been created, you can specify what field values constitute a match for the report in the Define Filters section. Select the appropriate value from the corresponding dropdown list and enter the relevant value in the open text box (if applicable).
The Is Anything option in the operand dropdown includes all records, whether the field is empty or not. This means that it essentially does not filter on that field. When used as a run-time filter, it provides an efficient way to toggle between filtering on a field and ignoring the field in the filter set.
Run-Time Filters
The run-time option in the Define Filters step allows you to make the filter(s) available on the report results view, which enables you to quickly change your filter values without having to edit the report. Simply mark the Run-time box for any filter(s) you wish to view on the saved report. 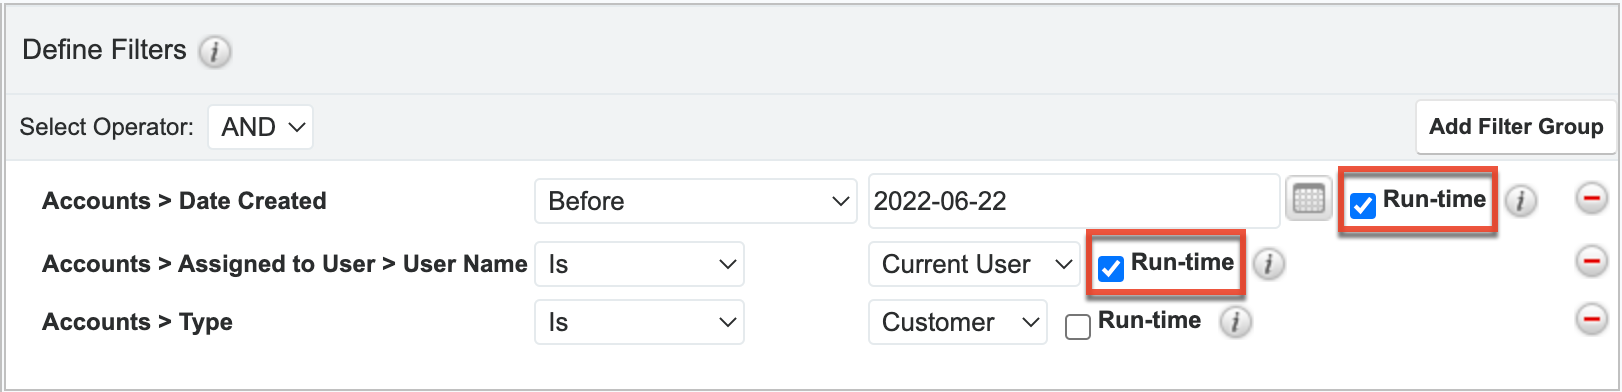
Once the report is created and saved, the run-time filter (e.g., "Accounts > Date Created") will appear on the generated results view in the Filters panel. You can change the filter values directly from the results view by selecting the new filter values in the Filter panel and then clicking "Apply" or "Refresh" at the top of the report's results view.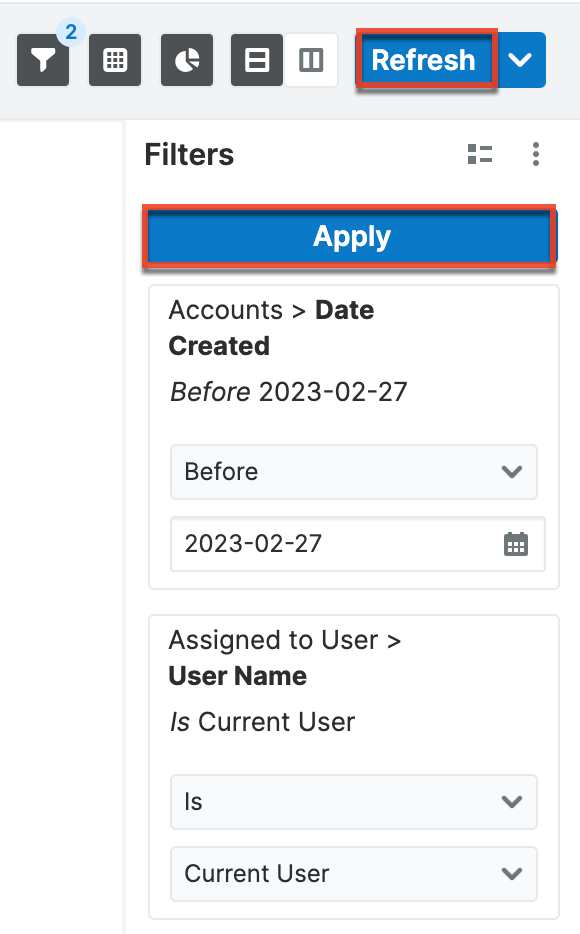
Please note that the Report Wizard retains the original filter value(s) you set when building the report regardless of the changes you or other users make on the run-time filters on the report's results view. If the report is shared by a team, then each user can run the report with different run-time filter values to meet their individual needs. The run-time filter values set by each user will be preserved for future viewing until they change or reset the value.
Operators
When building the report, you have the option to choose between two operators, "AND" and "OR", using dropdowns within the Define Filters section. By default, operators are set to "AND" which will cause the filters to work cumulatively. All filters or groups of filters under an AND operator will need to be true for a record in order for that record to appear in the report result. Changing an operator to "OR" will mean that if any single filter under that "OR" is true for a record, the record will be included in the report results. The OR operator accepts records matching any of the filters while the AND operator accepts records matching all filters.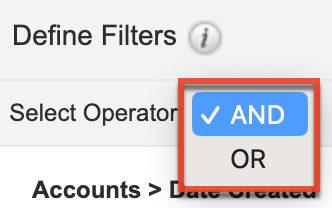
Filter Groups
By default, all filters will be added to a single group. To split filters into multiple groups, use the Add Filter Group button.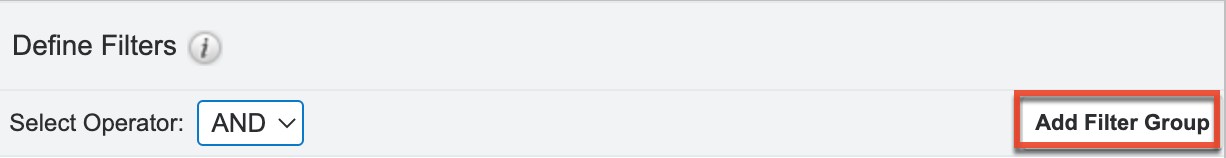
When you have more than one filter group and click a new filter field, Sugar will prompt you to choose the filter group for the filter.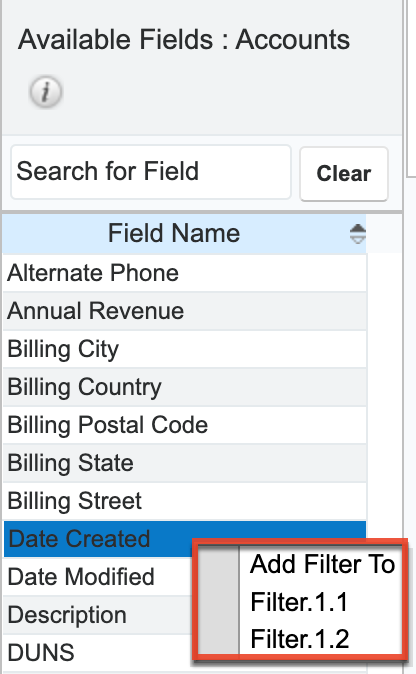
Filter groups and operators can be combined to achieve complex filtering situations. For example, if you need a report for documents belonging to accounts that were created prior to the first quarter where the document is either new this week or new this month and connected to a lead, we would use the following filter groups with an OR operator joining the two together: 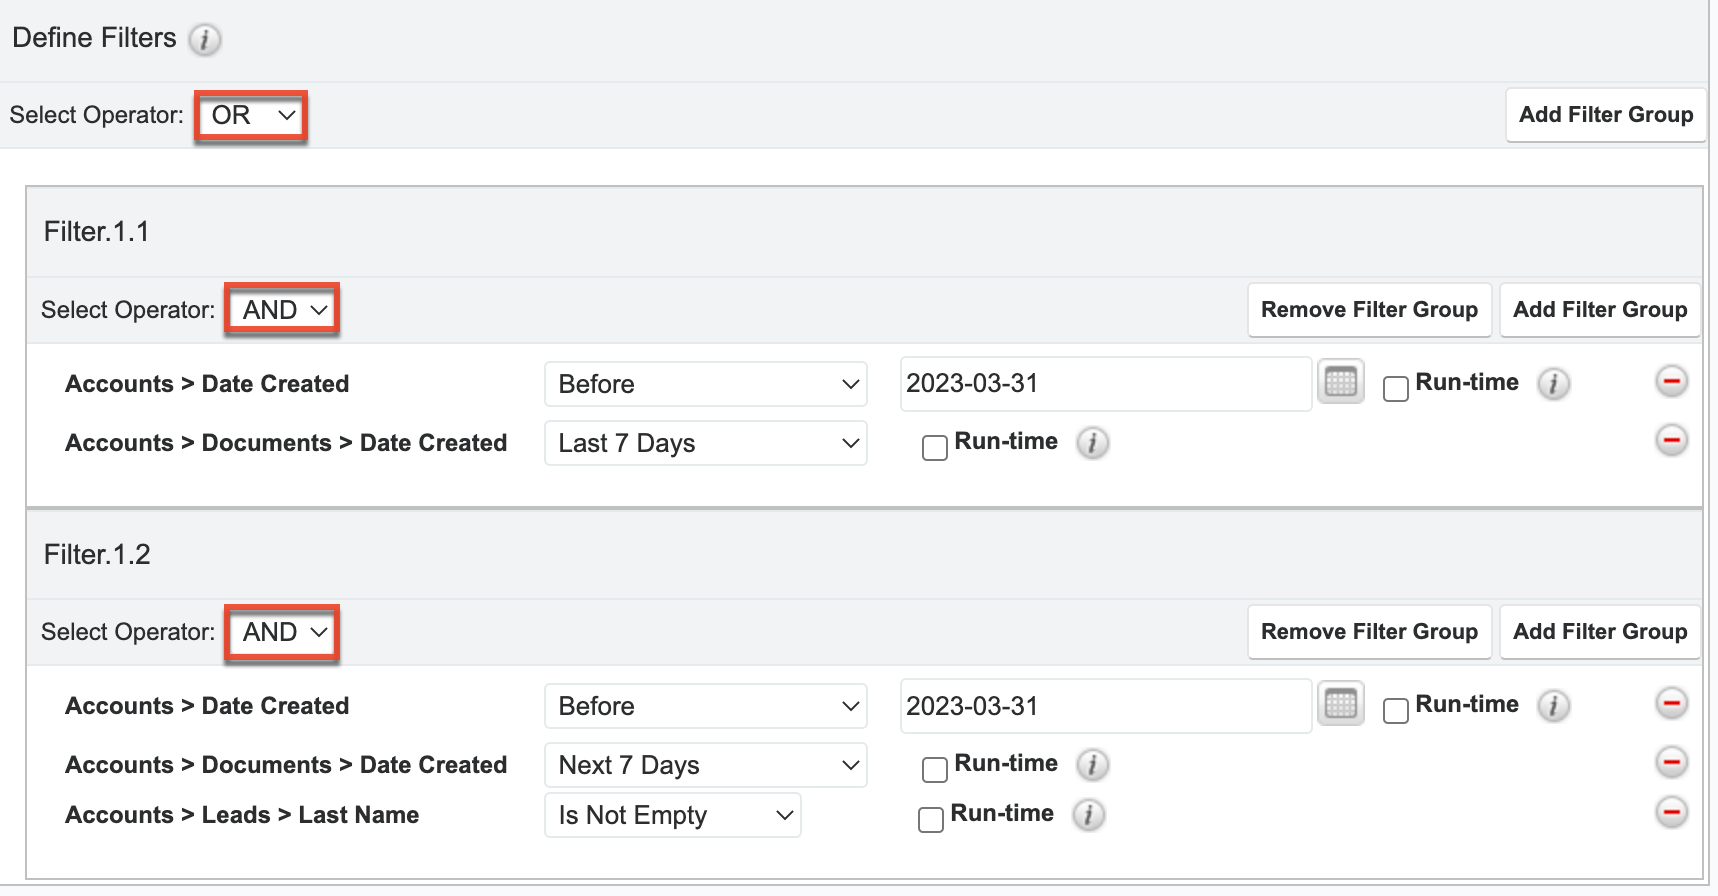
Filters on Tag Fields
If a report's target module contains the Tags field, the report can be filtered by tags via the Related Modules filters. To filter by tags, click on the Tags module name in the Related Modules list. The Available Fields list below will display fields belonging to the Tags module. Select the Name field to create a tag filter. Please note that you can select any field(s) from the Tags module as a filter for your report, but this example will only demonstrate filtering by the tag's name. 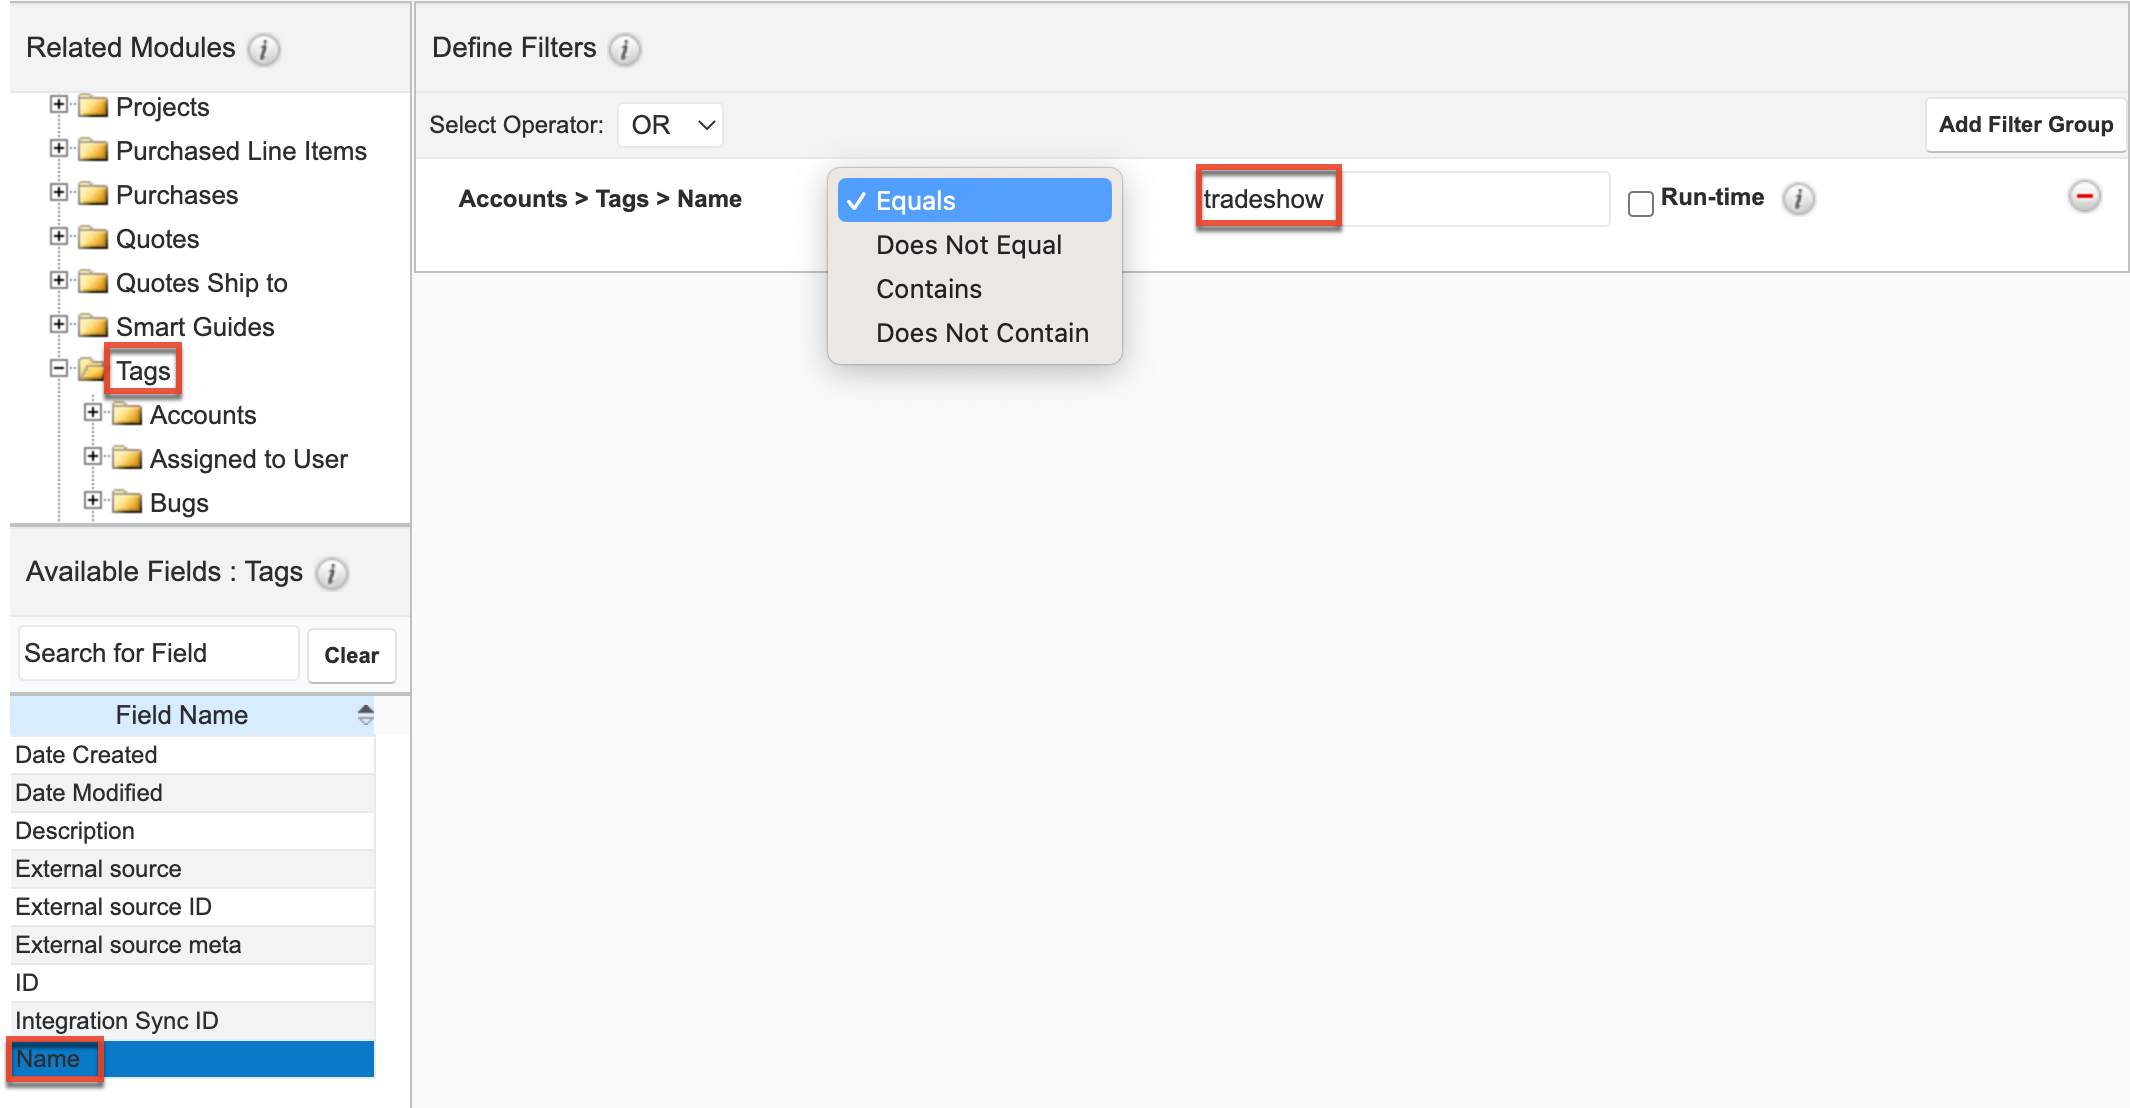
After clicking on the Name field, a line item will appear in the Filters view that allows you to select an operator and specify a tag name in its adjacent text field. This text field is not a type-ahead style like the Tags field is in the Sidecar modules and can only contain a single tag phrase (e.g., tradeshow, hot lead). While the field is case-insensitive, you must know the precise spelling of the tag name that you wish to use as a filter.
To filter a report by more than one tag, click on the Name field again for each additional tag. This will produce additional filter rows where you can specify the appropriate operator and its corresponding tag. In the following example, the report will display a list of account records that are tagged with any one or more of the three specified tags (manufacturing, laser, or hot prospect). 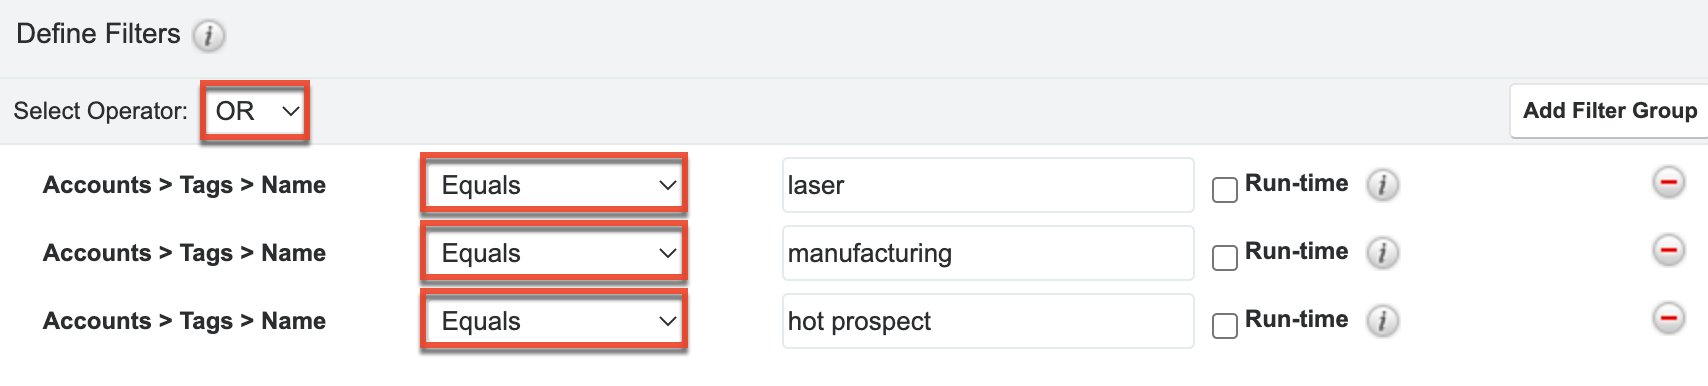
When the Tags field is used as a related-module display column in a Rows and Columns report or Summation Report with Details, the Tags column will display a separate line item for each tag that a record contains. For example, an account tagged as both "manufacturing" and "laser" will be displayed twice in an Accounts report if the report displays the Tags column. Also, note that the Tag column will only display a single tag even if the record contains multiple tags. This will be the tag that matches the filter criteria.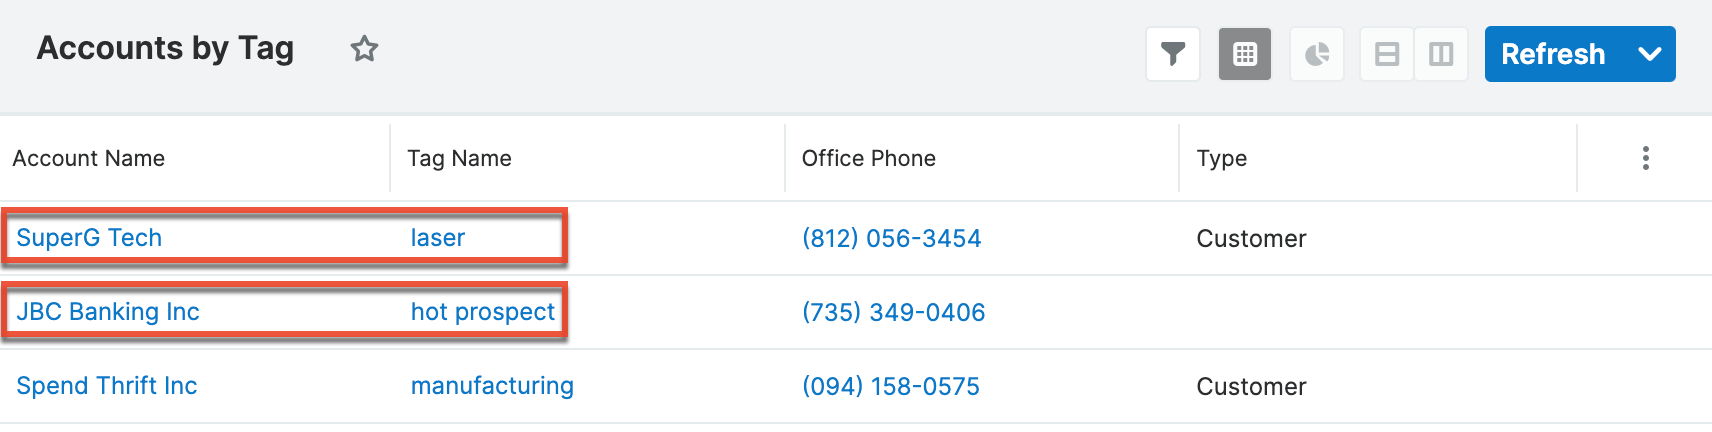
Please note that clicking on a hyperlinked tag name from report results will take you to the tag's record view. For more information on tags in Sugar, please refer to the Tags documentation.
Filters on Date and Datetime Fields
When creating reports in Sugar, specifying a range of time is a useful way to isolate your desired results. Sugar provides a set of pre-defined options to help you easily target the most common date ranges:
| Date Range Filter | Definition |
| On | A specific day. |
| Before | Any value before the specified date. |
| After | Any value after the specified date. |
| Is Between | Any values after a specified start date but before a specified end date. |
| Not On | Any values except the specified date. |
| Is Empty | No date set for the field. |
| Is Not Empty | Any date set for the field. |
| Yesterday | A value set to the prior day. |
| Today | A value set to the current day. |
| Tomorrow | A value set to the following day. |
| Last # Days | Any values within the last X days including the current day. |
| Next # Days | Any values within the next X days including the current day. |
| Last 7 Days | Any values within the last 7 days including the current day (e.g., Running on Monday includes the previous Tuesday morning through the end of the current Monday). |
| Next 7 Days | Any values within the next 7 days including current day (e.g., Running on Monday includes the current Monday morning through the end the following Sunday). |
| Last Month | Any values that fall within the prior calendar month. |
| This Month | Any values that fall within the current calendar month. |
| Next Month | Any values that fall within the next calendar month. |
| Last 30 Days | Any values within the last 30 calendar days including the current day. |
| Next 30 Days | Any values within the next 30 calendar days including the current day. |
| Last Quarter | Any values within the prior quarter defined by the calendar year (e.g., January - March, April - June). |
| This Quarter | Any values within the current quarter defined by the calendar year (e.g., January - March, April - June). |
| Next Quarter | Any values within the upcoming quarter defined by the calendar year (e.g., January - March, April - June). |
| Last Year | Any values within the prior calendar year. |
| This Year | Any values within the current calendar year. |
| Next Year | Any values within the upcoming calendar year. |
Additionally, if your administrator has configured the Forecasts module via Admin > Forecasts, additional options based on your organization's fiscal year will be available. If your fiscal year follows a traditional calendar year, these options will function in the same way as the corresponding options above:
| Date Range Filter | Definition |
| Previous Fiscal Year | Any values within the prior fiscal year. |
| Previous Fiscal Quarter | Any values within the prior quarter defined by the fiscal year. |
| Current Fiscal Year | Any values within the current fiscal year. |
| Current Fiscal Quarter | Any values within the current quarter defined by the fiscal year. |
| Next Fiscal Year | Any values within the upcoming fiscal year. |
| Next Fiscal Quarter | Any values within the upcoming quarter defined by the fiscal year. |
For more information about configuring the Forecasts module, please refer to the Forecast Configuration documentation in the Administration Guide.
Note: When generating reports with datetime filters, Sugar will always adjust the results to ensure they are accurate according to the time zone settings of the user accessing the report. For instance, a user on Eastern Standard Time (-5 GMT) may see a different set of results for a report than would a user on Pacific Standard Time (-8 GMT) because the date ranges are adjusted for the user's time zone.
Group By Fields
Summation Reports, Summation Reports with Details, and Matrix Reports allow you to group records by one or multiple fields within a module. Select a module in the Related Modules pane to display the fields by which you can group. Note that some module fields may not be displayed since only field types that contain set values can be used for grouping (e.g., text fields cannot be used).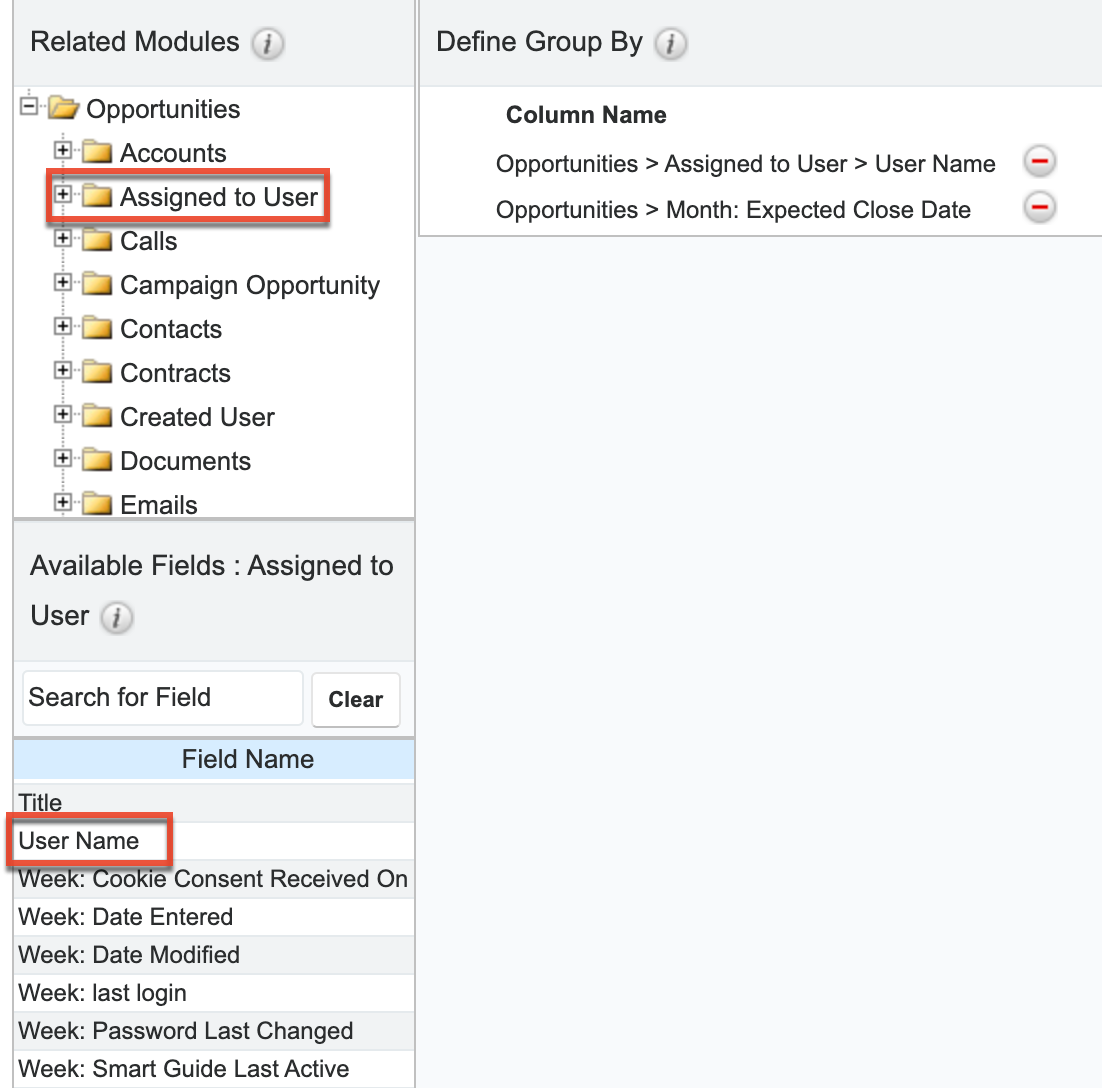
Click field names individually to add them to the Define Group By list, or use the Search field to locate specific fields. There is no limit to the number of fields you can include; however, including too many fields may make the report difficult to read. When there are multiple Group By fields, drag and drop field names to reorder this list. The order of the fields may determine the visualization of the chart, if one is selected. For additional information, refer to the Chart Options section below.
Report Display Columns
The display columns step allows you to select which field(s) you would like included when generating the report. The system will pull data specific to these fields based on the report criteria for the associated module record. When you select a field from the Available Fields list, it will be added to the list and display the path of the field (e.g., Contacts > Assigned to User > User Name). The displayed field paths show you where the field is stored. For example, although "Email Address" appears as a field in several modules (e.g., Accounts, Contacts, Leads), email addresses are actually stored in their own table and are related to the modules where they appear as opposed to being direct fields of those modules. So, the corresponding displayed path will show the primary module record (e.g., Contacts), then the related module (e.g., Email Address) followed by the field name (e.g., Email Address). This combines to have the Column Name read "Contacts > Email Address > Email Address" since the email address field is a field of the related Email Address module.
To remove any unnecessary fields from the display column list, simply click the minus sign to the far right of the displayed field path row.
Changing Display Column Labels
By default, the selected display column fields will display stock labels that can be changed if you desire. To change the label, simply enter the new label name in the open text field then click outside of the text box to preserve the change. 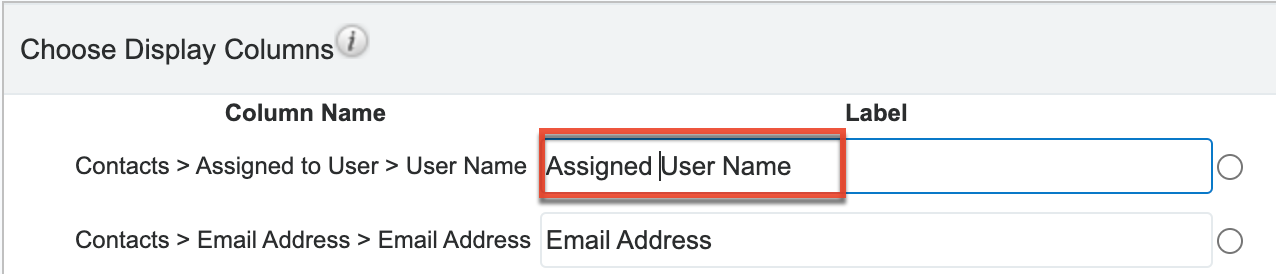
Changing Display Column Order
You can change the left-to-right order of the display columns by dragging and dropping the displayed field paths in the Choose Display Columns section.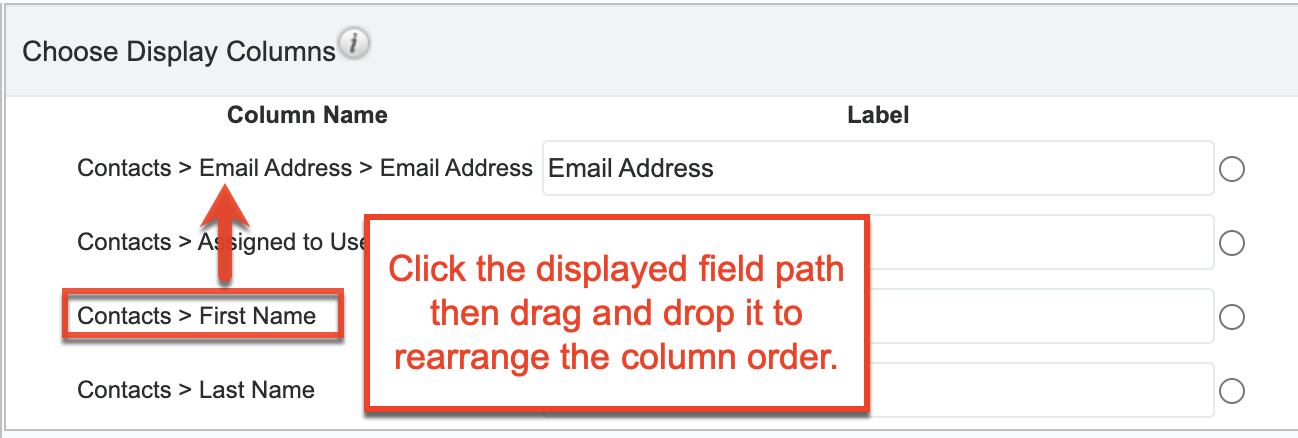
Defining Column Sort
You can also designate the generated report to be sorted by a specific field column in either ascending or descending order. Simply mark the radio button next to the field label then select "Ascending" or "Descending" in the corresponding dropdown list. Please note that only one display column can be designated to sort by default in the report.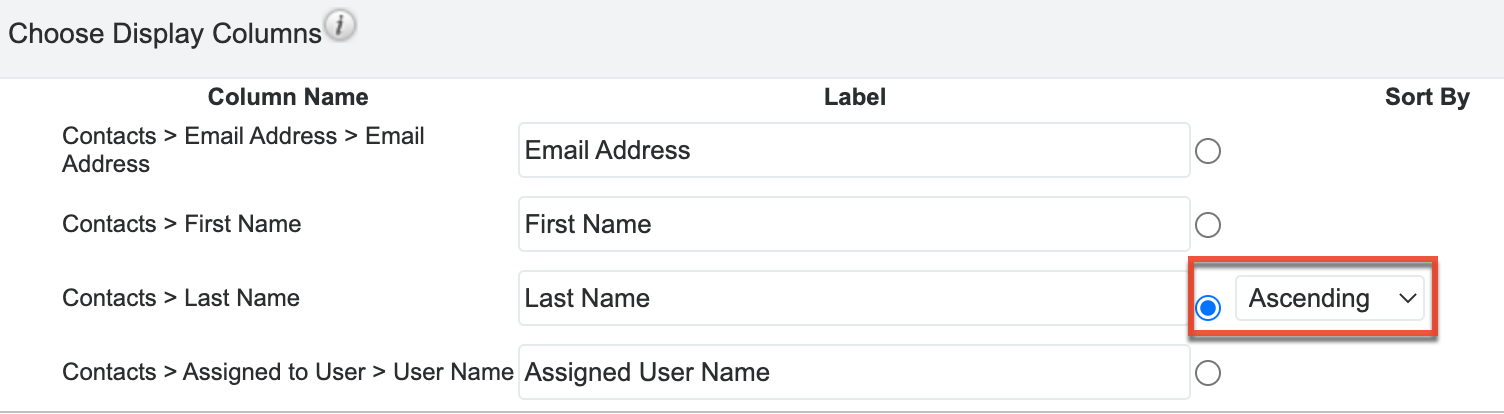
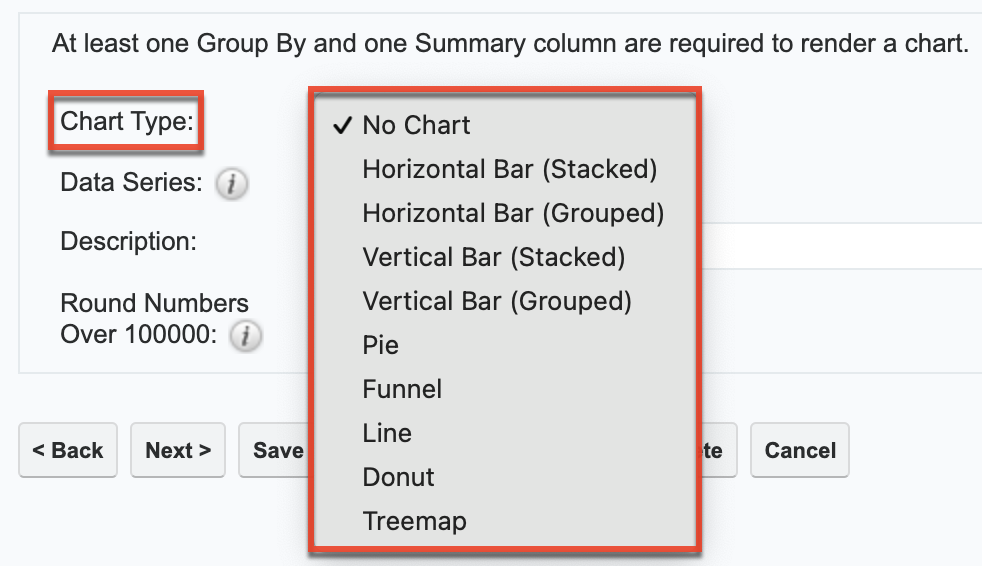
Chart Options
The Chart Options step of the Report Wizard allows users to choose the chart type that they want to be displayed on the generated report as well as how to summarize the data within the chart. Please note that you must select at least one of the calculated fields (e.g., Count, AVG: Amount, SUM: Amount) in the Choose Display Summaries step to select a chart type in the Chart Options step.
The following options are available in the Chart Options step of the Report Wizard:
- Chart Type: Select the type of chart that you want to display on your report. Refer to the Chart Types table below for a description of each.
- Data Series: Select the data that you want to be summarized by the chart. The field(s) you selected in the Choose Display Summaries step will be available to choose in this dropdown list.
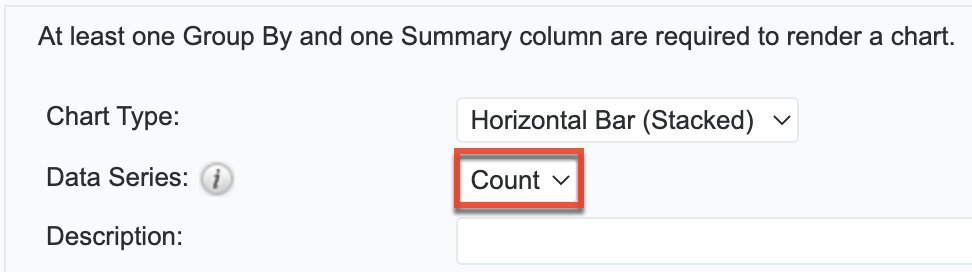
- Description: Enter a brief description to label the chart.
- Round Numbers Over 100000: Enable this option if you want numbers over 100,000 to be rounded to the nearest thousand in the report charts. For example, 150,000 will be displayed as 150K.
Chart Types
The table below provides a description, the Group By field dependencies, and an example for each chart type.
| Chart Type | Description | Group By Field Dependencies | Chart Example |
|
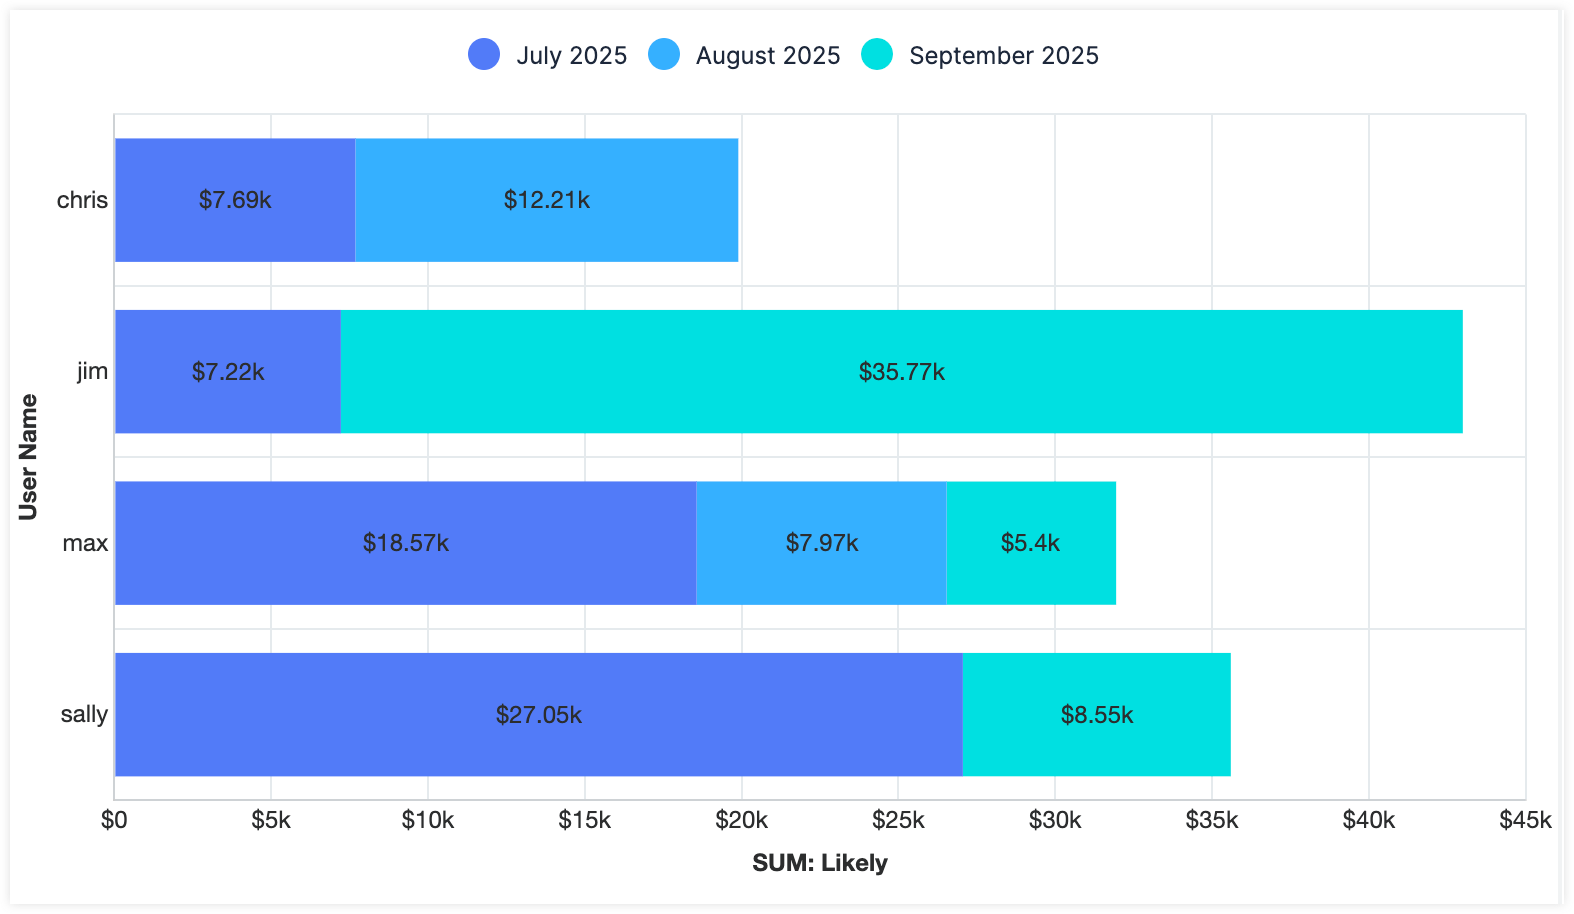
Horizontal Bar (Stacked) |
Categorical data is shown as horizontal bars scaled to their values with subgroups stacked as colored segments. |
|
 |
|
Horizontal Bar (Grouped) |
Categorical data is shown as horizontal bars scaled to their values with subgroups shown as clusters of bars proportionally organized within each primary grouping. | 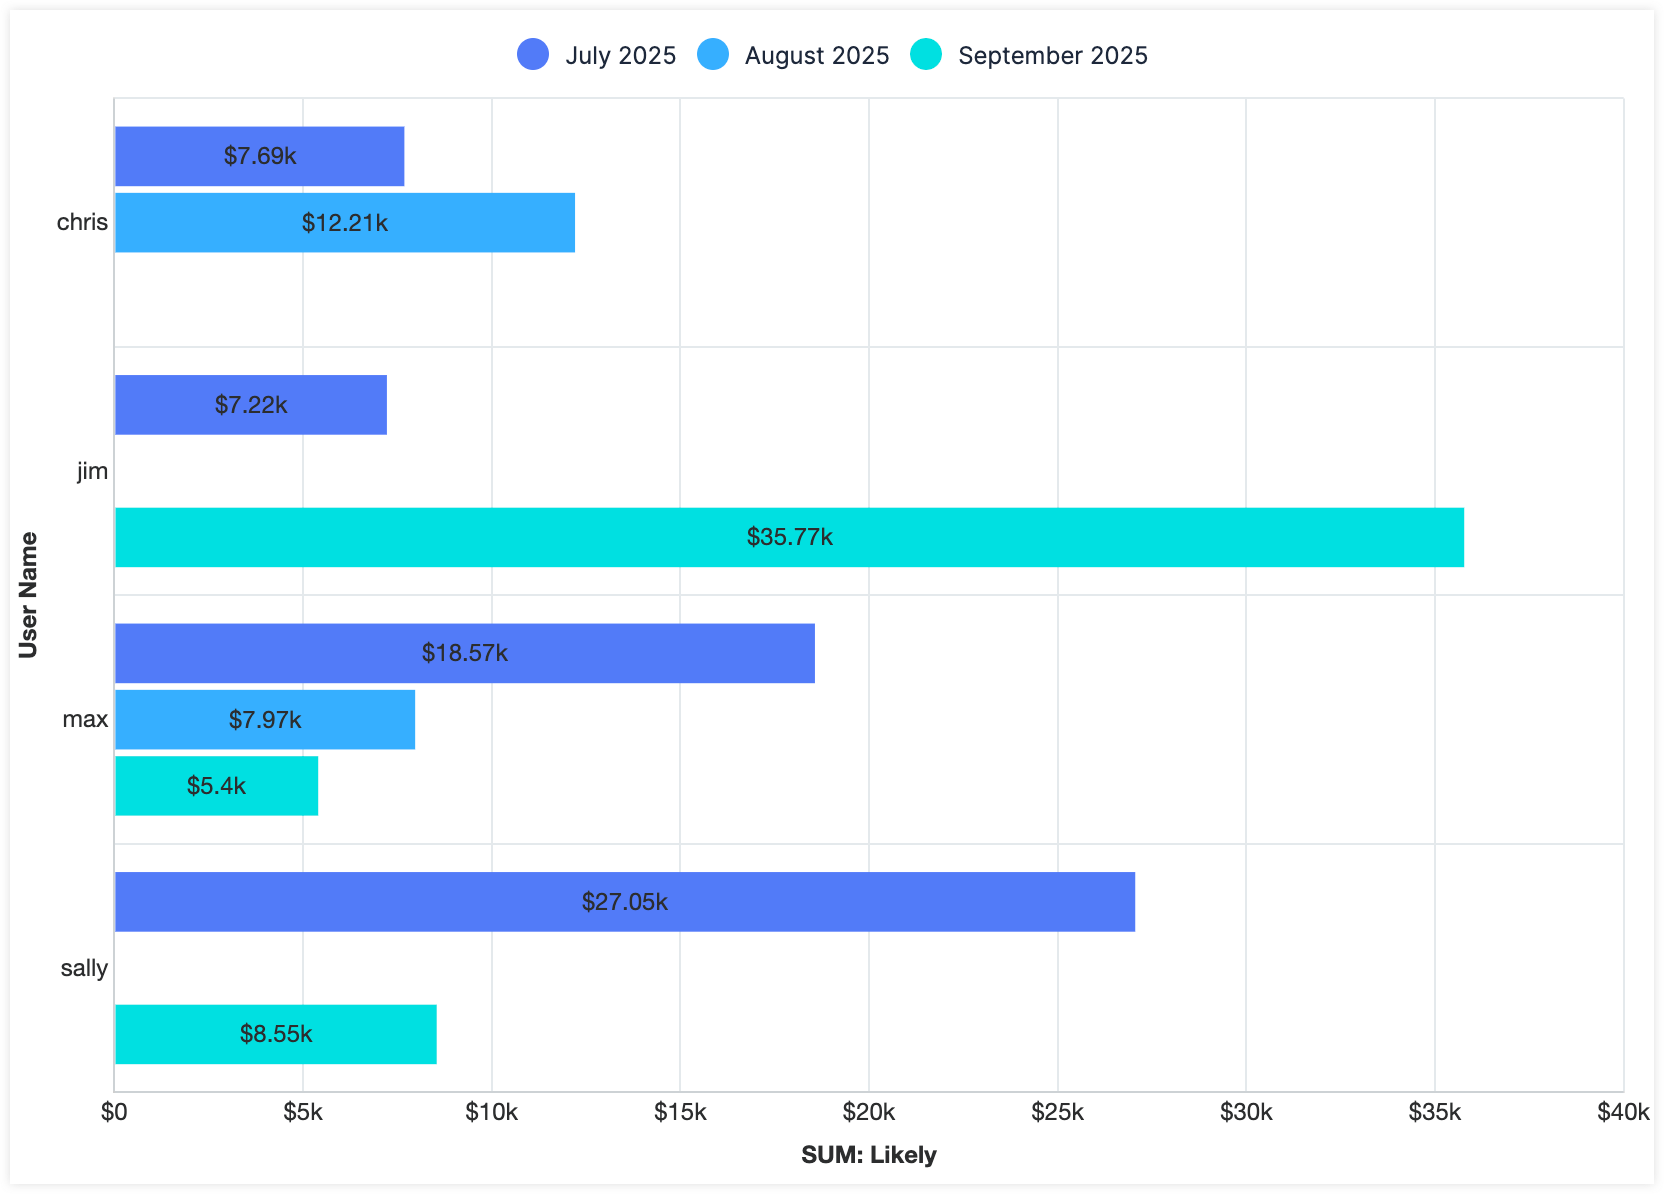 |
|
|
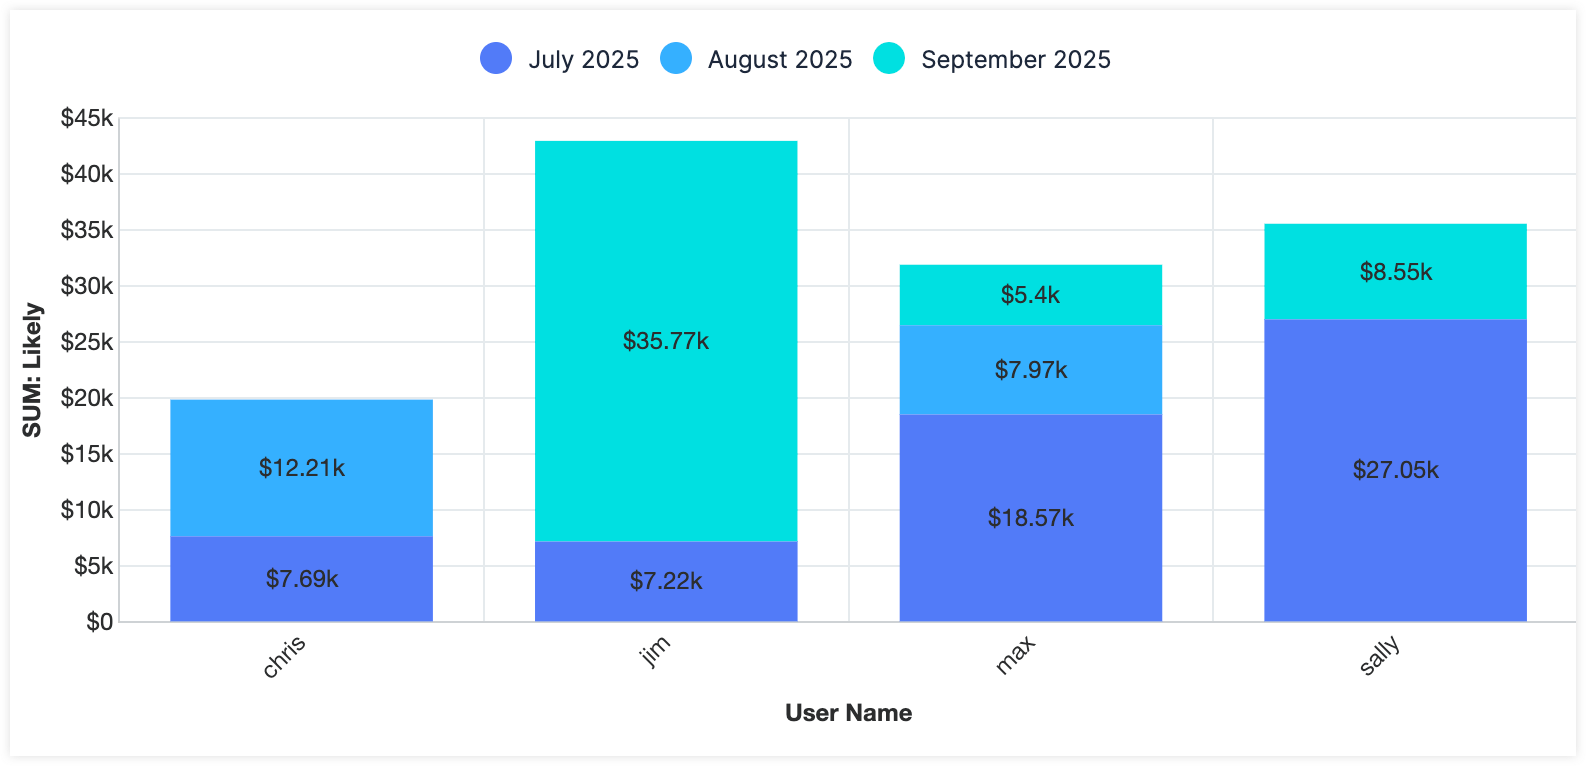
Vertical Bar (Stacked) |
Categorical data is shown as vertical bars scaled to their values with subgroups stacked as colored segments. |
|
 |
| Vertical Bar (Grouped) | Categorical data is shown as vertical bars scaled to their values with subgroups shown as clusters of bars proportionally organized within each primary grouping. | 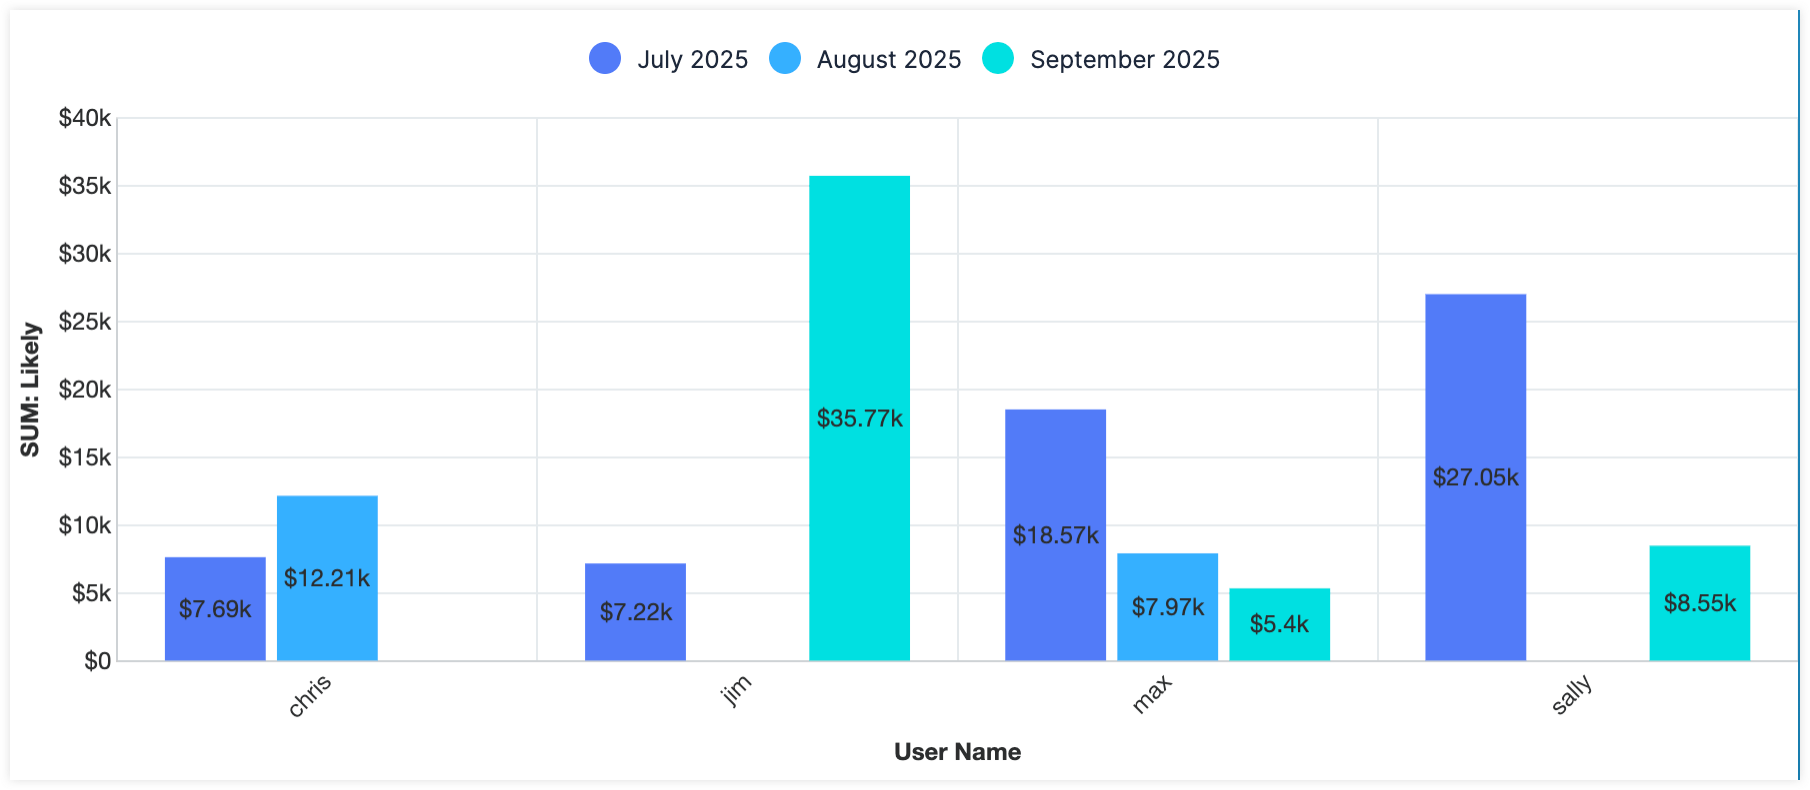 |
|
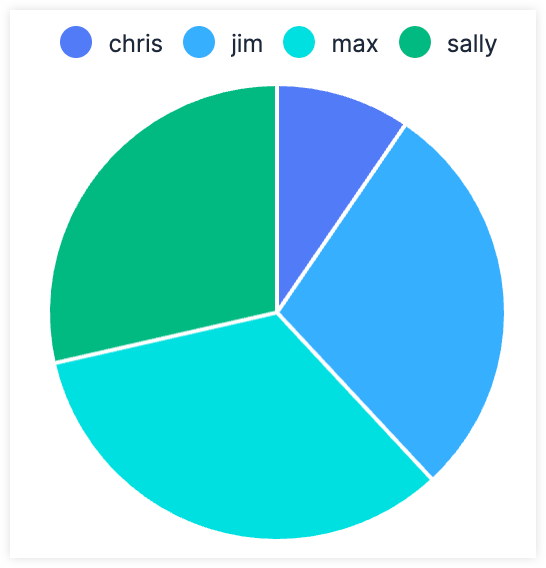
| Pie | Most useful for visualizing numerical proportions, a pie chart depicts data as proportional sections where the sum of all data is 100%. |
|
 |
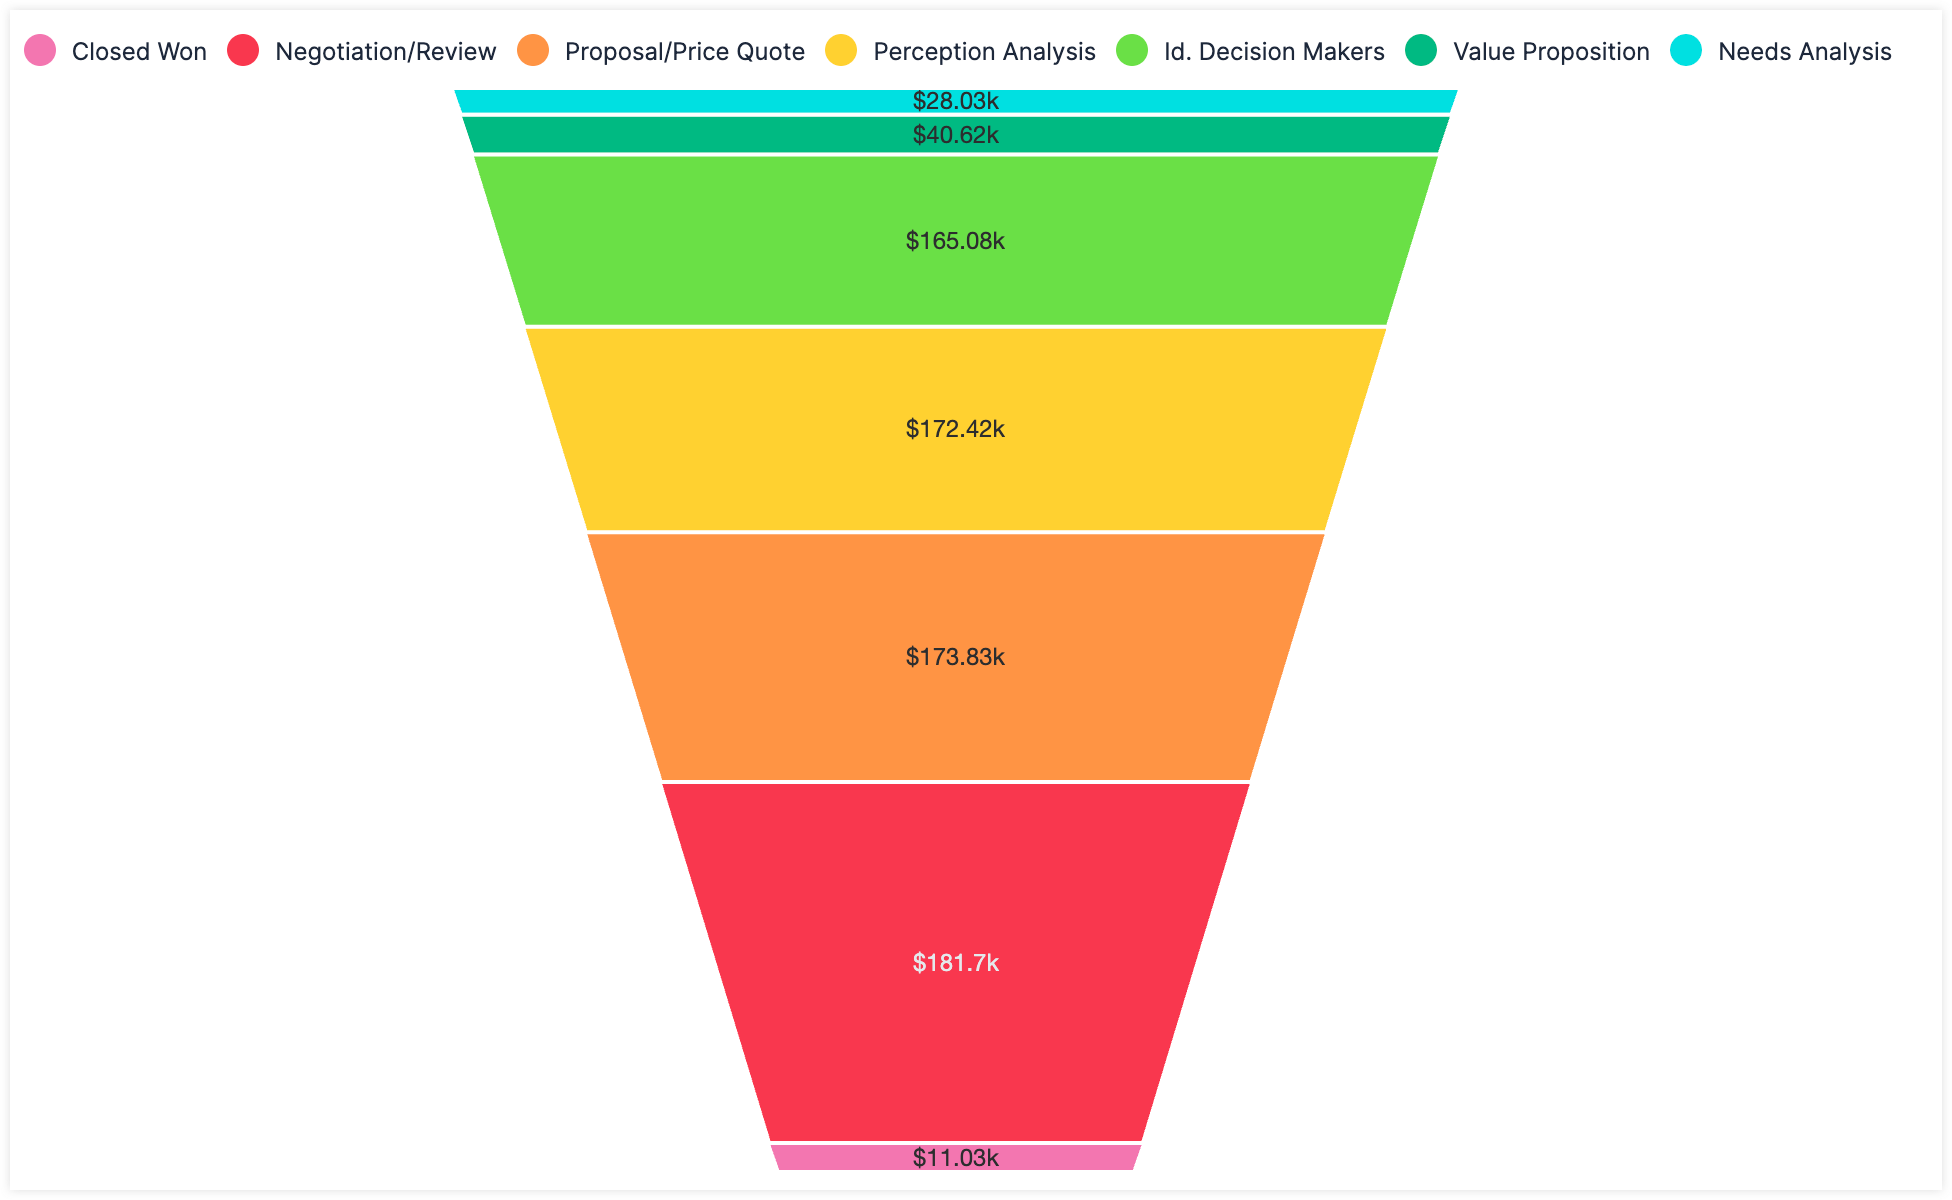
| Funnel |
Funnel charts are best for visualizing values across linear processes, typically in decreasing order as data is filtered at each stage. Dates are sorted chronologically, while dropdown values follow the order defined in the dropdown field. For more information on editing the order of dropdown lists, refer to the Administration Guide. |
|
 |
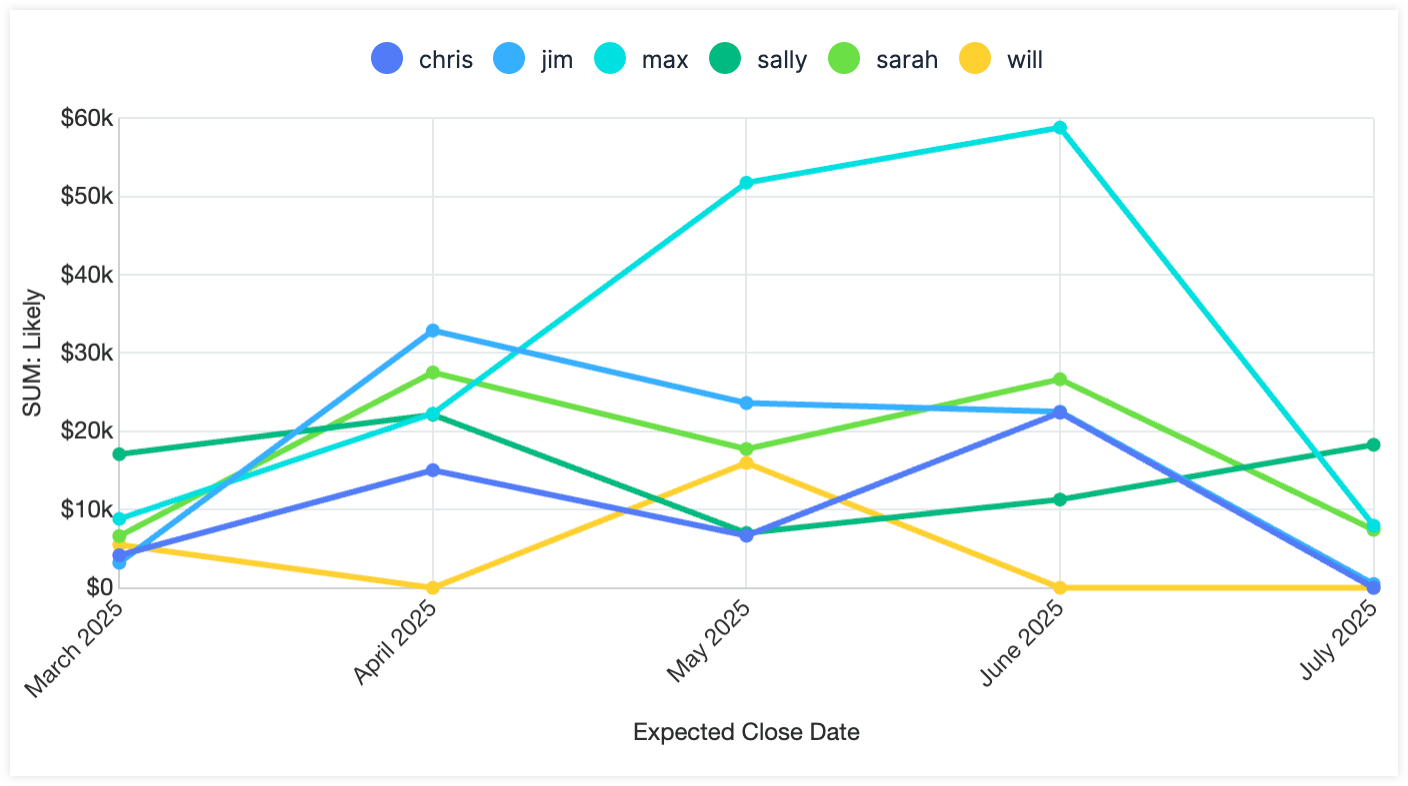
| Line | Line charts comprise a series of data points connected by line segments and are useful for displaying data trends over time. Line charts are only available when a report has two or more group-by columns. |
|
 |
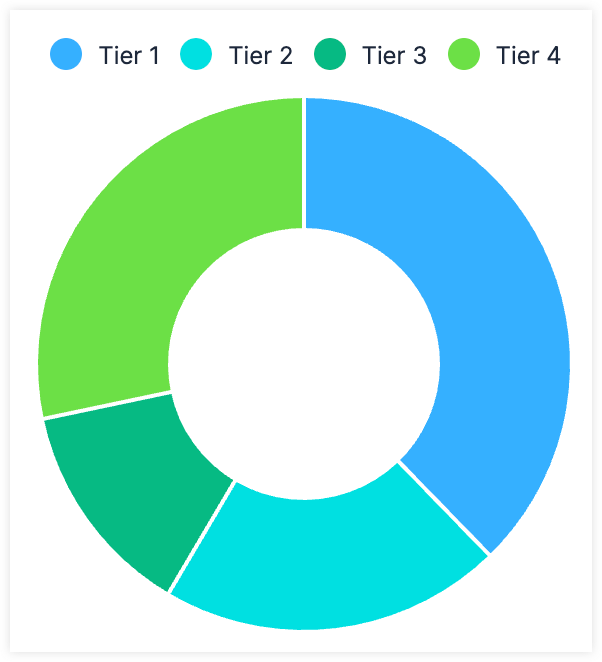
| Donut | Donut charts are similar to pie charts but with the center cut out. This chart is most useful for visualizing numerical proportions. The donut chart depicts data as proportional sections where the sum of all data is 100%. |
|
 |
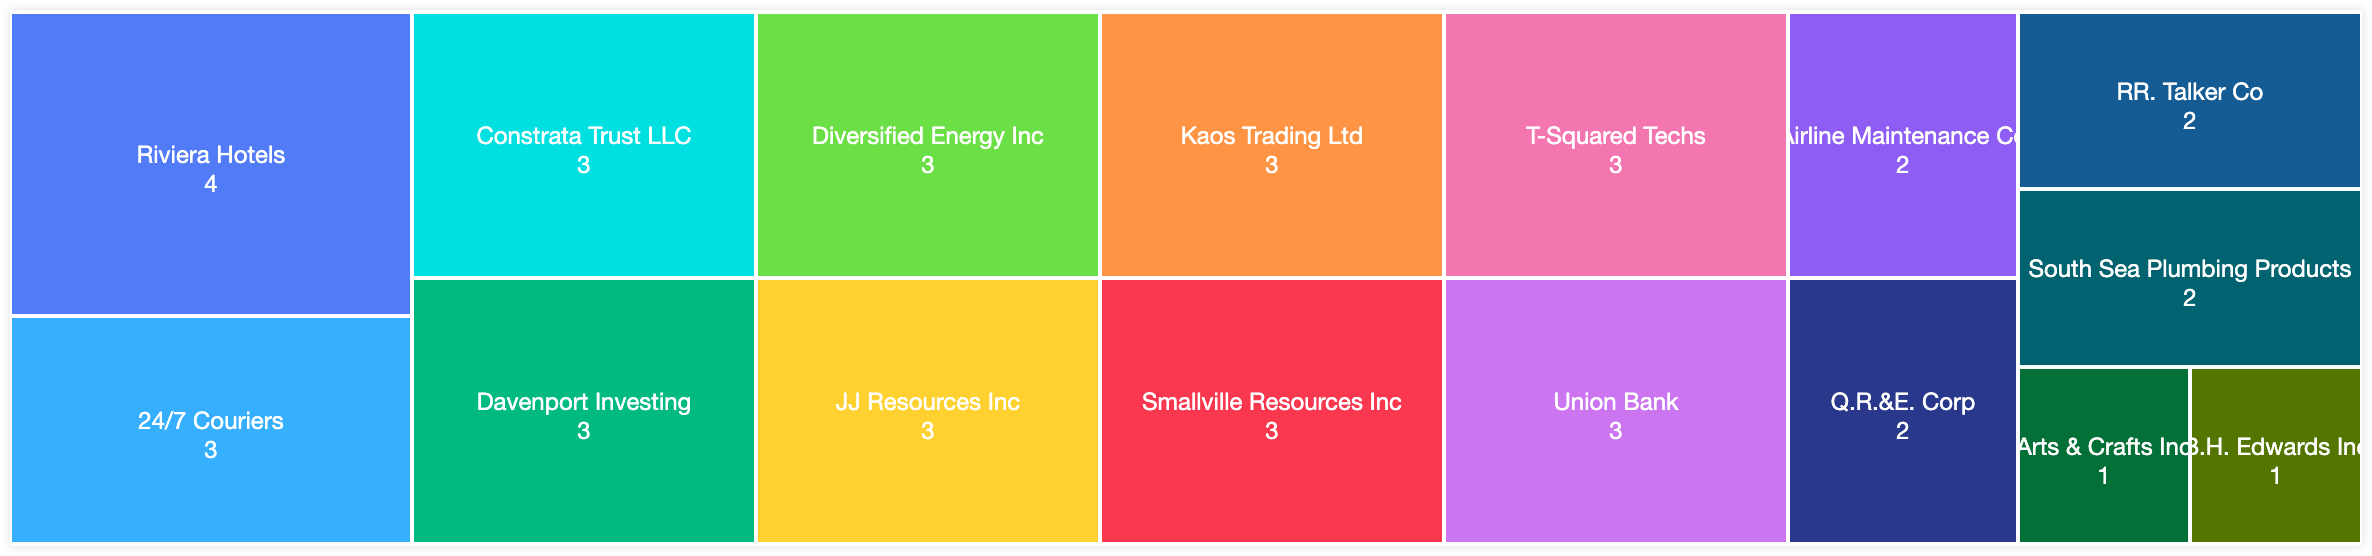
| Treemap | Treemap charts display data as a set of rectangles where the areas are proportional to the total area of all rectangles. |
|
 |
Optional Related Modules
The Optional Related Modules option will appear on the Report Details step if you add fields from related modules to the display column. Please note that if you want your report to include records whether or not they have data in the fields, you will need to mark the displayed module relationship(s) in the Optional Related Modules section. For example, if you add the email address field as a display column for the New Leads report, the Optional Related Modules section will display "Leads > Email Address". Check the box for the Email Address relationship in order to include all applicable results even if the lead record does not contain an email address. By default, Sugar treats all related modules in a report as mandatory, which means that an email address will be required for a lead record to be included.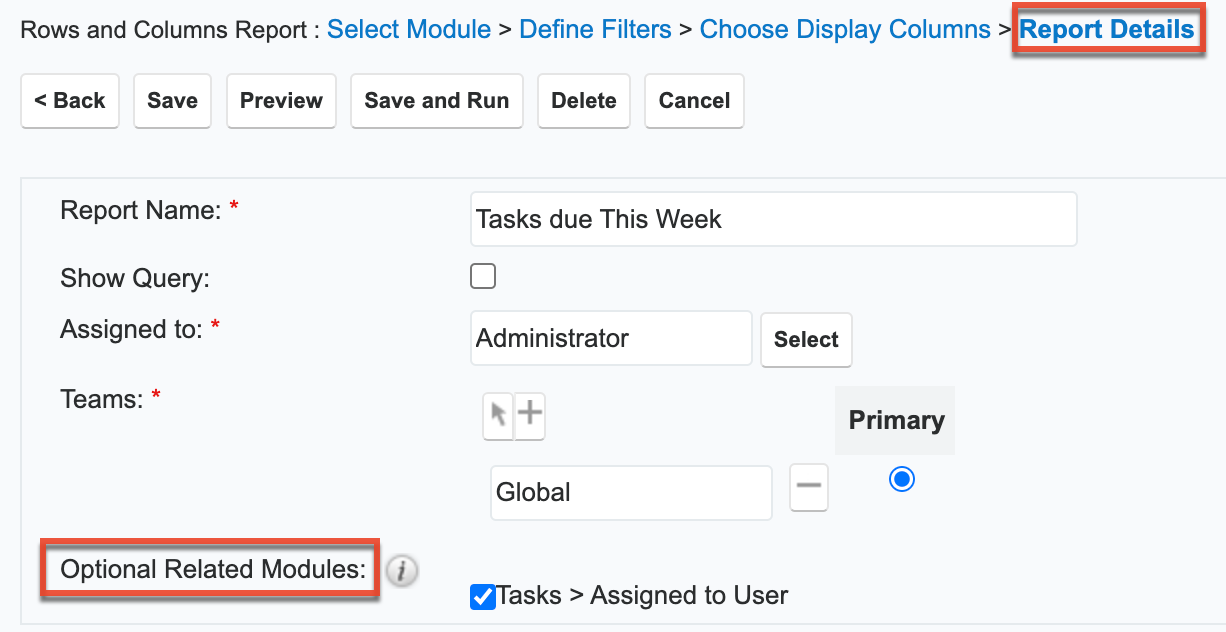
Leaving this box unchecked will exclude all lead records from your report that do not have an email address associated with them.
This holds true for all related modules. You will need to check the box for any relationship you do not wish to be treated as mandatory when Sugar is generating your report. In order to report on records with no related records of a particular module (e.g., Contacts without a related Account) using a filter such as Contacts > Accounts > Name > Is Empty, the Optional Related Modules will also need to be checked.
Show Query
The Show Query option is only visible to system administrators and displays as a checkbox on the Report Details step. If the Show Query box is checked and the Preview button is clicked, the generated report will display all the SQL queries for administrators to use and analyze how the specific data was retrieved in the system. 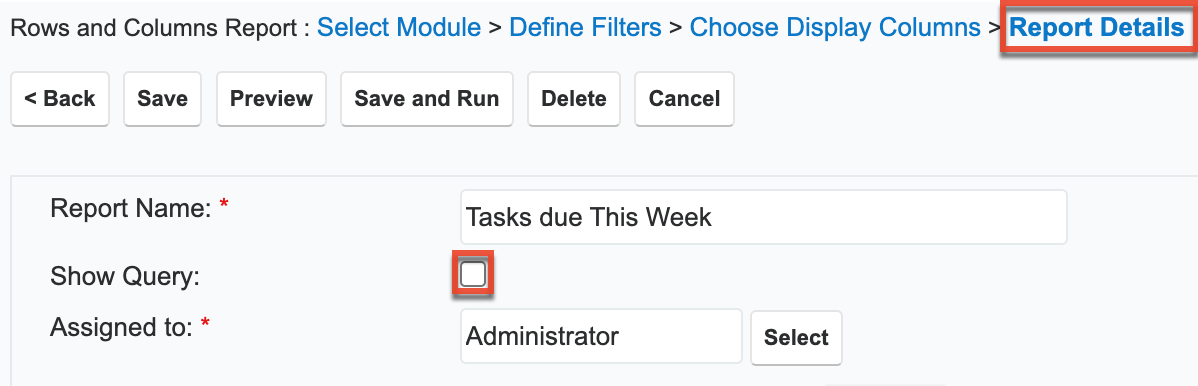
Report Results View
The report results view is where you view the data that is returned for your report. The results view can be reached by clicking a report record's link from anywhere in the application including from the Reports list view.
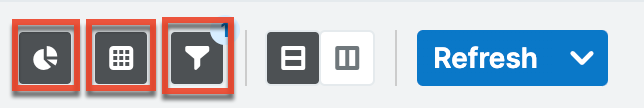
To hide or display specific panels in the results view, use the buttons in the top right of the results view:
- Chart View button (pie chart icon): The chart panel displays your chart, if applicable. If your report does not contain a chart, this button is disabled.
- Table View button (data table icon): The table panel displays your data in a table format.
- Filter View button (funnel icon): The filters panel is shown on the right side of the results view. It shows your run-time and advanced filters.
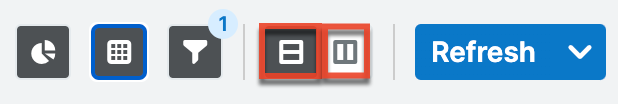
When you have both a data table and a chart in your results view, you can configure whether you want them in a horizontal or vertical split view using the buttons to the right of the Chart View button:
- Horizontal split view: Show the chart on the top and the data table on the bottom.
- Vertical split view: Show the chart on the left and the data table on the right.
If you have both the table and chart visible (i.e., you are in a split view) you can change the relative size of the table and chart by clicking on the dividing line and dragging the divider to a new location.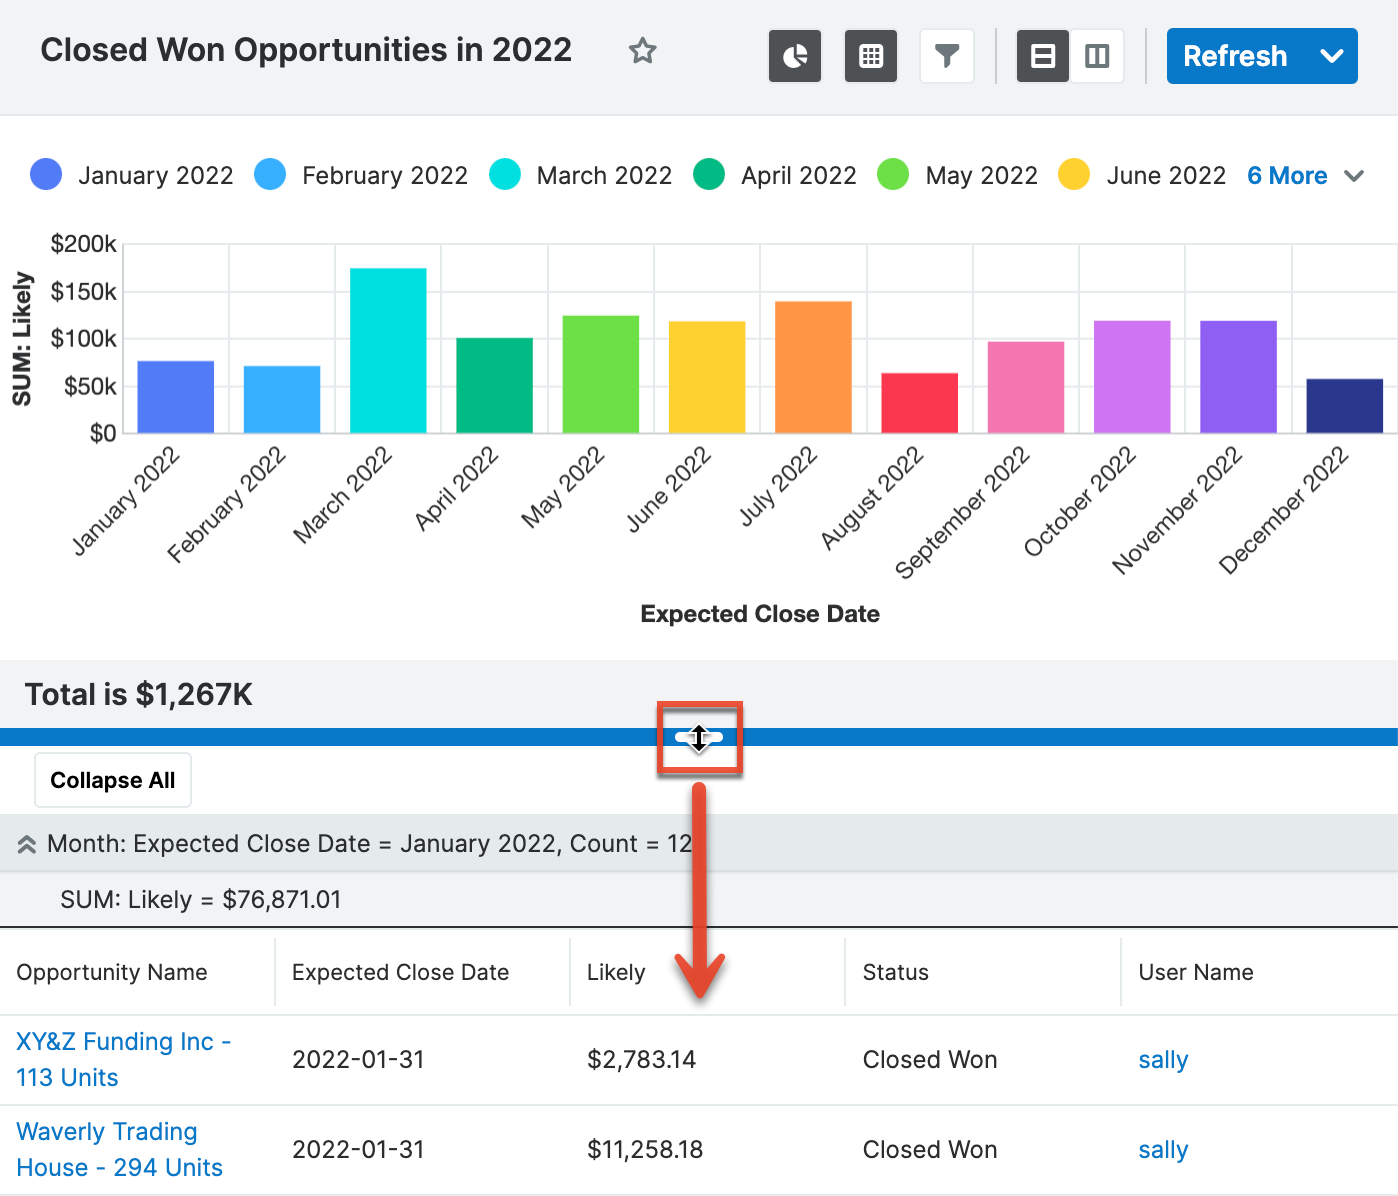
Any changes you make to the layout of the results view is unique to you and will be reflected if you log in to Sugar from a different computer or browser.
The results view Actions menu appears on the top right of the results view and allows you to perform various actions on the current report.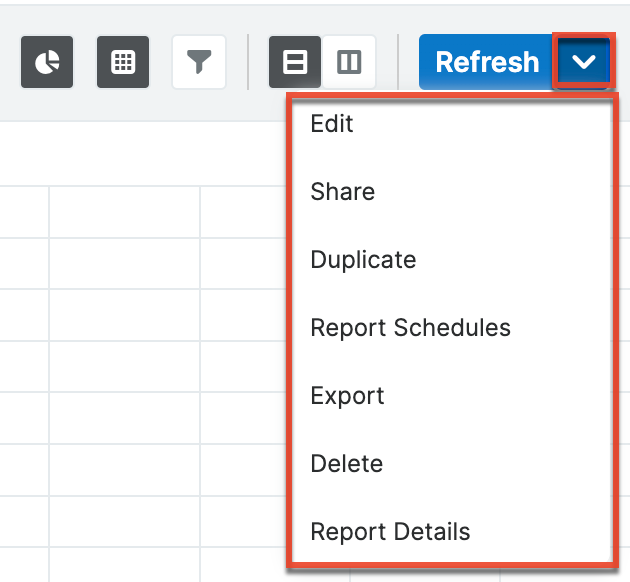
Please note that your access to reports and the displayed results in a report will vary according to your team membership, user type, and role restrictions. For more information on teams and roles, please refer to the Team Management and Role Management documentation in the Administration Guide.
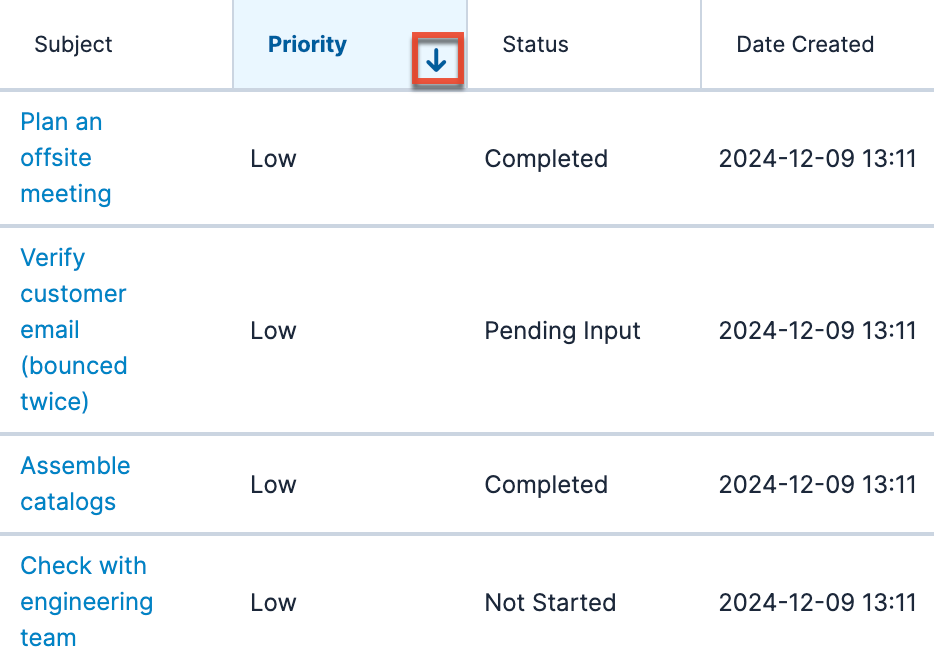
Column Sorting in Results View
Sugar reports with an accompanying table of data, such as a rows and columns report, provide users the ability to sort all of the current report results by a field column in either ascending or descending order. To sort by a field or switch the sort direction, click the column header noting that columns that allow sorting have an arrow that appears when hovering over the column header. You can click the column header again to reverse the sort order.
Note: Report results may only be sorted by one column at a time and cannot be sorted by custom relate fields.
Filters
The Filters panel contains information about the filters applied to the generated report. The filters displayed under the Filters heading are run-time filters. Run-time filters allow you to quickly change the filter values on the report without having to edit the report. The number of run-time filters present is indicated by a number badge on the Filter View button. Please note that run-time filters only appear if filters are set in the Define Filters step when building the report (to edit these filters, see the Editing via Results View section below). The report will be filtered based on the original filter value, but you can change the value via the Run-time filter and click "Apply" or "Refresh" to re-generate the report result. For more information on run-time filters, please refer to the Run-Time Filters section.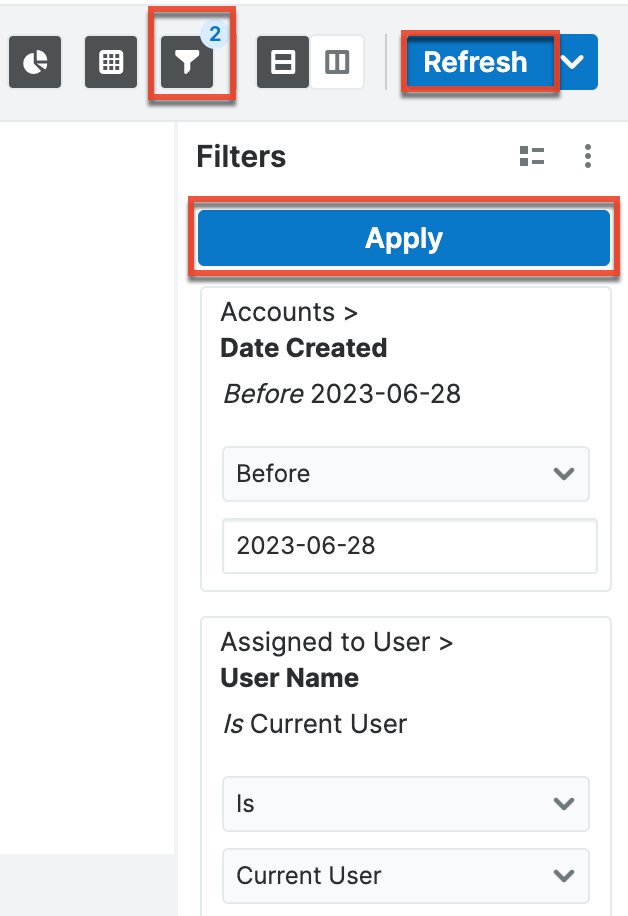
To see all filters applied to the report, click the Advanced Filters button.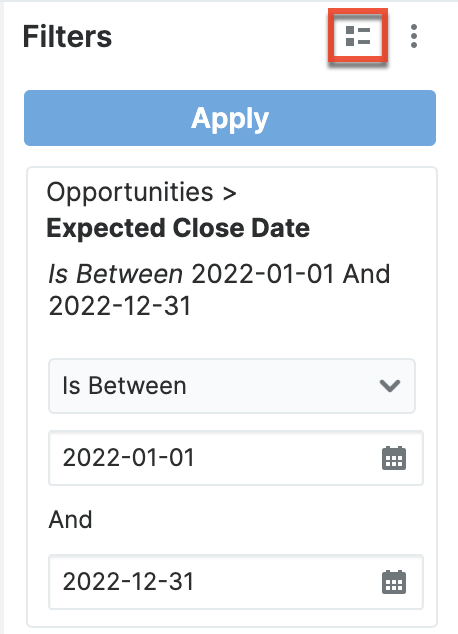
You cannot edit filters in the Advanced Filters drawer; the visualization is read-only. Static filters (i.e., non-run-time filters) are indicated with a lock icon.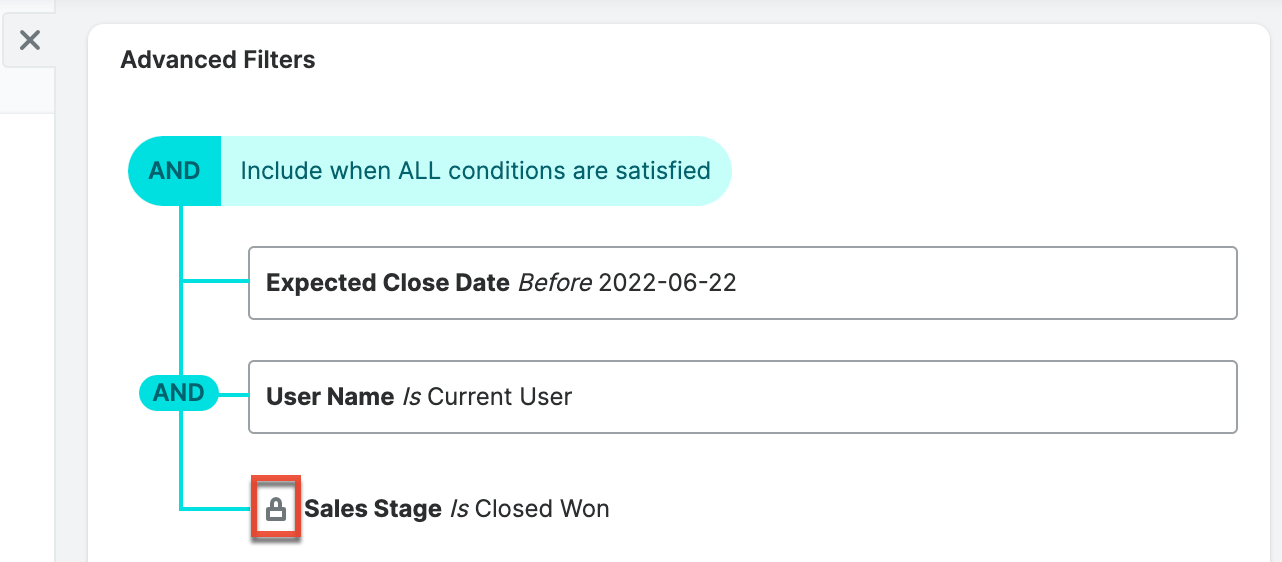
Click the Filters panel Actions menu (three-dots icon) to open a menu with more actions. Select "Reset to Default Filters" to reset the run-time filters to the original filter values. Select "Copy Filter Summary" to copy a JSON-language summary of the filters used on the report to your computer's clipboard. 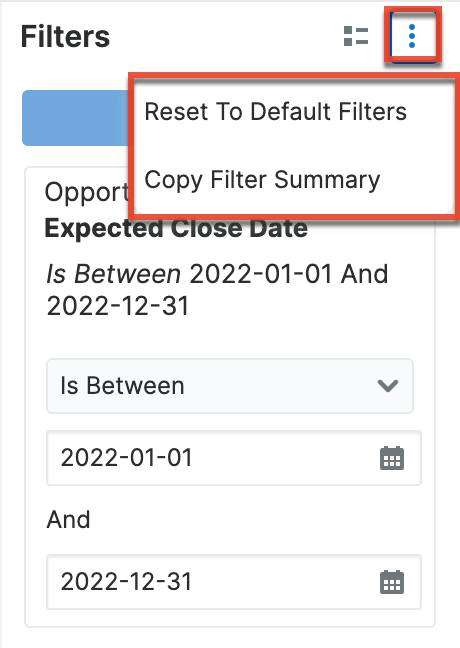
Please note that the Report Wizard retains the original filter value(s) you set when building the report regardless of the changes you or other users make on the run-time filters on the report's results view. If the report is shared by a team, then each user can run the report with different run-time filter values to meet their individual needs. The run-time filter values set by each user will be preserved for future viewing until they change or reset the value.
Report Details
To view the report details, click the Actions menu in the top right corner of the results view and select "Report Details".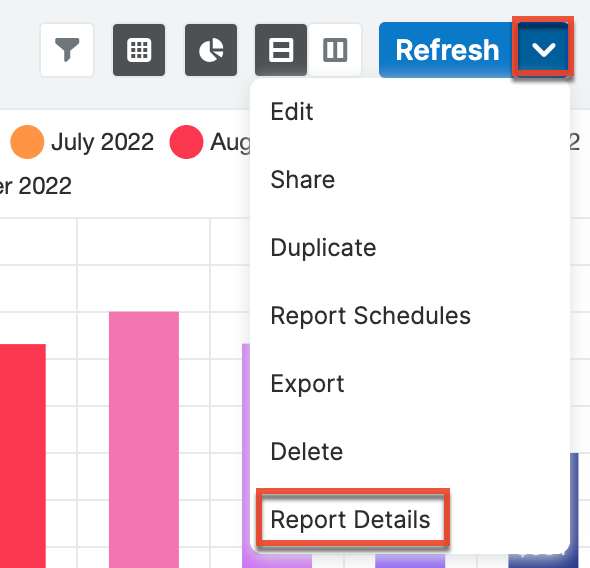
The report details box will appear displaying the report's name, display columns, report type, team(s) assigned to report, etc. 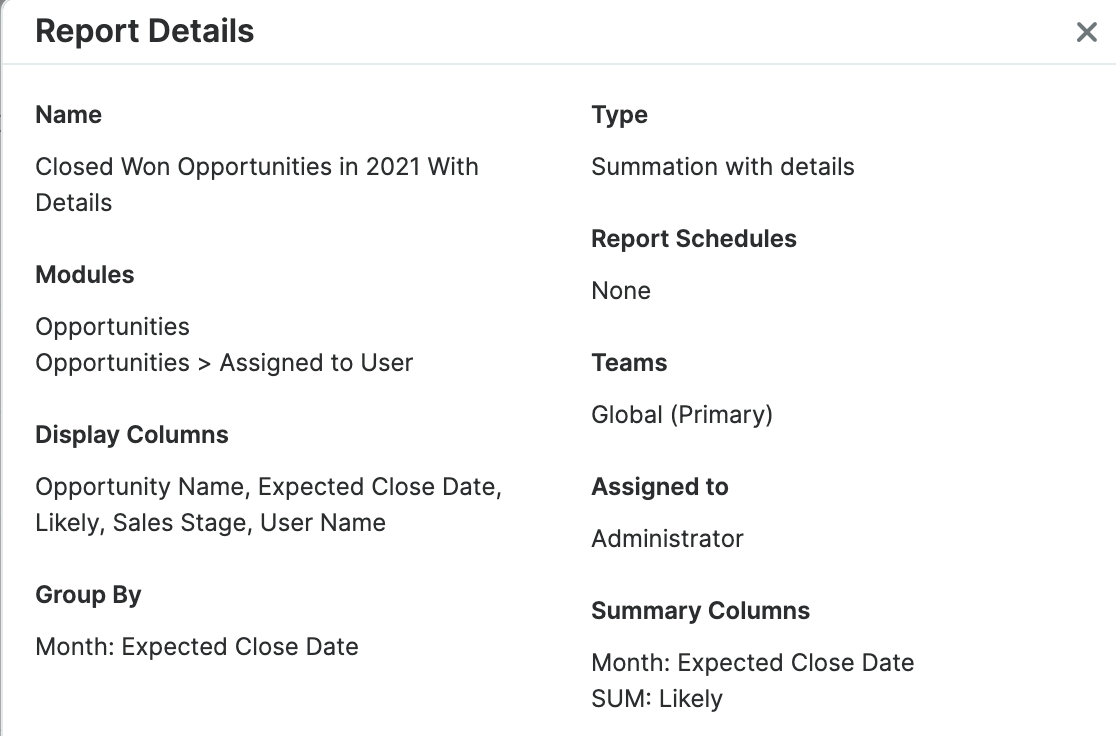
Report Chart
Users have the option to display the data as a chart which then allows users to drill into each segment to display the associated records. The chart option is available for Summation with Details-type, Summation-type, and Matrix-type reports. You can choose a type of chart for display via the Chart Options step of the Report Wizard. Please note that at least one group-by and one calculated display summary (e.g., Count, AVG: Likely, SUM: Likely) must be selected in order to be able to display a chart.
After running the report, you can hover on a segment of the chart to view the corresponding chart values. Clicking on a segment will open a focus drawer containing a list of the records making up that segment and the chart. For more information, refer to the Drilling Through Report Charts section below. To change the visibility of a segment of data on the chart, click on the corresponding element in the chart's legend. Hidden segments will be crossed out in the legend.
Report charts can also be added and displayed as a Sugar dashlet on any Sugar dashboard with the Report Dashlet. The Report Dashlet also allows for drilling through to access the associated records. For more information on adding report charts as dashlets, refer to the Report Dashlet section below.
Note: When you make a chart in the Reports module, there is a limit to the number of groups allowed. The limit is 50 groups for all charts except funnel, for which the limit is 16. The limit only applies to charts. If the number of elements is more than 50 (or 16 for funnel), then an error message is displayed at runtime.
Drilling Through Report Charts
In order for drill-through to work for a given report chart, the following conditions must be met:
- When viewing from the Reports module, the report has been run by navigating to the report's results view, clicking the Refresh button, or clicking "Save and Run" after editing.
- When viewing from a dashboard, you are viewing a Report Dashlet. Drill-through is not supported for other dashlets containing charts (e.g., Pipeline dashlet).
- The base module of the report is a Sidecar module. For more information, refer to the User Interface documentation.
- The report is not grouped by a DateTime-type field such as Date Created or a Multiselect-type field. Reports grouped by aggregate DateTime-fields (e.g., Month: Date Created) do support drill-through. For more information on field types, refer to the Studio documentation.
Clicking a segment of a report chart will open a focus drawer containing a filtered list view showing the records belonging to that segment. To the right of the list view is the chart with the currently selected segment highlighted. The segment's applied filter will also be noted above the list view (e.g., "User Name: chris").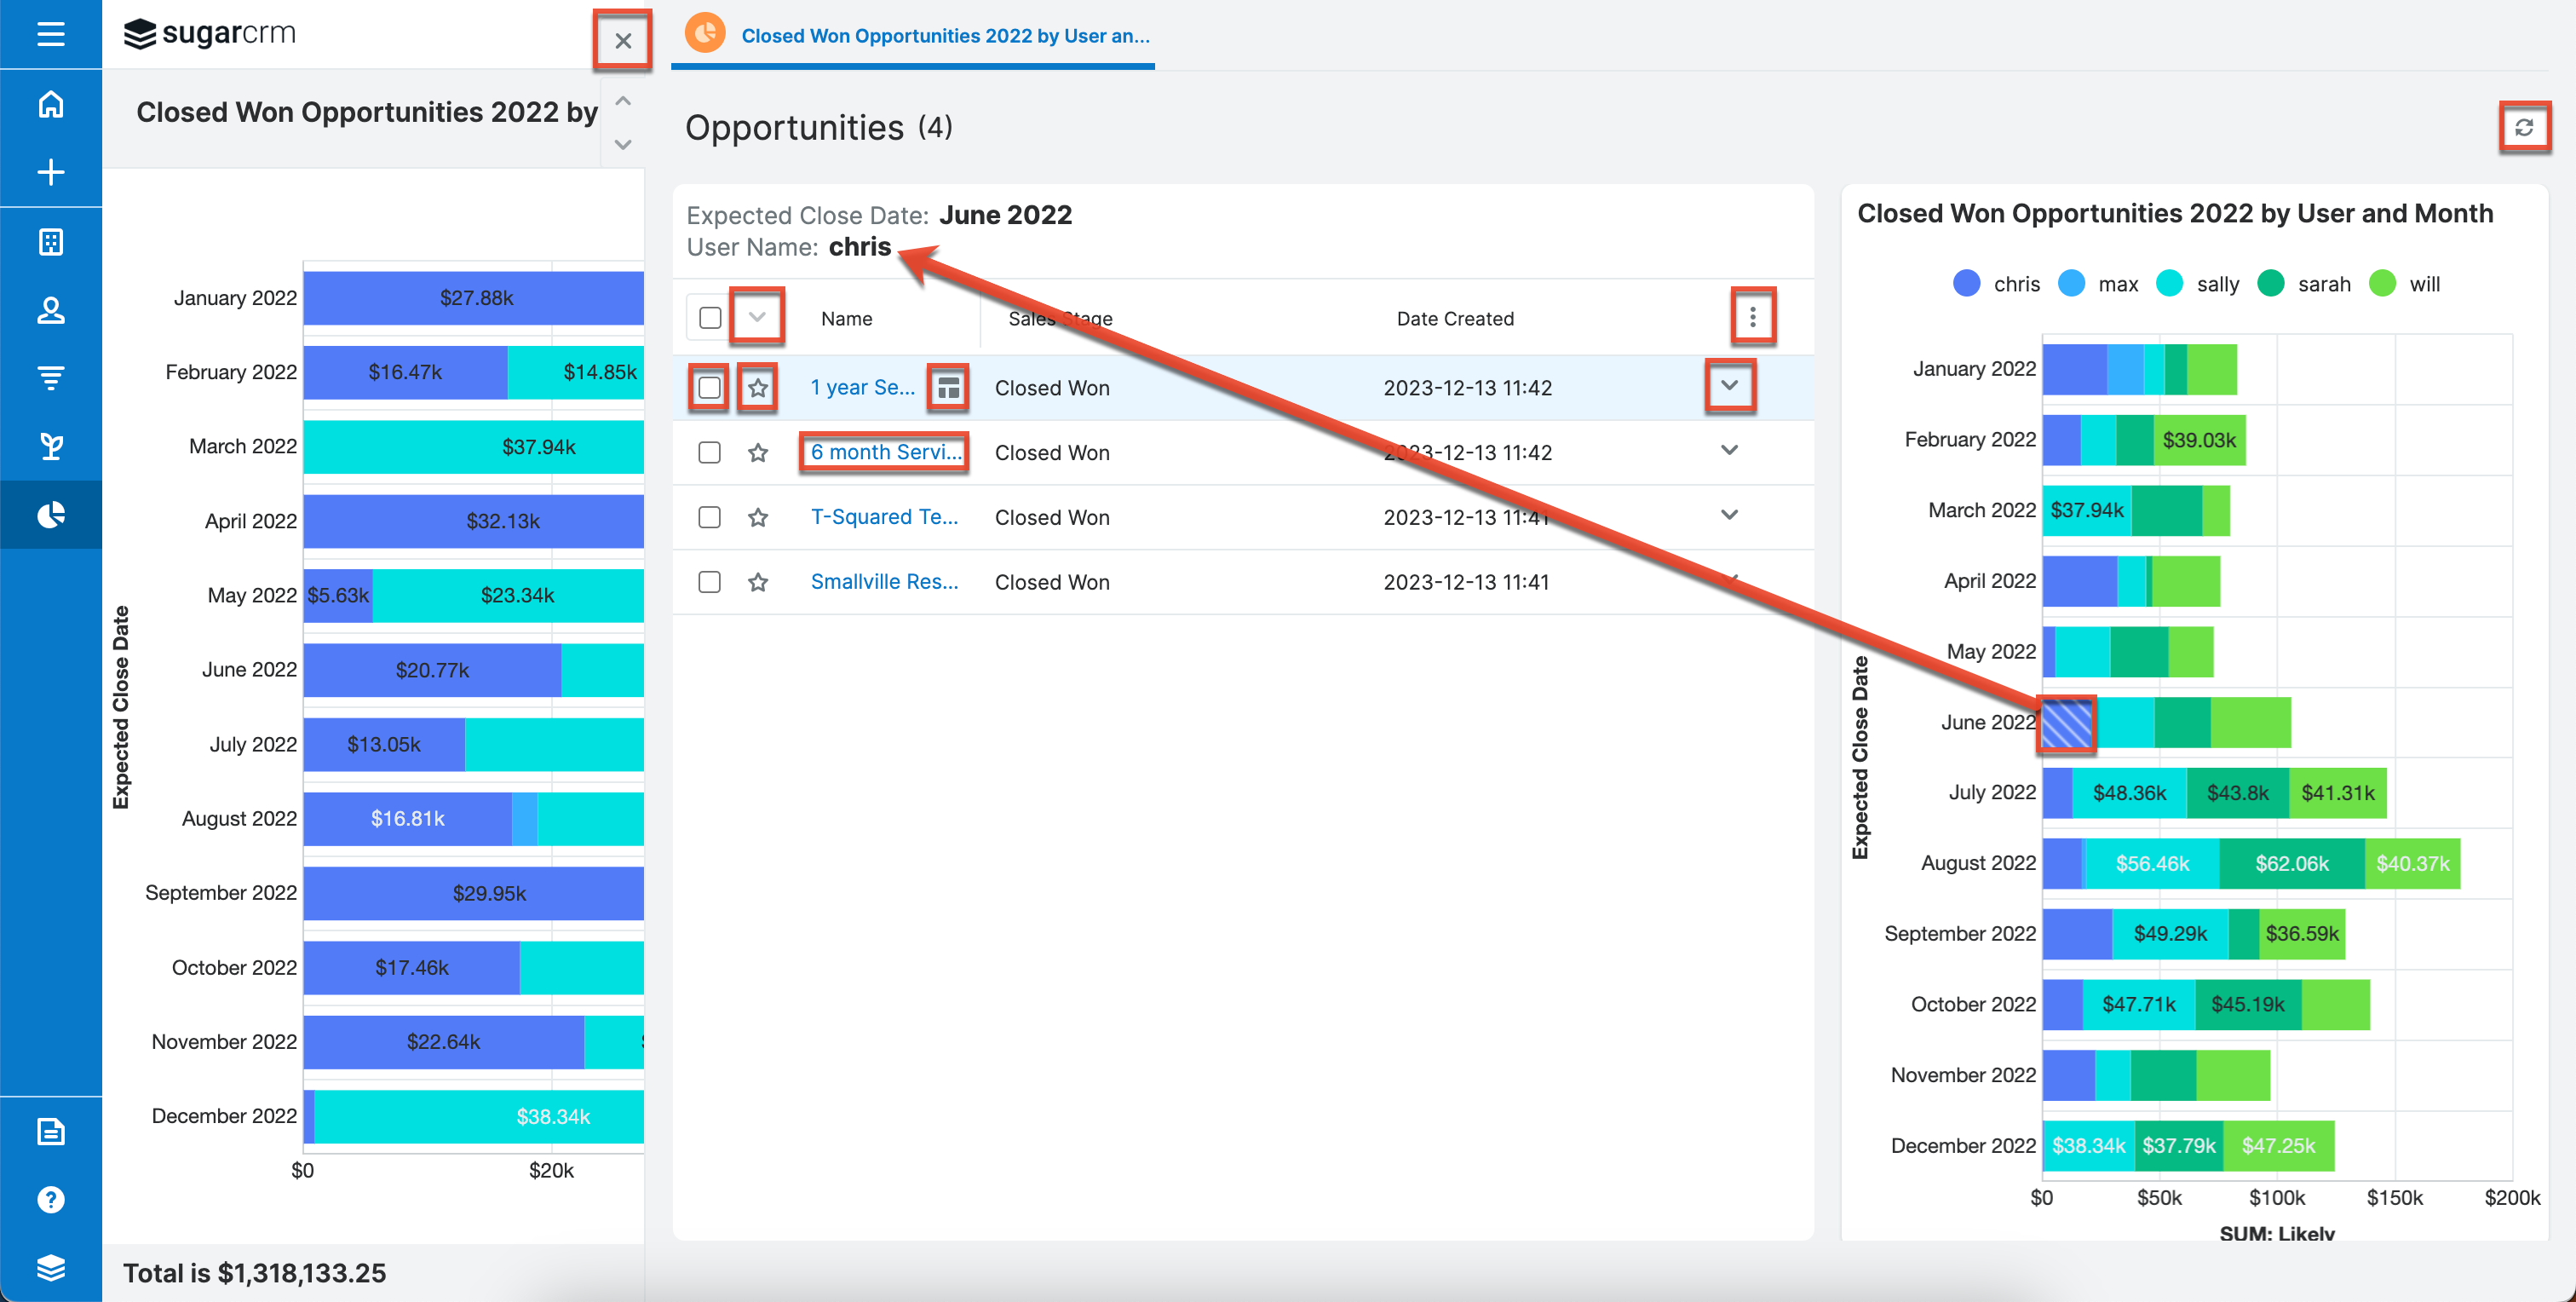
The following operations are available when drilling through a report chart:
- Select a new segment: Click a different chart segment to update the list view filters and show the new segment's associated records.
- X: Click the "X" on the top left of the focus drawer to close the drawer and return to the previous view.
- Refresh list and chart: Click the Refresh button (refresh icon) above the report chart to update and reload the filtered list view results and chart.
- Display columns: Click the three-dots menu to the far right of the list view column headers to choose which fields to display.
- Open records: Click the name of a record in the list to open it in record view.
- Favorite designation: Click the star on the left of a record's row to toggle it as a favorite. A dark-gray star indicates that the record is a favorite while a white star indicates it is not.
- Record Actions menu: Click the triangle to the right of any row to access the record Actions menu to edit, follow, or delete specific records from the list view.
- Focus icon: Click the Focus icon that appears when hovering over certain links (e.g., opportunity name, call subject) in the list view to open the focus dashboard displaying a 360-degree view of the linked record through a set of dashlets containing relevant information such as the record's related records, related activities (e.g., calls), etc.
Note: Opening a quick-create drawer (i.e., clicking the Plus (+) icon) from the Timeline dashlet in the focus drawer will automatically close the focus drawer in view. Once the quick-create drawer is closed, you will return to the filtered list view results drawer. - Edit records: Double-click on a row to enable inline editing or use the Edit option from the row's Actions menu.
- Checkbox selection: Mark the checkbox on the left of each record row to select individual records from the list view. Click the checkbox to the left of the Mass Actions menu to select all records displayed on the current set of list view results.
- Mass Actions menu: Click the triangle to the right of the checkbox option to access the Mass Actions menu to perform various actions (e.g., Mass Updates, Delete) on the currently selected records.
Report Results
The report's results view will display the report results with relevant data and report chart (if applicable) for all records that meet the specified criteria. Please note that each report type will display the report results differently and users should consider how they would like to view the data prior to creating the report.
The data table of results is displayed with the report by default and its visibility can be toggled using the Table View button at the top of the screen.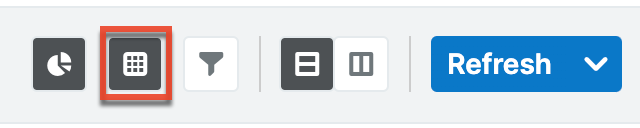
Report data tables can also be added and displayed as a Sugar dashlet on any Sugar dashboard with the Report Dashlet. The Report Dashlet also allows for drilling through to access the associated records if a link to the Sugar record (e.g., a linked account name, case/meeting subject) is included in the table. For more information on adding report data tables as dashlets, refer to the Report Dashlet section below.
Rows and Columns Report Result
The report results for this report type display the data in simple rows and columns format. The display column field values for all records that meet the specified criteria will appear on the report result. You can view a record's details by clicking on the record's name or clicking the Focus icon to open a focus drawer. You can also sort the report results by a display column in either ascending or descending order. To sort by a field or switch the sort direction, click the column header noting that the fields which allow sorting will have an up or down arrow that is visible when you hover over the table. Please note that the report may be sorted by only one column at a time. You may change the width of the columns by hovering over the separation line between the column headers to reveal the double-sided arrow. Click and drag the arrow to resize the columns. To view an example Rows and Columns report result, please refer to the creating Rows and Columns Report section.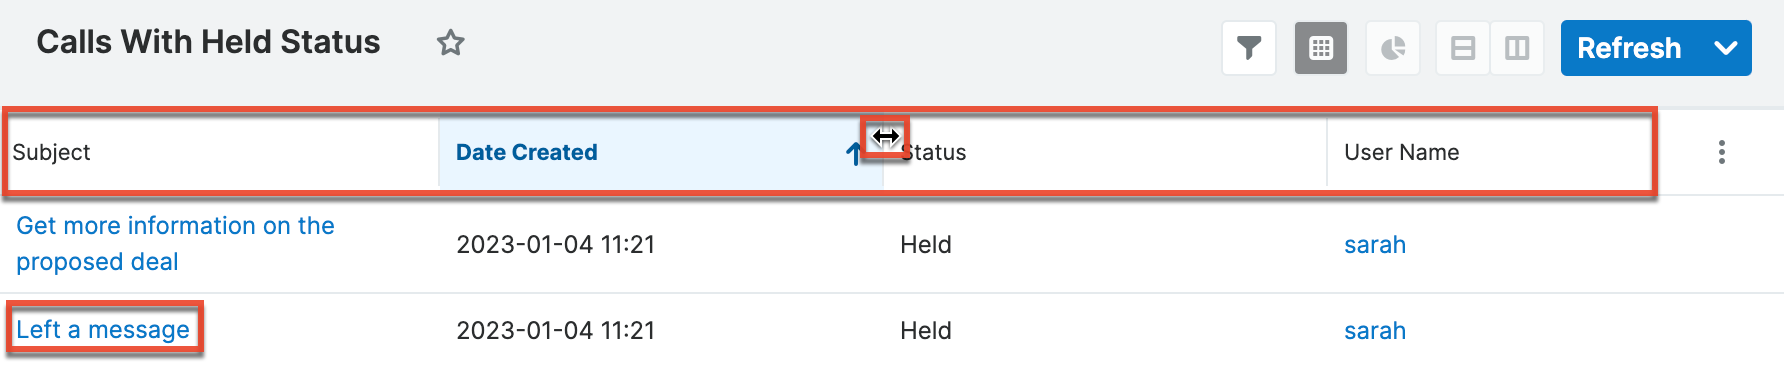
Summation Report Result
The Summation Report provides an overview of the selected field data(s) grouped by specific criteria(s). The report result displays the data in groups summarized using computed derivatives (e.g., SUM, AVG, MAX, MIN) from numeric-type field values (e.g., Likely) as well as weighted amounts. Each field you select in the Define Group By and Choose Display Summaries steps will be displayed as a column in the report result. The field(s) in the Define Group By list determines how the data will be grouped on the report results table and the chart. For example, if you group the opportunity report by "User Name" then "Month: Expected Close Date" on the Define Group By list, the opportunity records will be grouped by the user assigned to the opportunity and each user will be broken up by the month of the expected close date in the report results. The grand total of the summarized field values will display at the bottom of the report results page.
You can sort the report results by a field column in either ascending or descending order. To sort by a field or switch the sort direction, click the column header noting that the fields which allow sorting will have an up or down arrow that is visible when you hover over the table. Please note that the report may be sorted by only one column at a time. You may change the width of the columns by hovering over the separation line between the column headers to reveal the double-sided arrow. Click and drag the arrow to resize the columns. To view an example Summation report result, please refer to the Creating Summation Report section.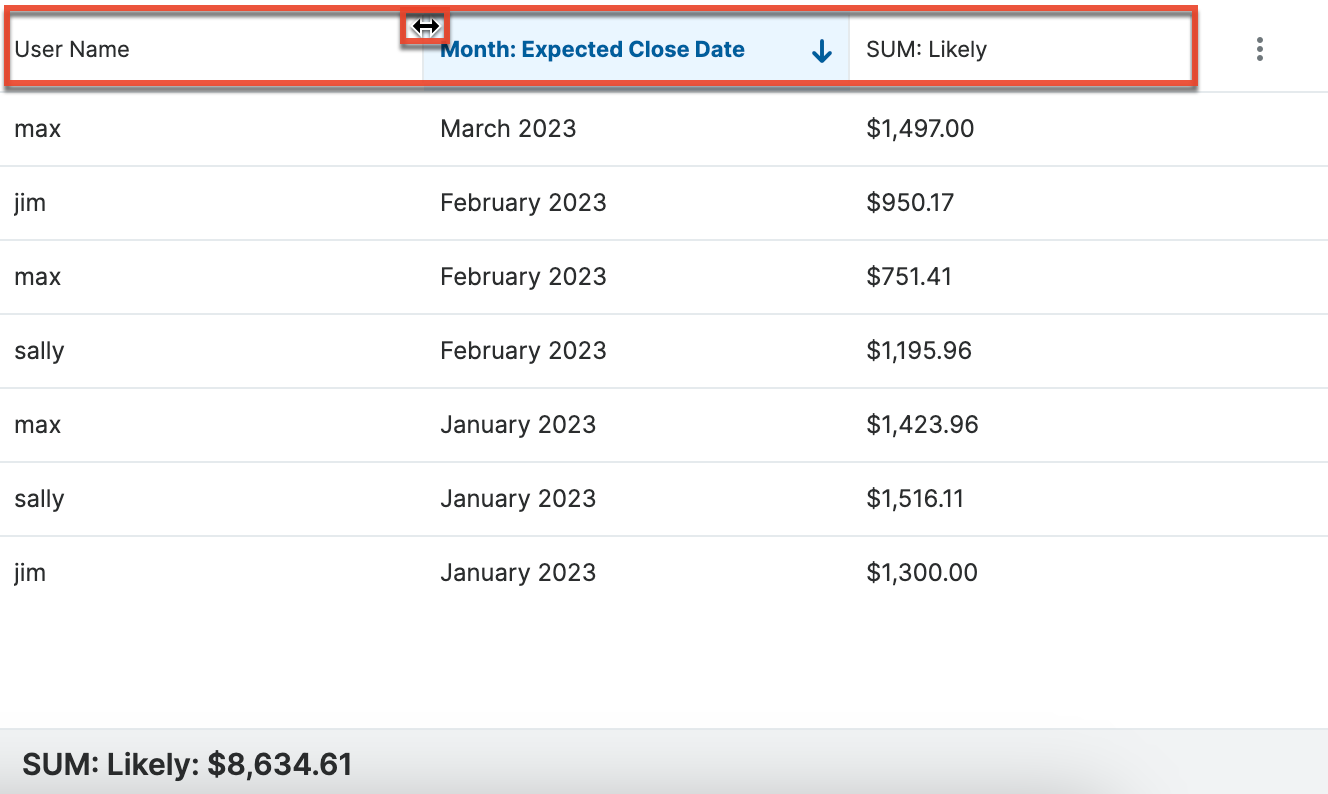
Summation Report with Details Result
The Summation Report with Details groups the data and displays the total summary count for records in the report result. Unlike the Summation Report, this report type includes display columns for fields related to the target and related module. The report result will group the data into different categories based on the specified field values. The field values for all records that meet the specified criteria will be displayed in a rows-and-columns-type table broken up into grouped panels. You can sort the report results by a field column in either ascending or descending order. To sort by a field or switch the sort direction, click the column header (e.g., Expected Close Date) noting that the fields which allow sorting will have an up or down arrow that is visible when you hover over the table. Please note that the report may be sorted by only one column at a time. You can also view the record's details by clicking the record name.
Each panel header will display the grouped by field value(s) along with the total summary count for the group. You can collapse the grouped panels individually by clicking the double-up arrow in the upper left of the table grouped panel or click "Collapse All" to collapse all panels. Collapsed panels will display the header with the display summaries for each group and you can click the double-down arrow to open the panels again. The grand total for the summarized field values will appear at the bottom of the report results page. To view an example Summation with Details report result, please refer to the Creating Summation Report with Details section.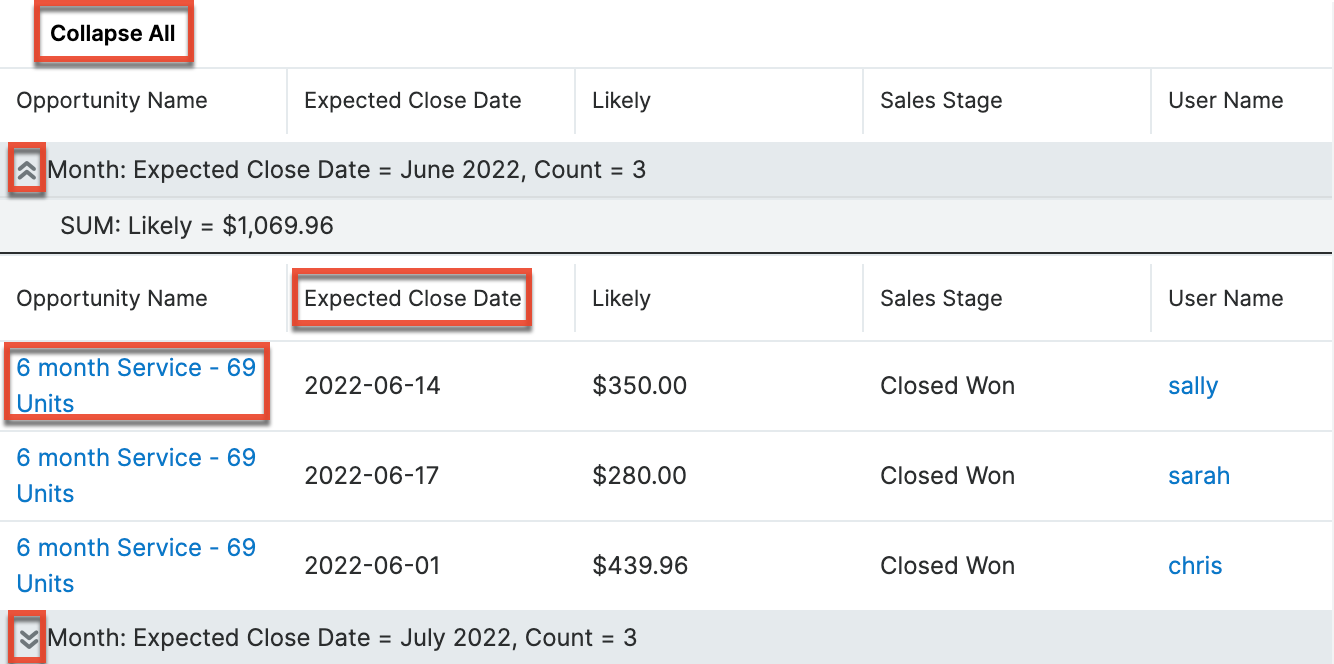
Matrix Report Result
The Matrix report groups the fields based on the group-by fields and displays the summary for specific numeric-type field values that you select. The report result displays the data in a grid table with row and column headers. If you selected three group-by columns, then you will have the option to choose specific report layouts (e.g., 1x2 and 2x1) on the Report Details step. The 1x2 layout option will display the data for the first group-by field in a row and display the data for the other two group-by fields in columns. The 2x1 layout option will display the data for the first two group-by fields in rows and display the data for the third group-by field in a column. The report results will show the grand total for each field row on the table as well as for each column. To view an example Matrix report result, please refer to the Creating Matrix Report section. 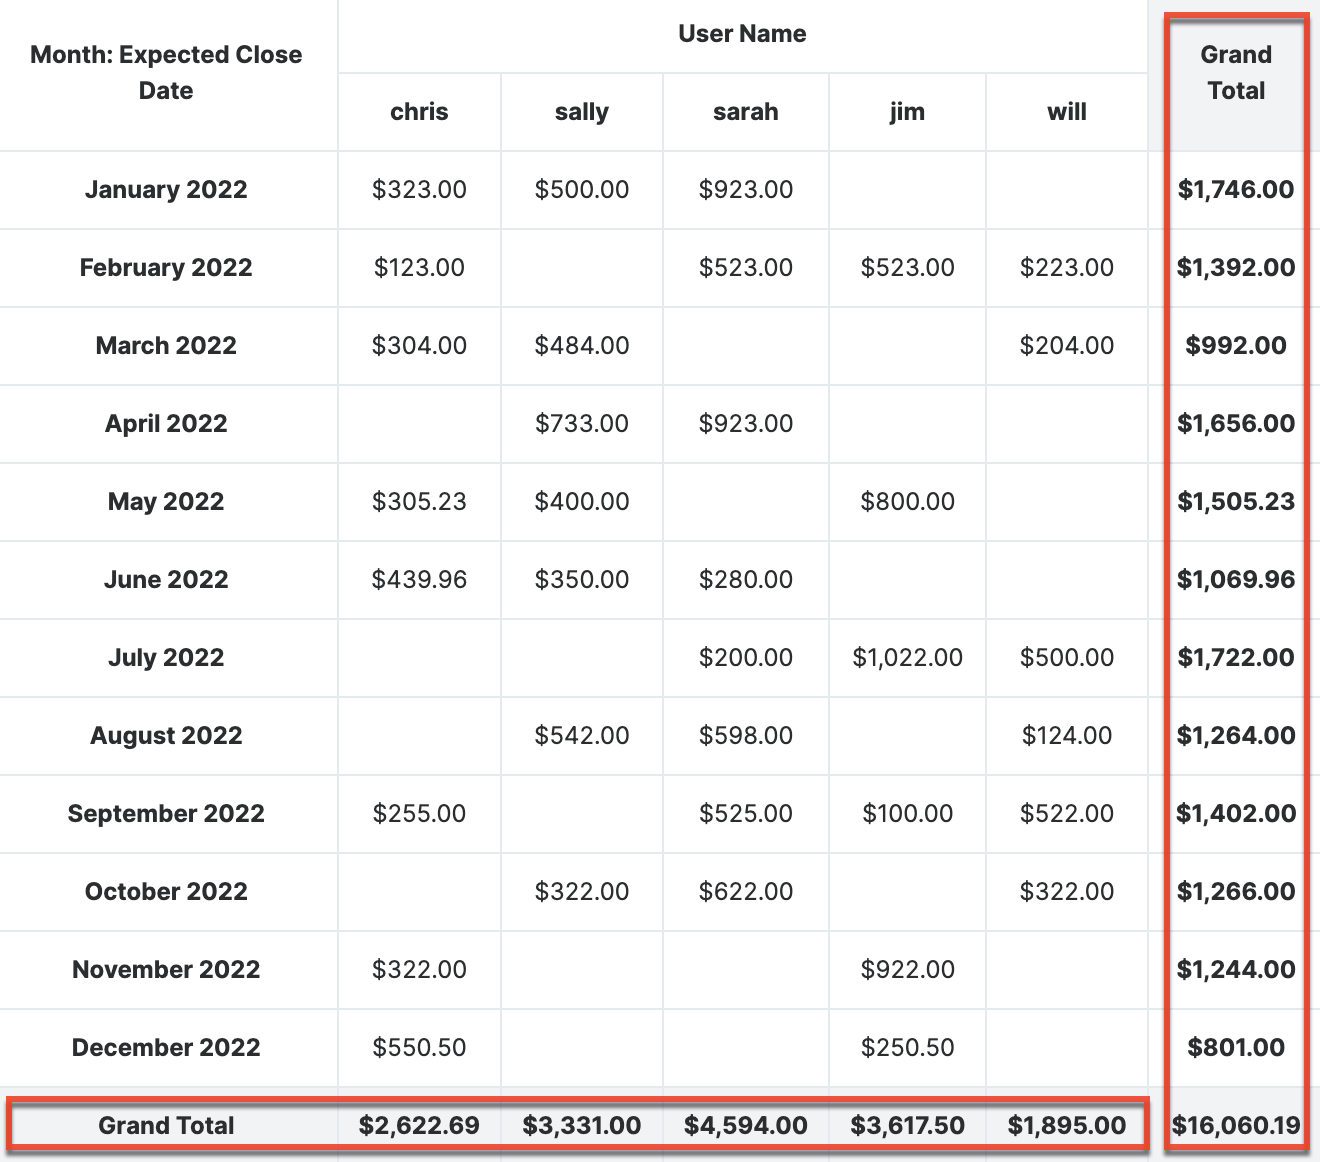
Viewing Currency Fields
When the viewing user's profile has the Show Preferred Currency option selected, all currency values will be displayed in reports using the user's preferred currency. The values will use the current conversion rate set in Admin > Currencies at the time the report is run or when the results are refreshed. This means that the displayed value may not be historically correct for closed business since the conversion rate of the user's preferred currency may have changed since the purchase was completed.
When the user does not have this option selected, reports will display all currency values in the system's default currency. To keep amounts historically accurate, the conversion rate will only update on currency fields when the business is still open and under the following scenarios:
- The record undergoes a save event (e.g., mass update, manual save) and the record's currency has a different conversion rate defined in Admin > Currencies than is currently saved.
- An administrator updates the currency exchange rate under Admin > Currencies. This will trigger a scheduled job that updates all records saved with that currency to the new rate.
For more information about currency exchange rates, please refer to the System documentation in the Administration Guide.
Viewing Large Reports
Tables with more than 30,000 cells are considered large reports in Sugar. Loading these report tables with full styling and functionality (e.g., focus drawers, links) decreases the performance of Sugar. To ensure that you have access to these tables without compromising your browser's responsiveness, if a report table has 30,000 to 100,000 cells, you will be presented with options to either load a simplified table (e.g., focus drawers removed) or download the data as a CSV file. For reports with more than 100,000 cells, you will be presented with only the option to download the CSV file. Alternatively, you may adjust the filters or the report to make your results set smaller.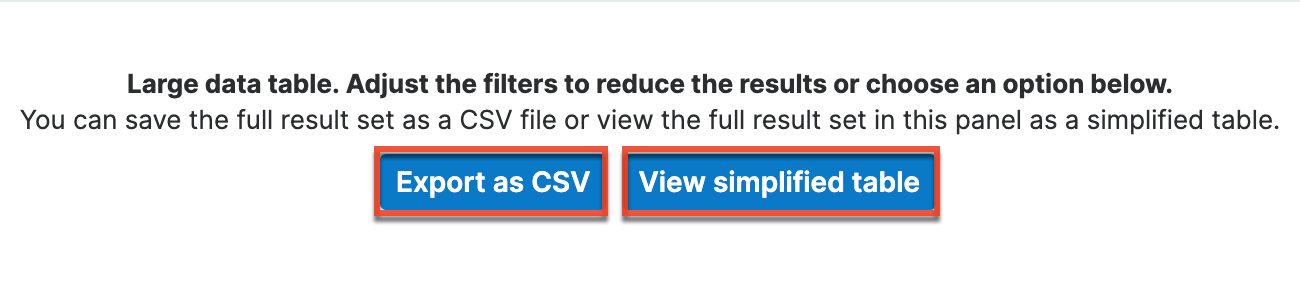
Refreshing Reports
Once the reports are generated and saved in Sugar, you can view the report results at any time. While viewing the report's results view, there may be times when you need to refresh the report to generate new report results. The Refresh button in the upper right of the report's results view allows you to refresh the report to re-generate report results. For example, if you make a change to the run-time filter on the report, you can click "Refresh" to generate the report based on the new filter values. For more information on run-time filters, please refer to the Run-Time Filters section. You can also click "Refresh" each time you want to re-generate the report to capture new records not included in the current report results.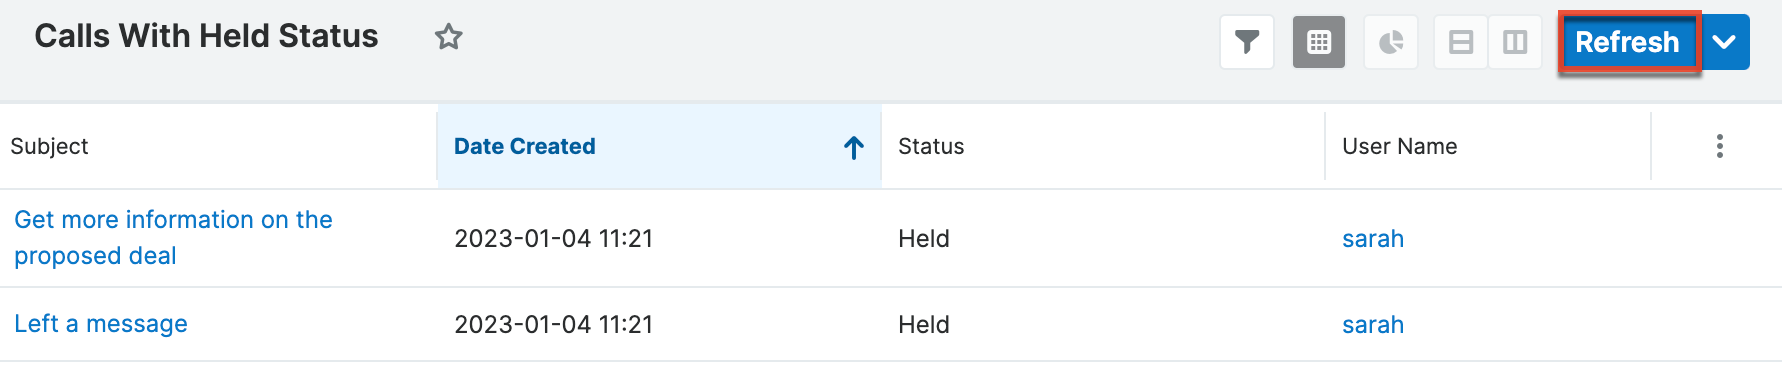
Editing Reports
Reports may be edited at any time to refine or adjust the report's details or criteria. There are various methods of editing the report from the report results view and Reports list view. Regardless of where you initiate the edit, you will always go through the Report Wizard to make the necessary changes to your report.
You can edit the report by going through the Report Wizard step-by-step using the Back and Next button or by clicking the step's link (e.g., Define Filters, Choose Display Columns, Choose Display Summaries) in the breadcrumbs at the top of the Report Wizard. When ready, click "Save and Run" to preserve the changes that you made and generate the report. If any users have created a scheduled report based on the edited report, the changes will automatically be reflected the next time they receive a copy of the report.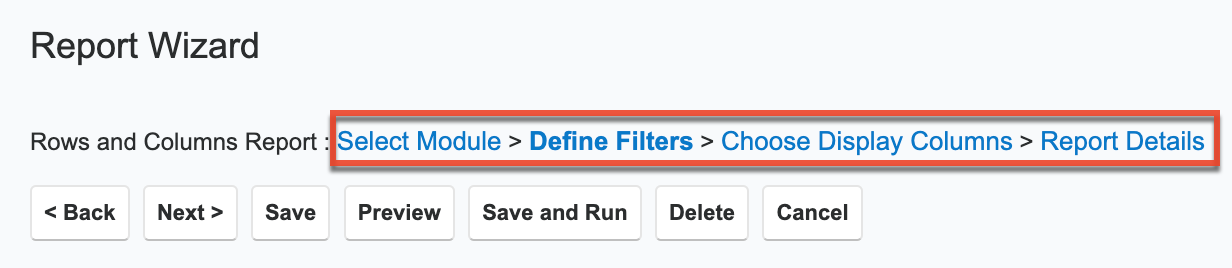
If the report is edited by someone else, the next time you reload the page or open the report, the system alerts you that the report has been modified since the last report refresh.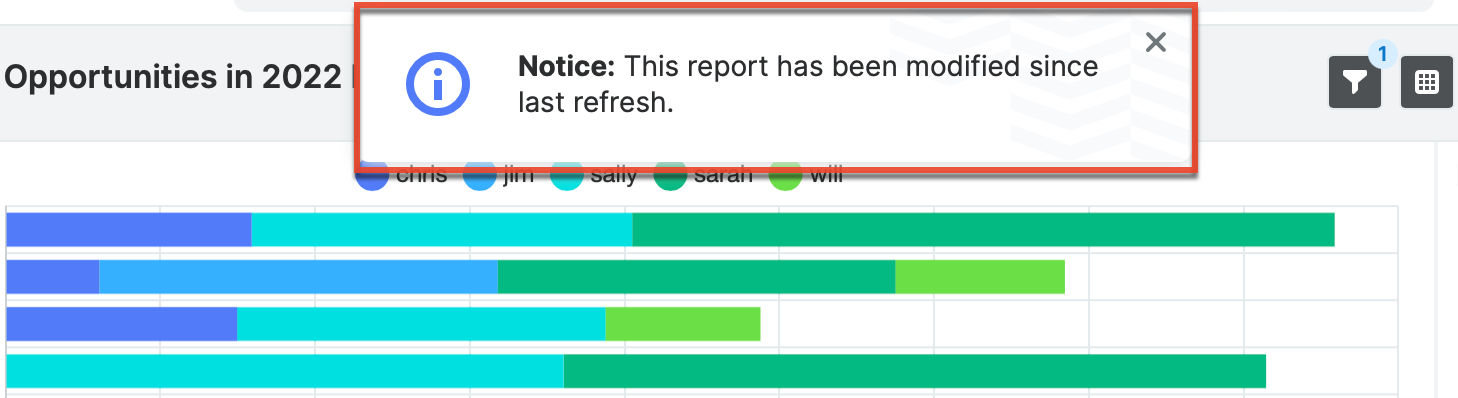
Please note that your ability to edit reports in Sugar may be restricted by a role. For more information on roles, please refer to the Role Management documentation in the Administration Guide. Check with your system administrator if you do not see the Edit options.
Editing via Results View
You can edit reports via the results view by clicking "Edit" in the Actions menu on the upper left of the page. This will open the Report Wizard where you can make the necessary updates to the various steps (e.g., Define Filters, Define Group By, Choose Display Columns, Choose Display Summaries). Once the changes are complete, click "Save and Run" to preserve the changes made and generate the report again.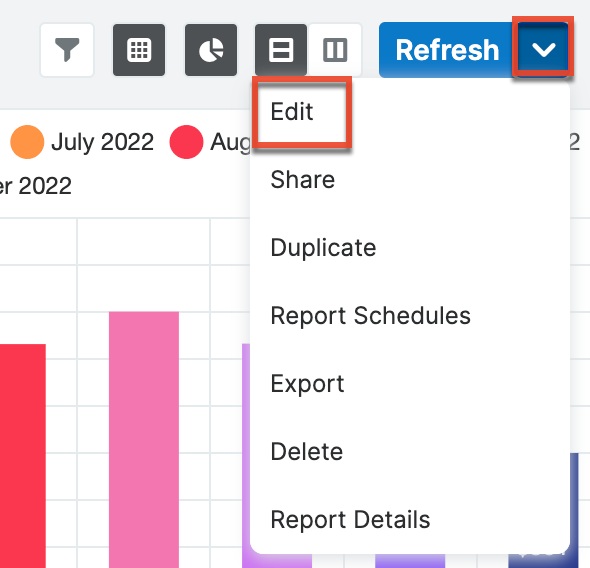
Deleting Reports
If a report is invalid or should no longer appear in your organization's Sugar instance, it may be deleted from either the report results view or list view. Deleting via the results view allows you to delete a single report while the list view allows for deleting one or more records at a time. Deleting a report from Sugar will also delete any report schedule records related to the report.
Please note that your ability to delete reports in Sugar may be restricted by a role. For more information on roles, please refer to the Role Management documentation in the Administration Guide. Check with your system administrator if you do not see the Delete options.
Deleting via Results View
Use the following steps to delete a report via the results view:
- Navigate to a report's results view.
- Select "Delete" from the Actions menu.
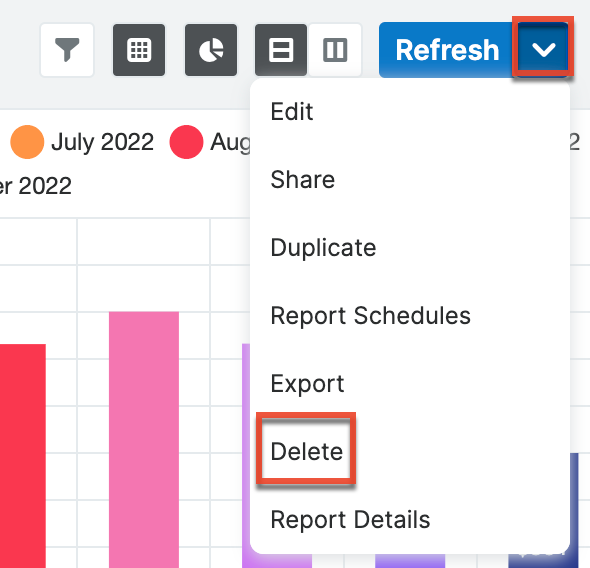
- A pop-up message will display asking for confirmation. Click "Ok" to proceed.
Exporting Reports
The Export option allows you to export a report's results as a CSV or PDF file. For more information on exporting records in Sugar, please refer to the Export documentation. Please note that your ability to export reports from Sugar may be restricted by a role. For more information on roles, please refer to the Role Management documentation in the Administration Guide. Check with your system administrator if you do not see the Export option.
Exporting via Results View
Use the following steps to export a report via the results view:
- Navigate to a report's results view.
- Select "Export" from the Actions menu.
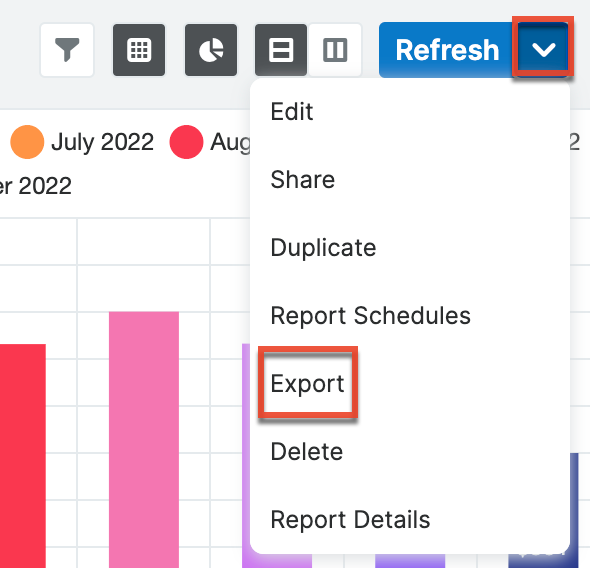
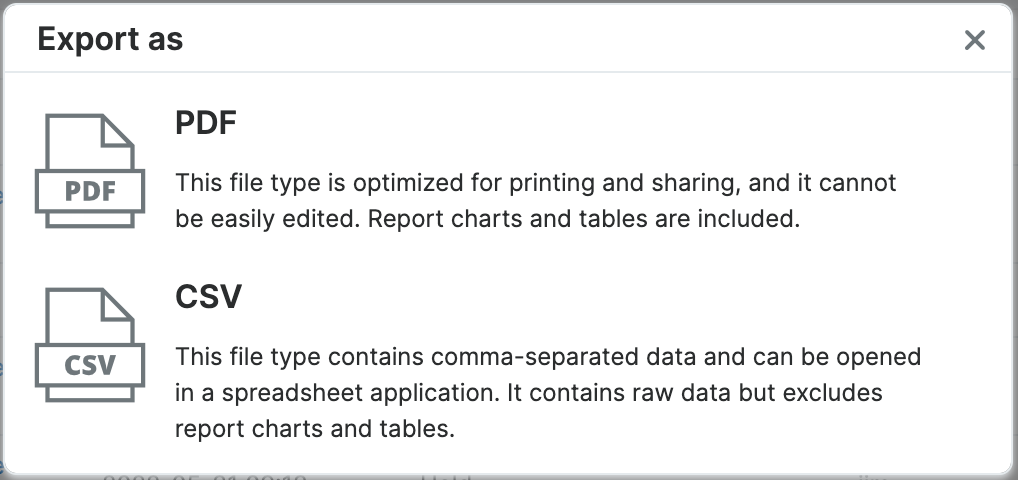
- In the Export As dialog that pops up, choose which format to export the results as.
Export As CSV
Exporting reports as a CSV is useful when you need to use Sugar data with other software such as Microsoft Excel. You can also use exported report results to update existing Sugar records by creating a report (including Record IDs), exporting, making changes, then importing the altered data back into Sugar. For more information on updating existing records via import, please refer to the Import documentation.
Note: Due to PHP memory limitations on the server, there may be occasions when the application times out while exporting a report with a large amount of data. If you encounter an error when performing this action, we recommend breaking up the report into smaller batches.
Export as PDF
Exporting as a PDF allows you to download the report as a PDF file to your local machine. This may be useful when you need to email the file to other members of the team to share the report data or to keep track of key historical data from the system. You can also view charts on the downloaded PDF files for Report types (e.g., Summation Report with Details, Summation Report, Matrix Report) with chart options.
Scheduling Reports
Users can schedule regular email deliveries of Sugar reports to themselves and other Sugar users via the Reports Schedule module. Scheduled reports will be delivered as PDF or CSV file attachments to the users' primary email addresses in Sugar. Reports that contain charts in Sugar will not have a chart in the CSV or PDF version of the scheduled report. When scheduling a report, you can choose the date and time to start sending reports and at what interval you wish to continue receiving them. If you choose to receive the report at a specified time of day, Sugar will output the report and email it to you at that time according to the time zone set in your user profile. If you are configuring the scheduled report for multiple users, then Sugar will convert the time of day to UTC so that each user receives the report simultaneously regardless of their time zones.
Note: Scheduled reports may arrive after the set time based on the cycle increment set by your administrator for the Run Report Generation Scheduled Tasks scheduler. For more information, please refer to the Report Schedule Requirements section.
Please note that your ability to schedule reports from Sugar may be restricted by your role settings. Check with your system administrator if you do not see the option to schedule a report. Furthermore, delivery to users added to a scheduled report may be prevented by teams or roles. For example, if you schedule a report for a user who does not have access to the report, then the restricted user will not receive the report. For more information on roles, please refer to the Role Management documentation in the Administration Guide.
Report Schedule Requirements
The Report Schedules module requires the following configurations:
- User email settings: A personal outgoing email account must be configured by the user scheduling a report. For more information on setting up individual email accounts, please refer to the Emails documentation in the Application Guide.
- System mail server: The outgoing mail server for the Sugar system must be configured by an administrator. For more information on setting up the system email settings, please refer to the Email documentation in the Administration Guide.
- Scheduler activation: The Run Report Generation Scheduled Tasks scheduler must be activated by an administrator (default is inactive) and configured to run at proper intervals. For example, if the scheduler is set to trigger once per day and a user schedules a report to be delivered every hour, the report will only be delivered once each day due to the interval set in the scheduler. The administrator must change the interval for the scheduler to run at least every hour for the user's report to be delivered hourly. For more information on configuring schedulers, please refer to the Schedulers section of the System documentation.
- Configure chart service in on-site instances: When using an scheduling reports in an on-site instance, you must take extra steps to allow access to the service used to generate the charts that are embedded in the email. Refer to the Configuring Scheduled Report Charts in On-Site Instances article for more information.
Report Schedule Fields
The Report Schedules module contains the following fields:
| Field | Description |
| Active | The enabled (Active = checked) or disabled (Active = unchecked) state of the scheduled report event. Note: Disabled report schedule records will not send emails. |
| Assigned to | The Sugar user assigned to the report schedule record. Note: The Assigned To user is not always the same user as the recipient of the scheduled report. |
| Created by | The Sugar user who created the report schedule record. |
| Date Created | The date and time that the report schedule record was created. |
| Date Modified | The date and time that the report schedule record was last modified. |
| Description | A description or other information about the scheduled report event. |
| Embed report in Email | The option to embed the report data table and chart in the email body. Note: Reports exceeding 200 rows will not be embedded, but will be attached as a CSV unless the report has no data. |
| File Type(s) | The format of the related Report that will be emailed. You can send the report as a PDF, CSV, or both a PDF and CSV. |
| Name | A unique and descriptive name for the scheduled report event. |
| Next Email Scheduled For | The date and time that the next report will be emailed to the recipient(s). |
| Repeat Type | The interval of time between recurrences. |
| Report | The related report that will be emailed as a PDF or CSV file attachment to the recipient(s). |
| Start Date | The date and time that the first report will be emailed as a PDF or CSV file attachment to the recipient(s). |
| Teams | The Sugar team(s) with access the scheduled report record (subject to role permissions). |
In addition to the Report Schedule fields, the Users subpanel under a report schedule record contains the following User module fields:
| Field | Description |
| Department | The department where the user works as saved in their user profile. |
| Full Name | The user's first and last name. |
| Status | The status of the user's record (e.g., Active or Inactive). |
| Title | The user's title as saved in their user profile. |
| User Name | The user's Sugar username. |
Please note that the Report Schedule fields and the fields in the Users subpanel cannot be edited via Studio.
Creating Report Schedules
Use the following steps to schedule an automated report for delivery to your email inbox:
- Navigate to the Reports module and create a new report schedule via one of the following methods:
- Click "Report Schedules" in the Actions menu on a report's results view, then click Create at the top of the list view:
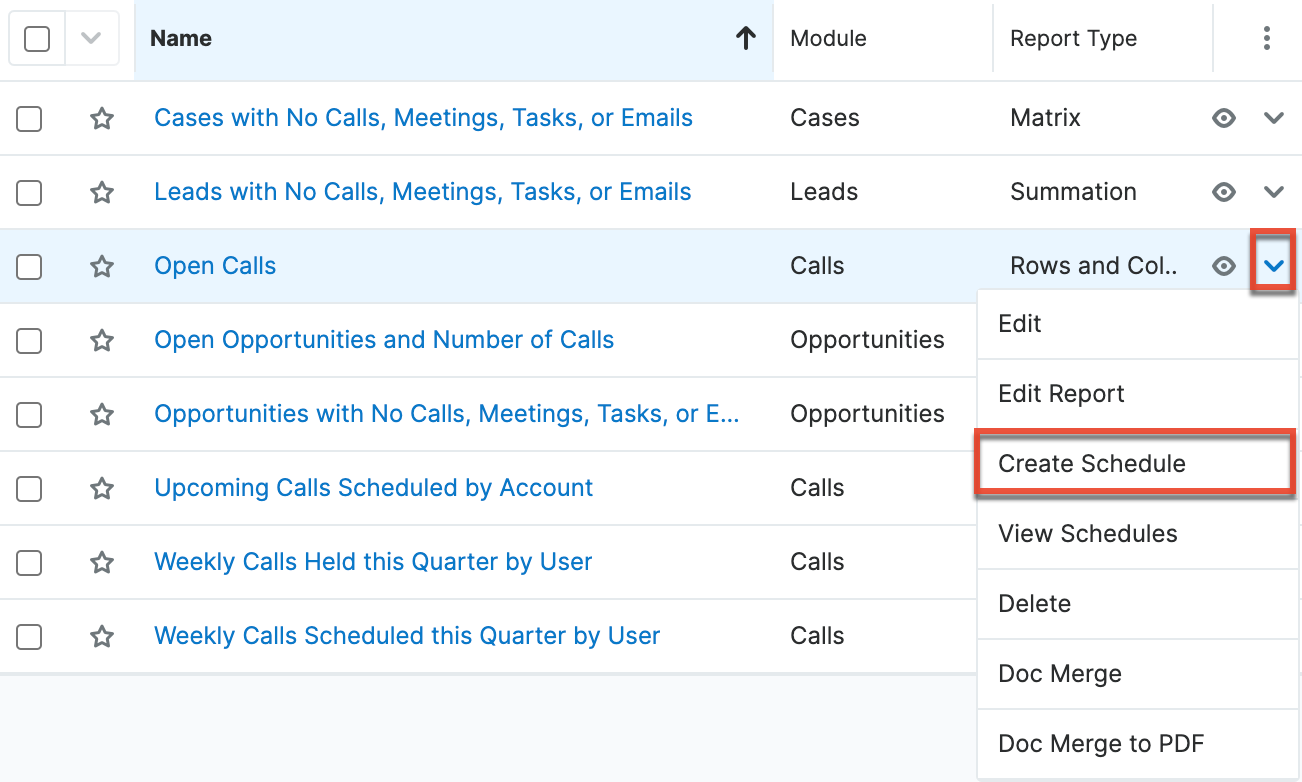
- The report's Actions menu in the Reports list view:
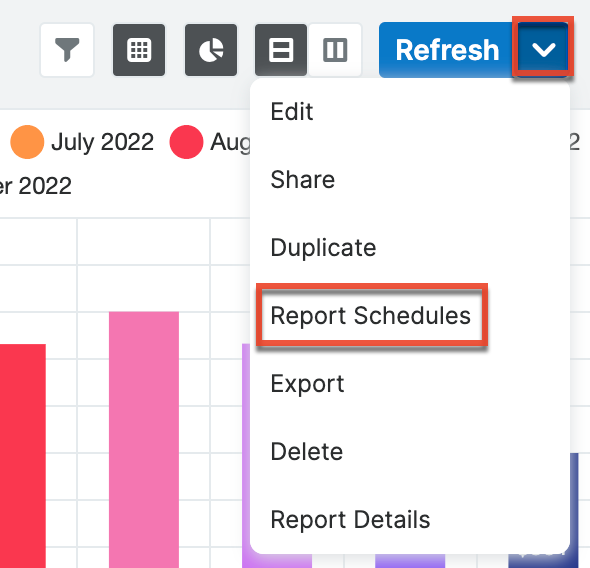
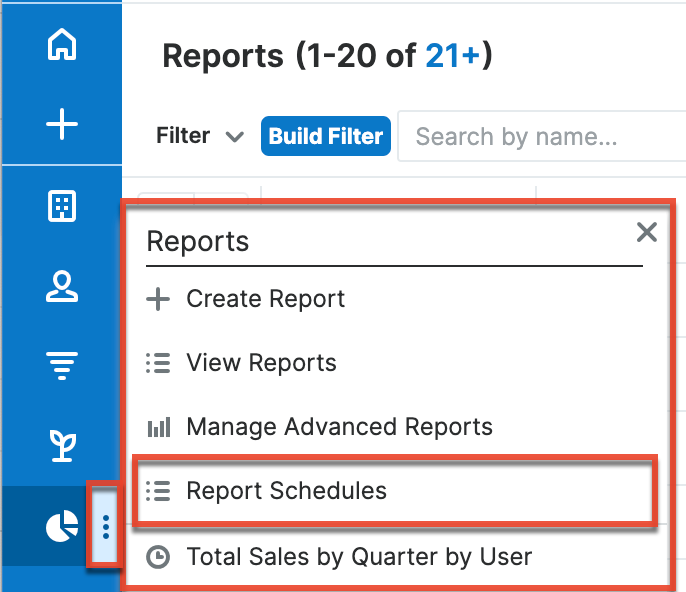
- Click the three-dots menu in the Reports module tab and select "Report Schedules". Then click the Create button at the top of the Report Schedules list view.
- Click "Report Schedules" in the Actions menu on a report's results view, then click Create at the top of the list view:
- If necessary, use the Search and Select functionality to choose a report in the Report field. This will only be necessary when scheduling a report via the Create button in the Report Schedules module. If you create a report with the other two methods, the report is automatically populated.
- Give the scheduled event a descriptive name that you can find later. For example, "Will's daily call list - 9am".
- Complete the Repeat Type and Start Date fields with the frequency of delivery and desired date and time to receive your first emailed report. Optionally, add a description. Choose whether to receive an attached PDF or CSV report, or whether to have the report embedded in the email body. For more information on the available fields, please refer to the Report Schedule Fields section.
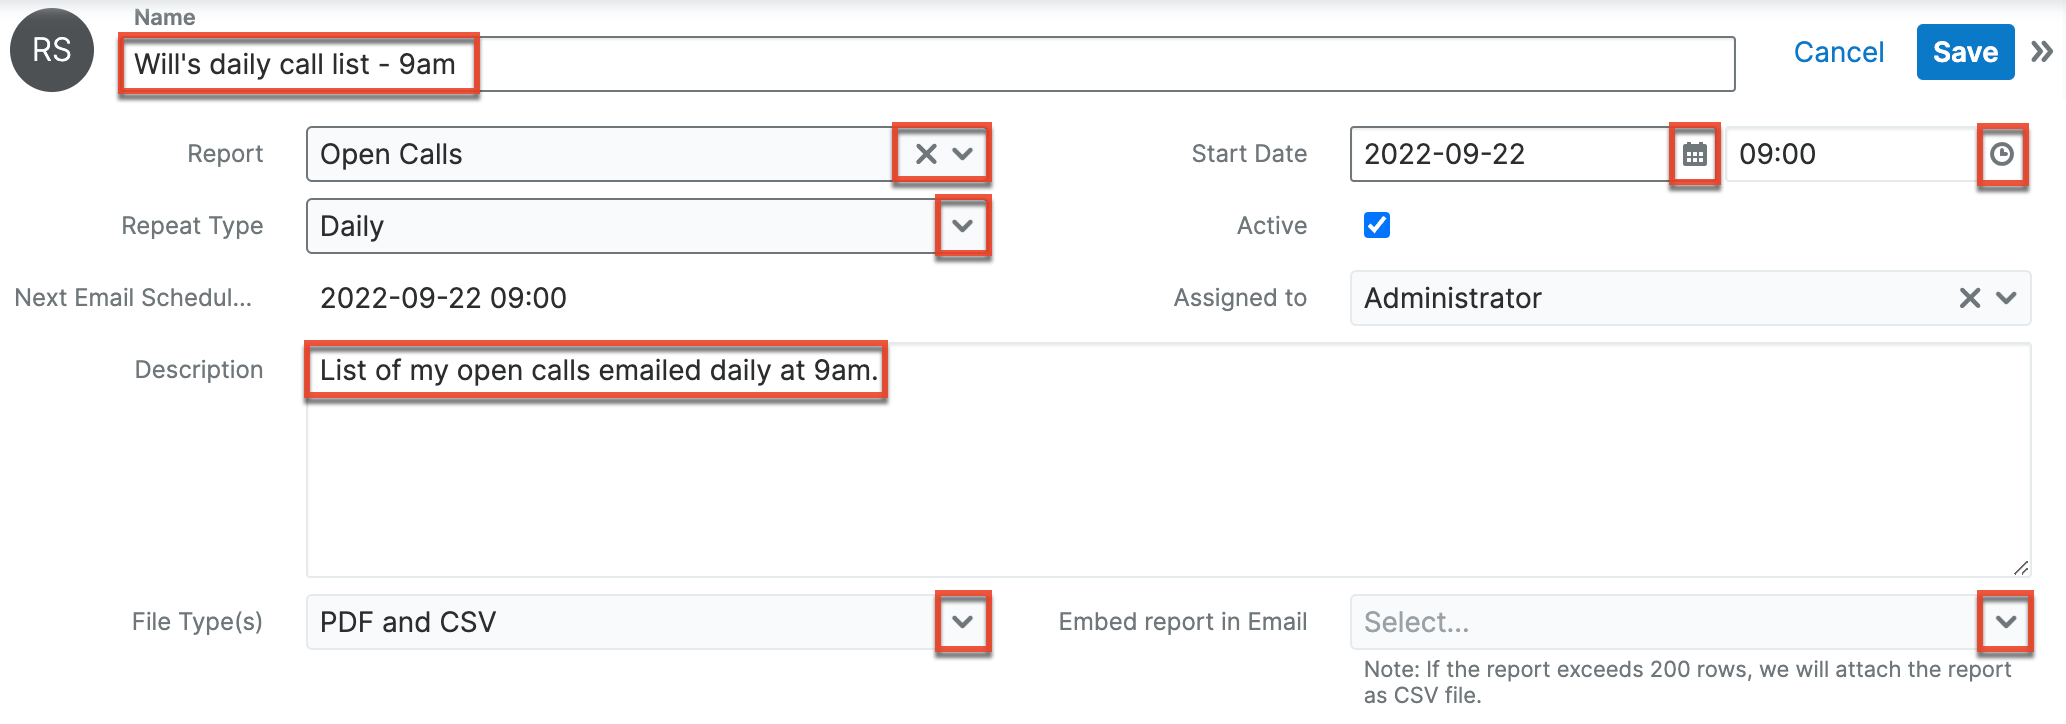
- Click "Save".
After saving, you can view the report schedule record to edit, disable (i.e., uncheck the "Active" checkbox), or delete the scheduled email as your role permits. If you would like to add more users to the distribution list for the scheduled report, please refer to the Adding Users to Report Schedules section.
Adding Users to Report Schedules
Use the following steps to schedule an automated report for delivery via email to other Sugar users:
- Follow the steps in the Creating Report Schedules section to create a scheduled report for yourself. If you do not want to receive this scheduled report, you still need to create the record for yourself but can unlink your user record in the following steps.
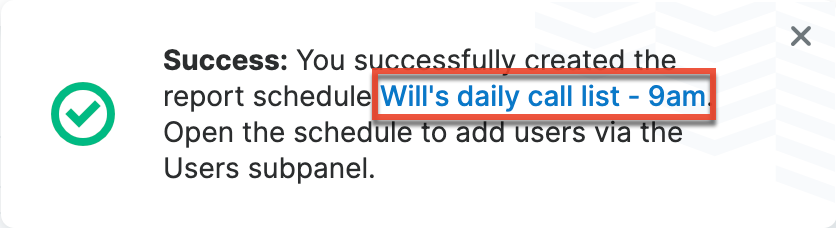
- Next, navigate back to the report schedule record by clicking the link in the confirmation message or using the View Schedules option on the related report record.
- On the report schedule's record view, scroll down to the Users subpanel.
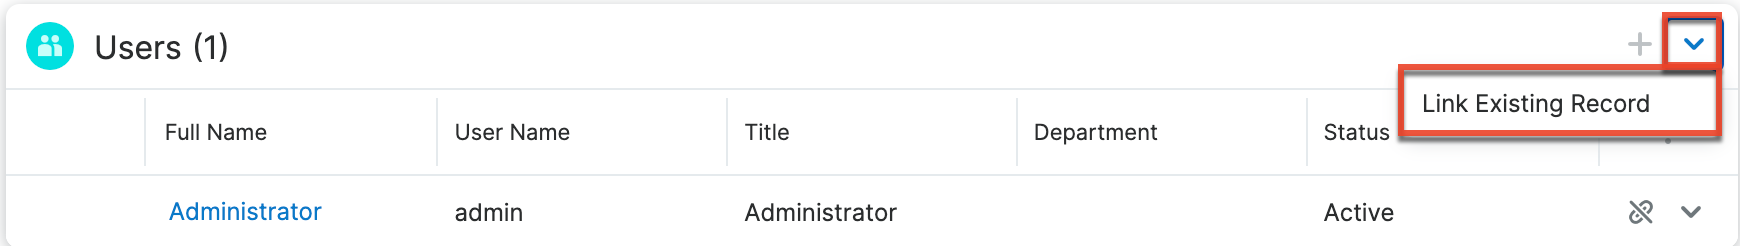
- Click on the subpanel's Actions menu and select "Link Existing Record".
- Find and select the user or users you would like to add to the scheduled report's distribution list and then click "Add".
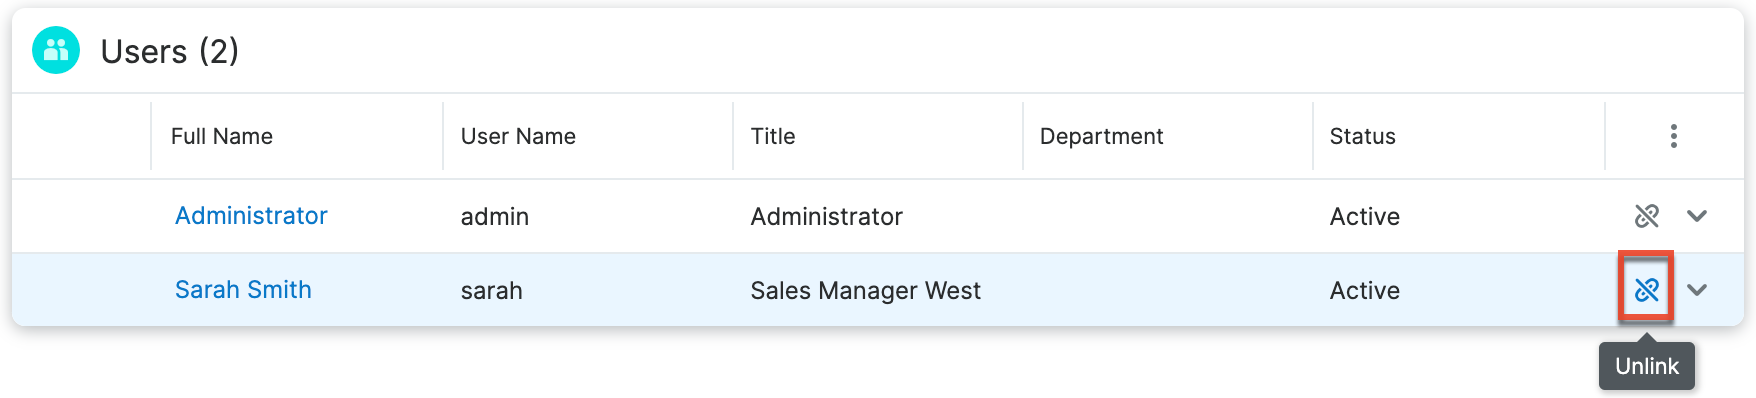
- To remove users from the distribution list, click the Unlink button next to the user's name in the Users subpanel for the report.
Copying Report Schedules
Users with the appropriate role permissions can schedule new reports via duplication, which will copy the entire user recipient list over to a new report schedule record. Simply select "Copy" from a report schedule record's actions menu. Give the copy a unique name, update the related report field and scheduled times as needed, and save. The related user recipients will copy over to the new report schedule record. 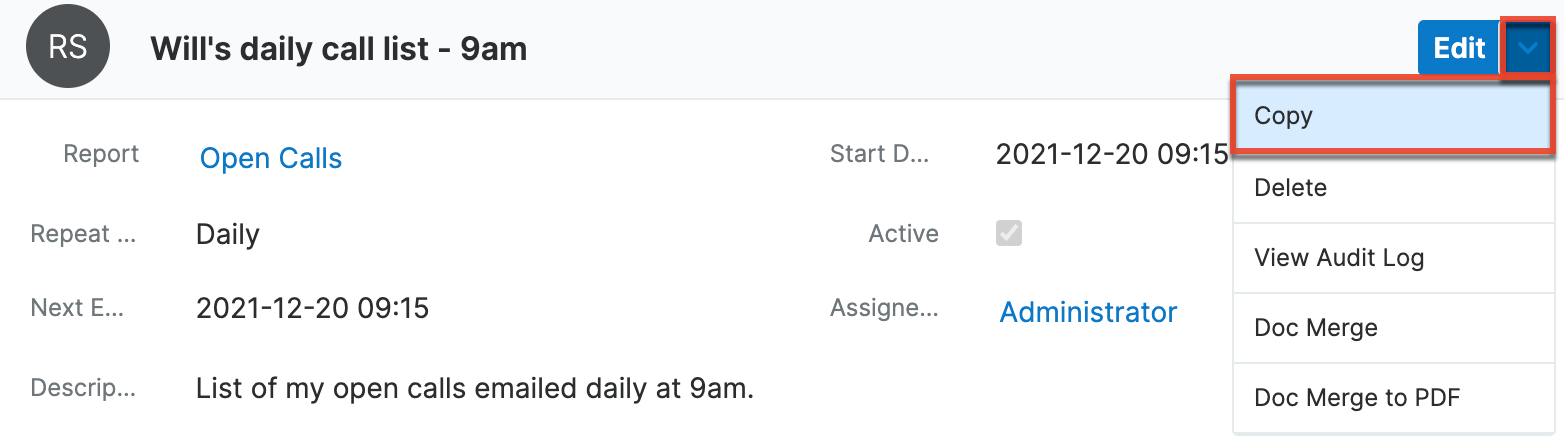
If needed, you can add more users to the distribution list or remove users by clicking the Unlink button next to a user's name in the Users subpanel.
Viewing Report Schedules
You can navigate directly to the Report Schedules module to access the Report Schedules list view. Click the three-dots menu in the Reports module tab on the navigation bar and select "Report Schedules". 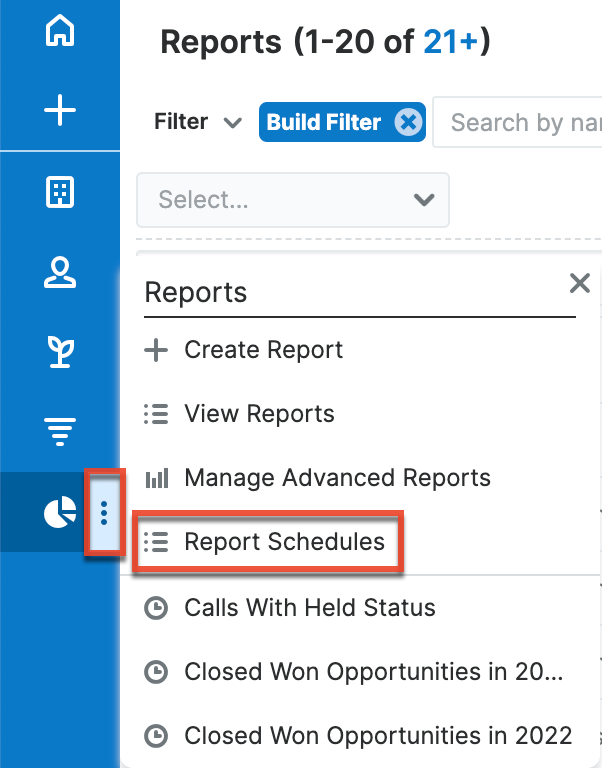
In addition, you can view only the scheduled reports related to a given report using the "View Schedules" option on the report's actions menu in list view or results view.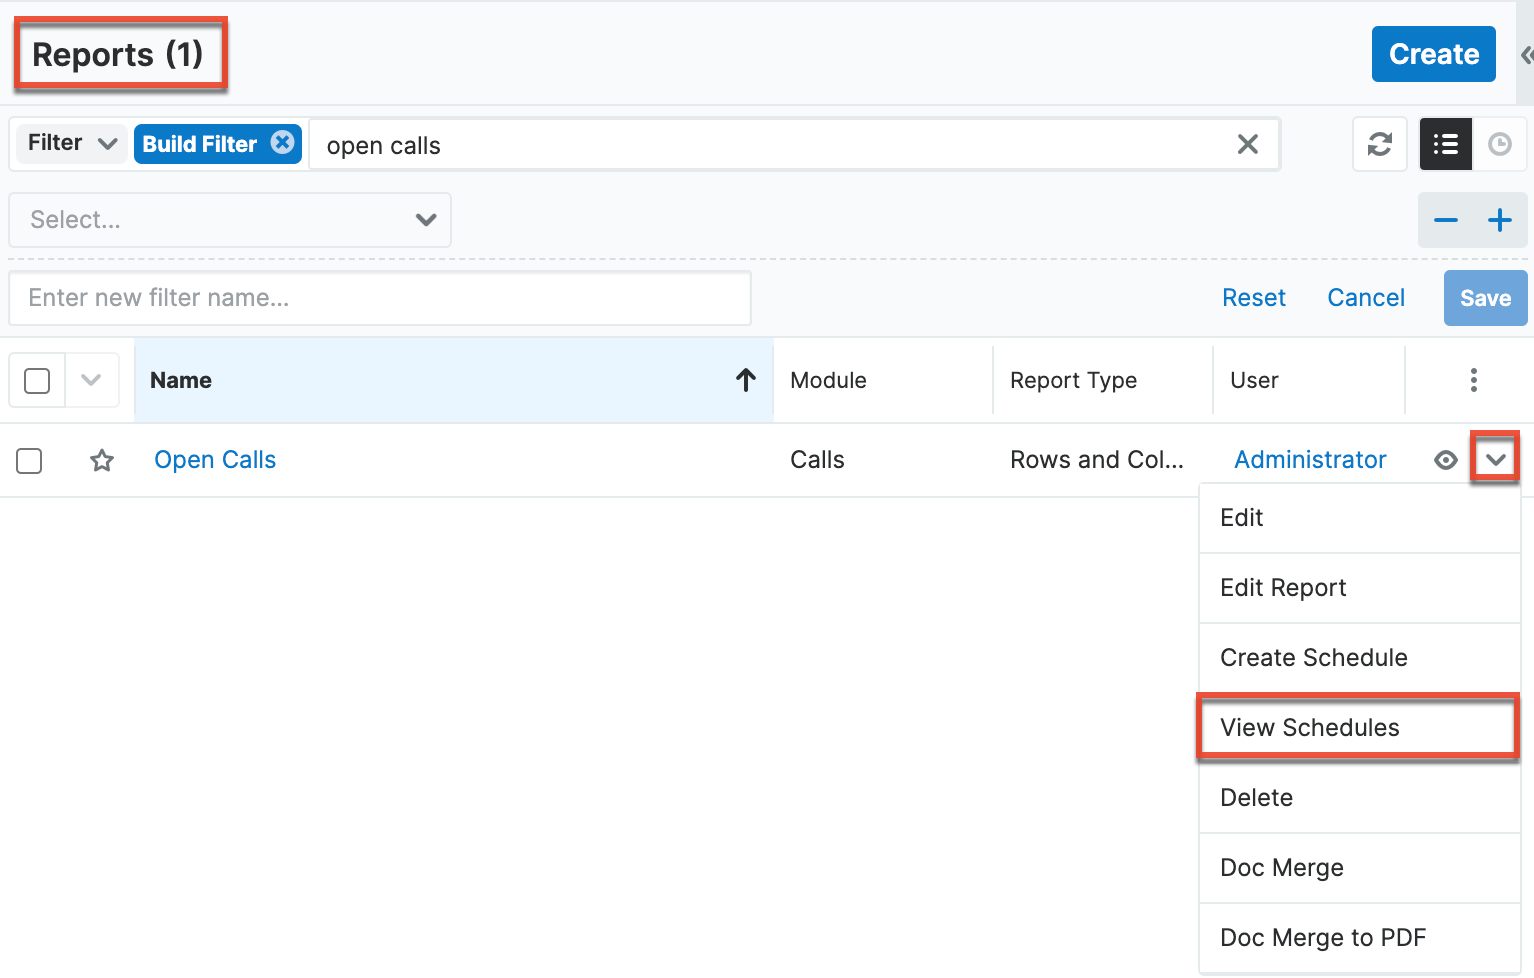
When using "View Schedules" from a report's actions menu, Sugar will automatically filter the Report Schedules list view to show only records related to that report. 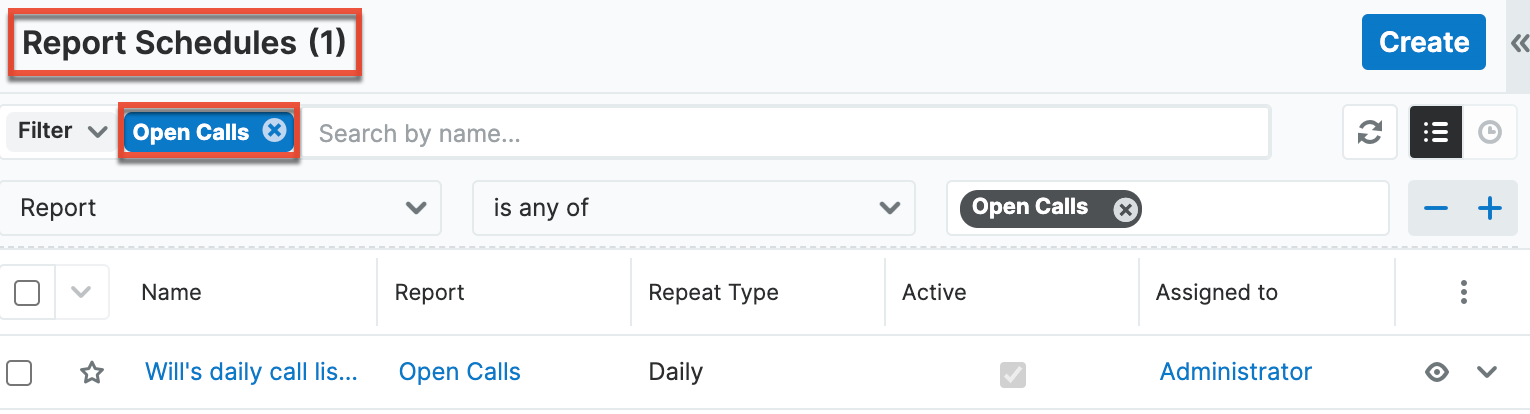
Click on the name of a record to view its details and edit or add users to the report schedule. To disable a report schedule, deselect its Active checkbox and save. For more information on working with list views and editing records in Sugar, please refer to the User Interface documentation.
Sharing Reports
Individual reports can be shared with other users in your organization by sending an email containing the record's link directly from the results view. In the report's results view, select "Share" from the Actions menu. This will open a Compose Email window that includes the URL of the report in Sugar. Enter the recipient(s) email address in the To field then click "Send".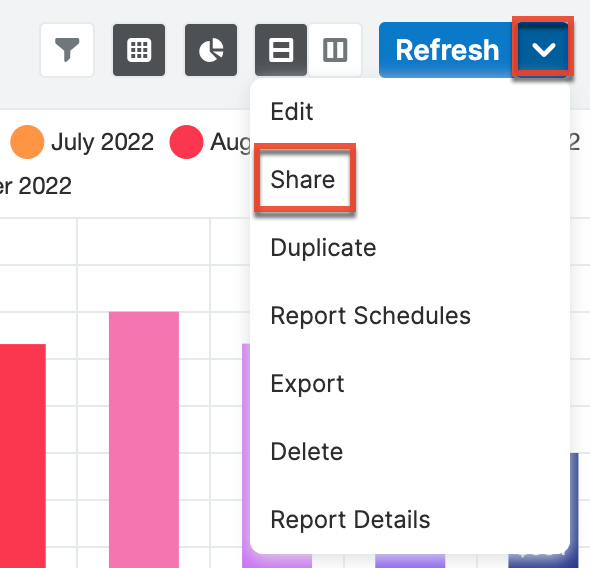
Users can simply click the link in the email to access the report in Sugar. Please note that the user must be logged in to Sugar in order to access the record, and its visibility will depend upon their team membership, user access type, and assigned roles. For more information on teams and roles, please refer to the Team Management and Role Management documentation in the Administration Guide.
Note: To send emails through Sugar, users must first configure a default user email account via Emails > Email Settings.
Adding Report Results to Target Lists
A target list consists of a group of individuals or organizations you wish to be included or excluded from a mass marketing campaign. These targets are typically identified based on a set of predetermined criteria such as being a prospect or existing customer, age group, industry, etc. The Reports module gives users the ability to add a large number of records (e.g., Contacts, Leads, Accounts) to a target list at once instead of selecting them one by one.
For example, if you need to add all leads in the state of California to a target list, you can create a report based on the Leads module filtered by the Primary Address State field (e.g., CA). After saving the report, navigate to the Target Lists module and select the desired target list record you wish to add the report results to. Scroll down to the Leads subpanel, click the Actions menu, and choose "Select from Reports". Select the saved lead report from the Search and Select Reports drawer and all lead records from the report will be added to the target list.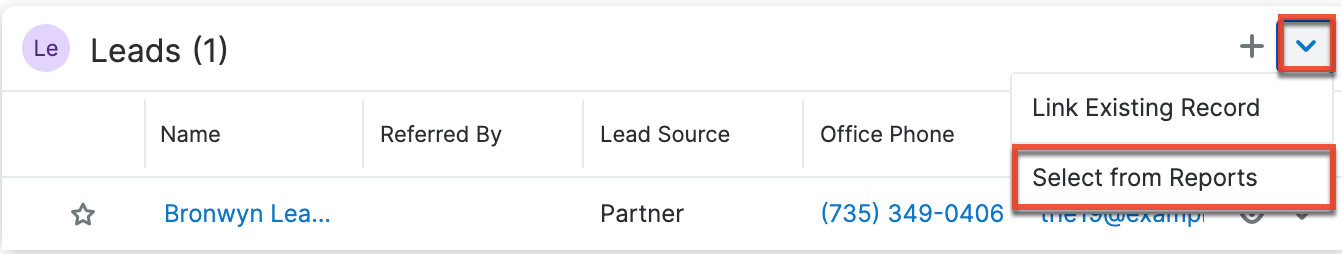
For more information on adding records to target lists, please refer to the Target Lists documentation. Please note that Sugar allows up to 1000 records to be added at a time when adding to a target list. If you desire to add more than 1000 records to a target list, you will need to create the reports in several batches.
Report Dashlet
Reports can be displayed on dashboards throughout Sugar via the Report Dashlet. The Report Dashlet allows you to view a chart and data table, interact with run-time filters, and drill through charts and tables to see the underlying data. If a Report Dashlet has run-time filters and is used on a Home dashboard, you can use dashboard filters to adjust the run-time filters on multiple dashlets at once. For more information on the Report Dashlet, please see the Sugar Dashlets documentation.
Working With Sugar Modules
The Reports module uses Sugar's Sidecar user interface. The following sections detail menus, views, and actions common to Sidecar modules and contain links to additional information within the page or links to the User Interface documentation.
Report Menus
The Reports module contains various options and functionality that are available via menus in the module tab, list view, and results view. The following sections present each menu and its options with links to more information about each option in the User Interface documentation or, for Reports-specific functionality, within this page.
Module Tab Menus
Click the Reports module tab in the navigation bar to access the Reports list view. You may also click the three-dots menu in the Reports module tab to display the Actions, Recently Viewed, and Favorites menus. The Actions menu allows you to perform important operations within the module. The Recently Viewed menu displays the list of reports you most recently viewed. The Favorites menu displays the list of reports you most recently marked as favorites. 
The module tab's Actions menu allows you to perform the following operations:
| Menu Item | Description |
| Create Report | Opens the Report Wizard for creating a new report. |
| View Reports | Opens the list view layout for searching and displaying reports. |
| Manage Advanced Reports | Opens the Advanced Reports tab for creating and viewing advanced reports. |
| Report Schedules | Opens the Report Schedules module for scheduling automated reports via email. |
For more information on module tab menus including reasons a module may not be included in the menu, see the User Interface documentation.
List View Menus
The Reports list view displays all report records and allows for searching and filtering to locate specific reports. You can view the basic details of each record within the field columns of the list view or click a report's name to open the results view. To access a module's list view, simply click the module's tab in the navigation bar.
List View Mass Actions Menu
The Mass Actions menu to the right of the checkbox option in the list header allows you to perform mass actions on all currently selected records. You can use the checkbox on each record's row to select individual report records or click the checkbox in the list header to select all records displayed in the current set of list view results. 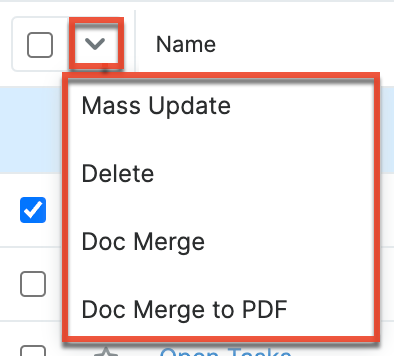
The Mass Actions menu allows you to perform the following operations:
| Menu Item | Description |
| Mass Update | Mass update one or more reports at a time. |
| Delete | Delete one or more reports at a time. |
| Doc Merge | Select or create a DOCX, XLSX, or PPTX template to merge record data into documents that will be accessible in the Doc Merge widget. |
| Doc Merge to PDF | Select or create a DOCX, XLSX, or PPTX template to merge record data into PDF documents that will be accessible in the Doc Merge widget. |
List View Record Actions Menu
The Record Actions menu to the far right of each record's row allows you to perform actions on the individual report directly from the list view. 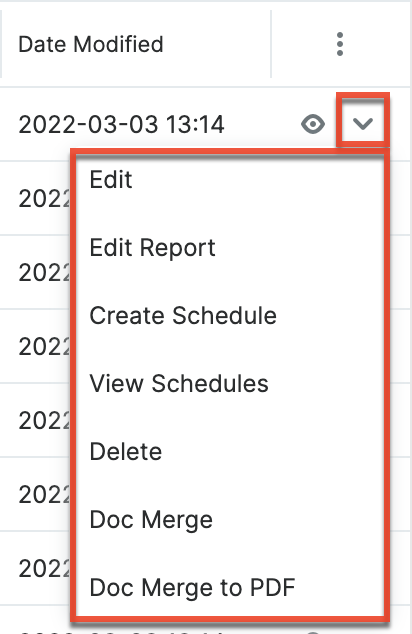
The list view's Record Actions menu allows you to perform the following operations:
| Menu Item | Description |
| Preview (eye icon) | Preview this report in the intelligence pane. |
| Edit | Inline edit this report. |
| Edit Report | Edit the report via the Report Wizard. |
| Create Schedule | Send a copy of this report to your email inbox on a recurring basis. |
| View Schedules | View any scheduled reports for this report in the Report Schedules list view. |
| Delete | Delete this report. |
| Doc Merge | Select or create a DOCX, XLSX, or PPTX template to merge record data into documents that will be accessible in the Doc Merge widget. |
| Doc Merge to PDF | Select or create a DOCX, XLSX, or PPTX template to merge record data into PDF documents that will be accessible in the Doc Merge widget. |
Results View Actions Menu
The report results view displays a single report in full detail including display column fields (if applicable), charts (if applicable), etc. To access a report's results view, simply click a hyperlinked report name from anywhere within Sugar. The Actions menu appears on the top right of each report's results view and allows you to perform various operations on the current report. 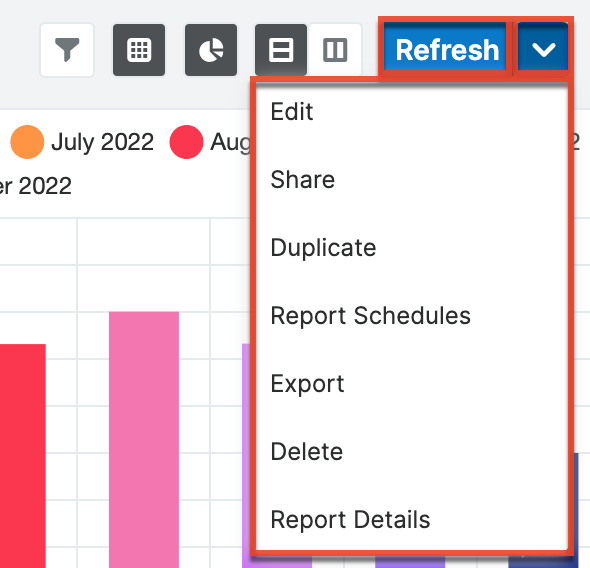
The Actions menu allows you to perform the following operations:
| Menu Item | Description |
| Refresh | Refresh this report to generate the result. |
| Edit | Edit this report. |
| Share | Share a link to this report via email. Note: To send emails through Sugar, users must first configure a default user email account via Emails > Email Settings. |
| Duplicate | Duplicate this report to create a new report. |
| Report Schedules | View any scheduled reports for this report in the Report Schedules list view, and create report schedules via the Create button at the top of the list view. |
| Export | Export this report's result to a CSV or PDF file. |
| Delete | Delete this report. |
| Report Details | View the report details for this report. |
Common Views and Actions
The following links will open specific sections of the User Interface documentation where you can read about views and actions that are common across most Sidecar modules.
| Content Link | Description |
| Viewing Records Viewing via List View Viewing via Recently Viewed Viewing via Dashlets Viewing Via Activity Streams Viewing via Preview |
The Viewing Records section describes the various methods of viewing report records, including via the Reports list view, the Recently Viewed menu in the Reports module tab, list view dashlets showing report information, and previewing reports in the right-hand side panel. |
| Searching for Records List View Search Creating a Filter |
The Searching for Records section provides an introduction to list view search, which searches and filters within the Reports module. Note: The Report module's Filter option also includes the following filters out-of-the-box:
For more information on report templates, please refer to the Report Templates documentation. |
| Records List View Total Record Count Create Button List View Search Checkbox Selection Mass Actions Menu Favorite Designation Column Reordering Column Resizing Column Sorting Column Selection Preview Record Actions Menu Pagination Intelligence Pane |
The List View section walks through the many elements of the Reports List View layout which contains a filterable list of all report records in Sugar. While the generic menu options are described in the User Interface sections linked to the left, the options specifically available in the Reports list view are described in the List View Mass Actions Menu and List View Record Actions Menu sections of this page. |
|
Editing Records |
The Editing Records section describes the various methods of editing existing report records, including inline via the Reports list view, via the List View preview, and via the Mass Update option on the list view. |
| Deleting Records Deleting via List View Mass Deleting via List View |
The Deleting Records section describes the various methods of deleting unwanted reports, including via an individual record's Actions menu on the Reports list view and the Mass Actions menu on the list view. |
|
Favoriting Records |
The Favoriting Records section describes marking reports as favorites via the Reports list view. Favoriting a report allows you to easily access it from list views, dashlets, or the Reports module tab. |