Troubleshooting Latency Using Traceroute
Overview
Traceroute is a commonly used network tool that helps identify bottlenecks in speed and connectivity when experiencing issues connecting to a website or server from a computer. Traceroute tracks the route packets taken from an IP network on their way to a given host. It utilizes the IP protocol's time to live (TTL) field and attempts to elicit an ICMP TIME_EXCEEDED response from each gateway along the path to the host. This article covers using traceroute to test latency issues when connecting to your Sugar® instance.
Steps to Complete
Occasionally, you may experience performance issues in Sugar and will need to run a traceroute to identify if any network issues exist. We will go over how to run traceroute on your machine for Windows and for Mac.
Windows
- Click the Start menu and type "cmd" in the search field.
Note: Right-click on "cmd" and select "Run as administrator".
- Enter
tracert example.sugarondemand.com > c:\tracert.txtwith "example.sugarondemand.com" replaced with your Sugar instance's URL and "c:\" replaced with a writable location on your local computer - The traceroute may take a few minutes to complete. Enter
exitto close the command window.
A file named tracert.txt with the traceroute information will be created and saved in your C: drive or other location that you specified. If you are working with Sugar support to troubleshoot a connection or performance issue, please provide this file to the support staff working on your case.
Mac
- Navigate to Applications > Utilities and select "Terminal".
- Enter
traceroute example.sugarondemand.com > ~/Desktop/tracert.txtwith "example.sugarondemand.com" replaced with your Sugar instance's URL and "~/Desktop/" replaced with a writable location on your local computer. - The traceroute may take a few minutes to complete. Enter
exitto close the command window.
A file named tracert.txt with the traceroute information will be created and saved on your desktop or other location that you specified. If you are working with Sugar support to troubleshoot a connection or performance issue, please provide this file to the support staff working your case.
Understanding Traceroute Results
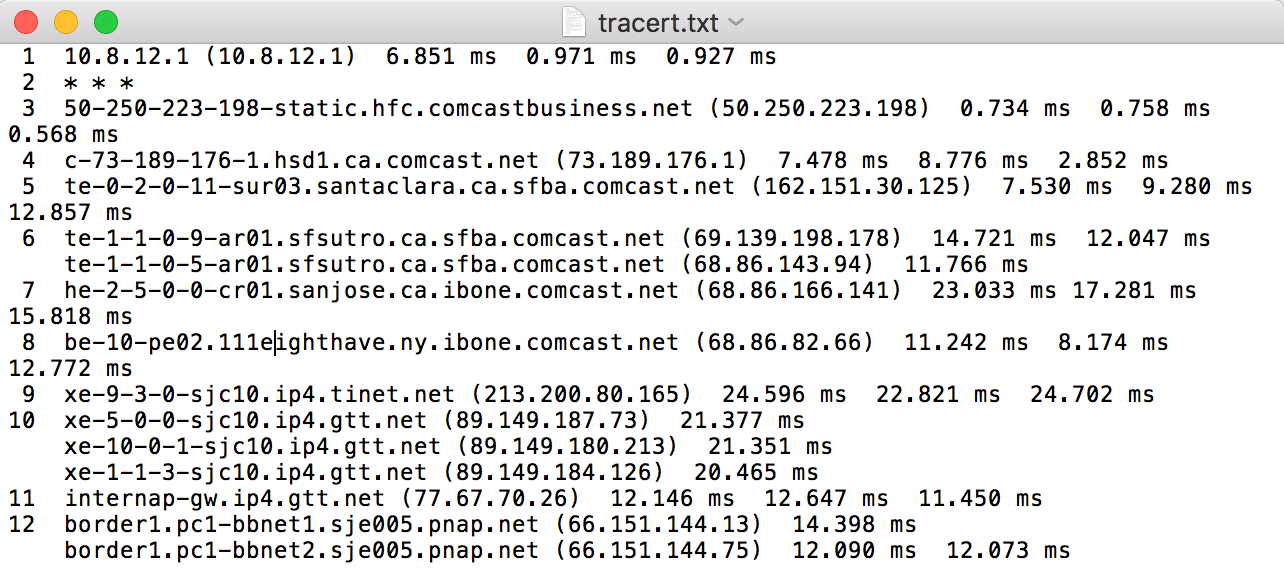
As mentioned in the section above, the results from the traceroute output will be displayed in a newly created tracert.txt file and look similar to the following: 
This section will break down these results in order to further help troubleshoot any latency or performance issues you may be experiencing.
The first line in the results represents your router, assuming you are behind a router. The following lines after that represent your internet service provider (ISP) and each router that is further along the path. You can easily discover who owns a specific IP address as well as where it is located geographically via ipinfo websites.
Once you know who owns the IP address, you can navigate to websites such as Downdetector in order to verify if there have been any reported issues with the provider. This information can help you pinpoint the source of latency when troubleshooting a connection or performance issue.
Each line in the tracert.txt file will include the following elements:
- Hop Number: Each time a packet moves between devices on its path between your server and the target address, this is referred to as a hop. The number of the hop is represented on the far left of the line.
- Note: The traceroute will attempt to find its way to the target IP address with a maximum of 64 hops. Please keep in mind that multiple hops will be required to reach the destination.

- Domain Name (IP Address) : For each hop along the path, the domain name, if available, and the IP address will be displayed to the right of the hop number. This information describes the location of the router. If the domain name is not available, then only the IP address of the router will be displayed.

- RTT1, RTT2, RTT3: This is the amount of time it takes, in milliseconds, for a packet to get to the hop and back to your computer. This is often referred to as latency and is the same number you see when using ping. Traceroute sends three packets to each hop and displays each elapsed time so you can measure how consistent or inconsistent the latency is at that time. If you see a "*" in some columns, it means that you did not receive a response, which could indicate packet loss.
