Reporting on User Activity
Overview
Sugar® keeps track of user activity so that administrators can spot trends and abnormalities in system usage or performance. Tracker reports can be used to monitor user actions and sessions as well as system performance and queries. Module-based activity reports can also provide insight into how users are engaging with Sugar. This article explains both tracker reports and activity reports as well as how to display them on a dashboard for easy viewing.
For additional information on usage and performance surveillance, please refer to these related articles:
- Capturing a Record's Last Activity Date Using Workflows
- Capturing Records' Activity Counts Using Calculated Fields
- Reporting on Records With No Activities
- Understanding Tracker Reports
Prerequisites
- Prior to being able to create tracker reports, an administrator must enable tracker settings via Admin > Trackers. Please note that, for reports that reflect a particular time period (e.g. last 30 days), tracker reports will only evaluate data back to the date and time that trackers were enabled, or up to the number of days the administrator has set to retain tracker data.
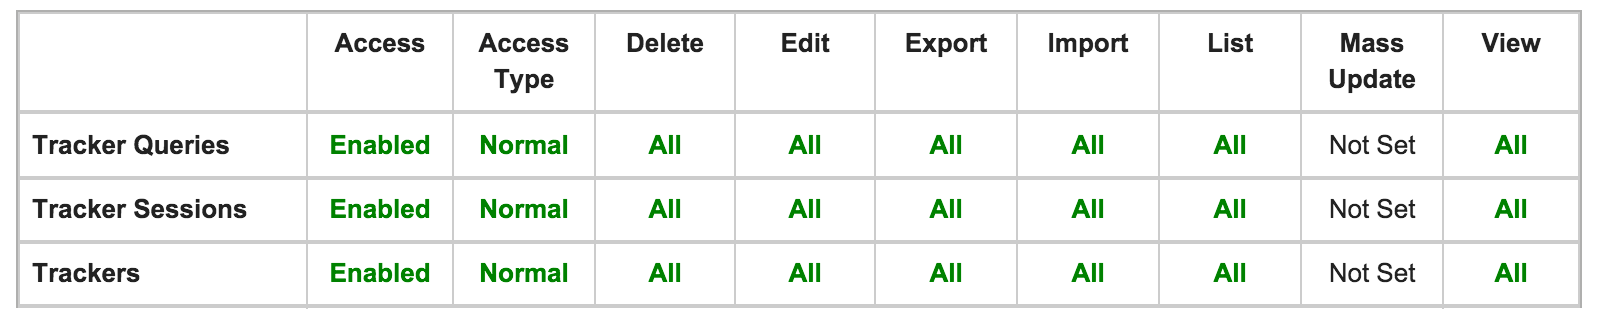
Note: It is not recommended to enable tracker settings if the resulting data is not being consistently used due to the potential performance impact of using trackers. - For a regular user to view and create tracker reports, they must be assigned to the Tracker role or a role with the tracker modules enabled, as shown in this role configuration:
Note: For more information on roles, please refer to the Role Management documentation.
Steps to Complete
The following sections cover the steps required for creating tracker reports and creating activity reports.
Creating Tracker Reports
Tracker reports provide up-to-the-minute information about user activity and system performance. Using tracker reports, you can see a user's page views, record saves, and session information in addition to monitoring system performance and slow queries.
There are four tracker modules available in Sugar: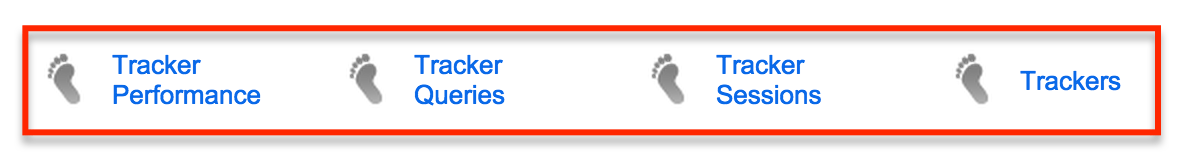
- Trackers Module: Counts behavioral events such as save actions and page views
- Tracker Sessions Module: Records session data for active users, such as the length of each logged-in session
- Tracker Performance Module: Collects server performance information such as the number of files accessed, server response times, and memory usage
- Tracker Queries Module: Logs database queries that exceed a time threshold specified by the administrator
There are several stock reports that already exist in Sugar for each of the tracker modules. In most cases, you should be able to find the information you need in one of these standard reports. For detailed information on tracker information available in reports as well as descriptions of the stock tracker reports, please refer to the Understanding Tracker Reports article.
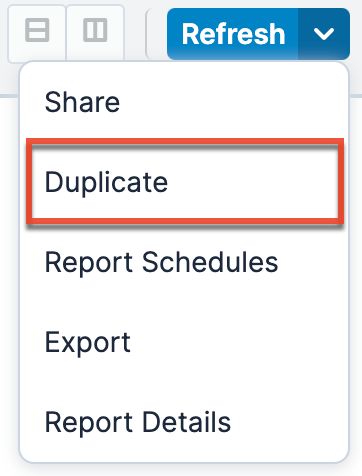
If you cannot find exactly what you need in the out-of-the-box tracker reports, you can create a new one by simply duplicating an existing report. The following steps cover creating a new report by duplicating an existing tracker report:
- In the Reports module, browse for and open a tracker report that contains data similar to the report you want to create.
- Expand the report's Actions menu, select "Duplicate", and choose a report type for the new report.
- Go through the Report Wizard to specify new filters, groupings, or displayed information as needed.
- Enter a new name for the report and save.
For more information on creating and editing reports, please refer to the Reports documentation.
Creating Activity Reports
Reports have the ability to show how many records were created for a specified time period, grouped by user and module. We will focus on the activity-type modules (Calls, Tasks, Meetings, Emails, Messages, and Notes) as a means of understanding how users are working within Sugar. Once the reports are created, a manager can add them to his or her dashboard for easy access.
The following sections cover creating a report for each activity type (e.g. calls and meetings), creating a new dashboard, and finally adding report charts to the dashboard.
Creating the Reports
Because it is not possible to summarize information from many modules in one report, you must create a separate summation report for each module (e.g. Calls and Meetings) that you wish to monitor. Summation reports include a chart option, which is required when displaying the reports on a dashboard. For this example, we will summarize the number of call records that each user created yesterday.
Note: Repeat these steps for the Tasks, Notes, and Meetings modules before moving to the next section.
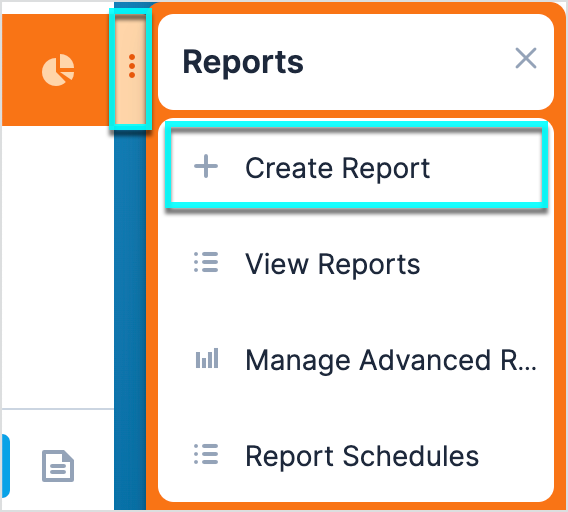
- Select "Create Report" in the Reports module tab's menu.
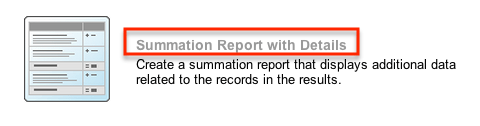
- Select "Summation Report with Details" as your desired report type.
- Select the Calls module.
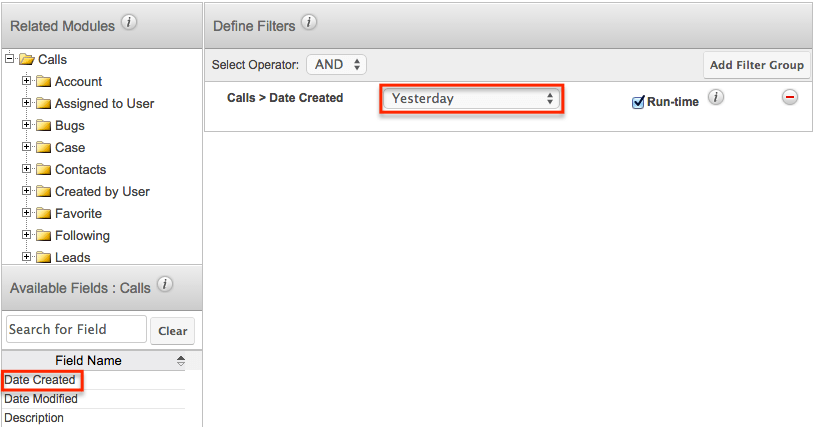
- Add a filter for calls created yesterday by selecting "Date Created" under the Available Fields panel, then selecting "Yesterday" in the dropdown that appears next to the Date Created filter. Click "Next".
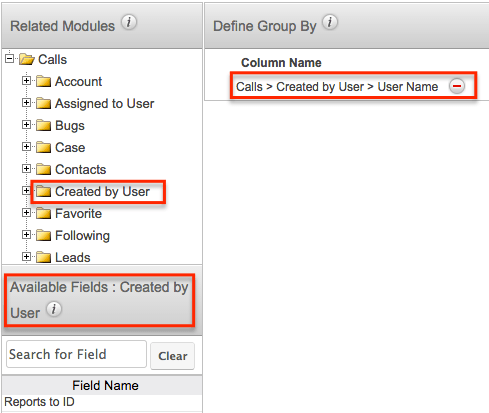
- Specify that the calls should be grouped by the user who created them by selecting "Created by User" in the Related Modules panel then clicking "User Name" in the Available Fields panel. Once the User Name field has been added, click next.
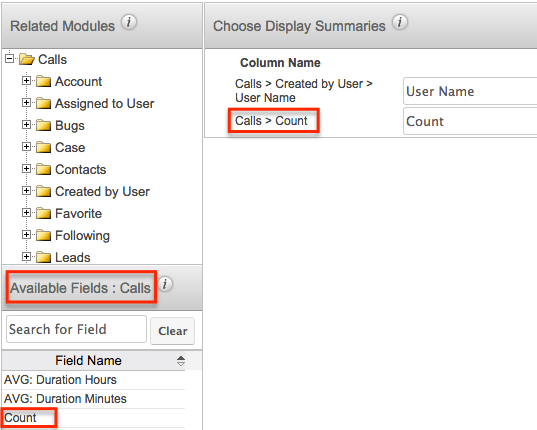
- Add the count of calls within each group to the display summaries by selecting "Count" under the Available Fields panel. Click "Next".
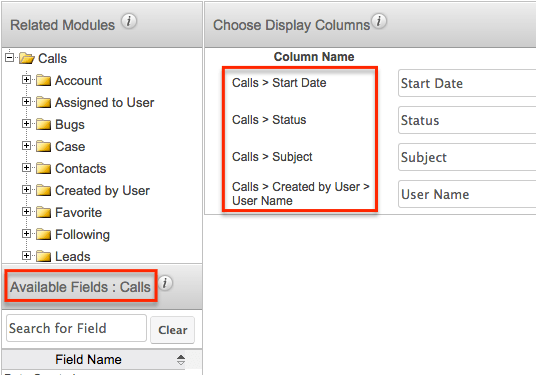
- Add the fields you wish to display in the report. For example, select "Start Date", "Status", and "Subject" from the Available Fields panel, then choose the "Created By User" related module and click "User Name" in the Available Fields" panel. Click "Next".
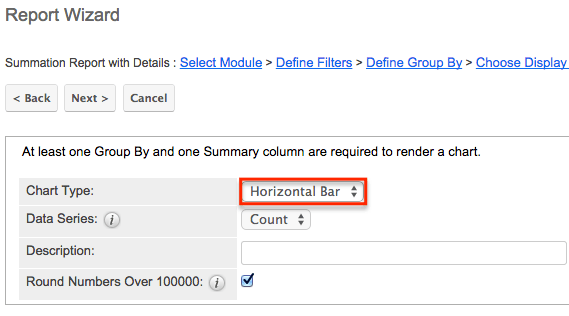
- In the Chart Type dropdown, select "Horizontal Bar" then click "Next".
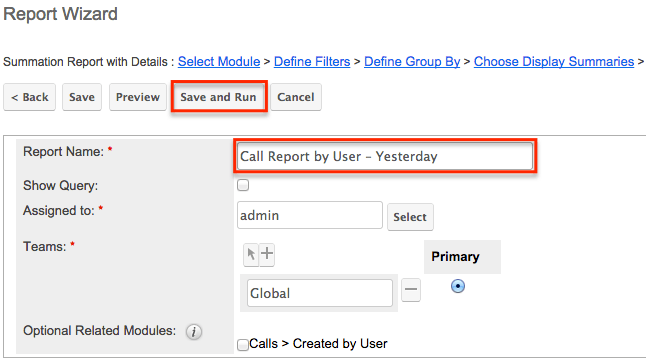
- Enter a name for the report such as "Call Report by User – Yesterday". Select "Save and Run".
You will now see a list of calls created yesterday along with a bar graph showing those calls grouped by the users who created them. For more information on creating reports, please refer to the Reports documentation.
Creating a New Dashboard
After creating the activity reports for each desired activity module (i.e., Calls, Meetings, Emails, Messages, Notes, and Tasks), use the following steps to create a new dashboard. Alternatively, you can skip this section and add the report dashlets to an existing dashboard.
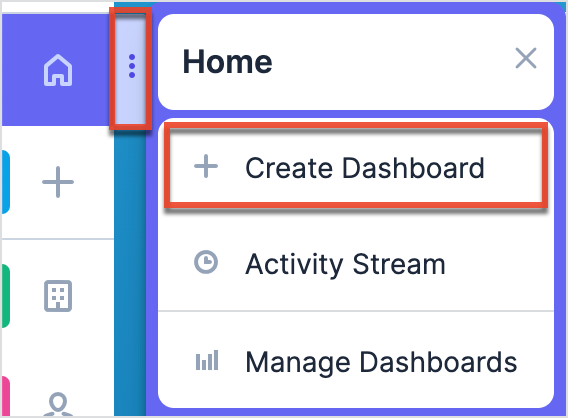
- Select "Create Dashboard" in the three-dots menu of the Home icon.
- Enter a name for the dashboard, for example, "Activity Dashboard". Click "Save".
You will now see an empty dashboard titled "Activity Dashboard".
Adding Charts to the Dashboard
Use the following steps to add the activity reports as dashlets to the new dashboard you just created or to an existing dashboard.
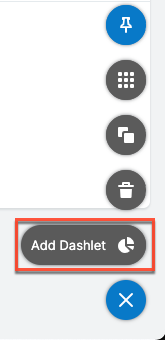
- Select "Add Dashlet" from the floating action buttons in the lower right-hand corner of the dashboard:
- Select "Report Dashlet" from the Add Dashlet page.
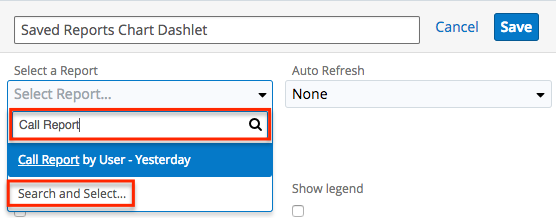
- Select your desired activity report (e.g. Call Report by User - Yesterday) via the Select a Report option. You can either type the first few characters of the report's name and select from the type-ahead results or click "Search and Select..." below the search box to select the report from the Search and Select Reports drawer. You can also use the various configuration options (e.g. Chart Type, Show total) available to define how the chart will display.
- Repeat steps one through three to add the other activity reports to the dashboard. You can drag the dashlets to any location you wish and make the dashlets the size you desire.
In each of your chart dashlets, or when viewing the original reports, the activity count per user, as well as the report's total value can be viewed, providing users and managers the ability to track user activities from the previous day. 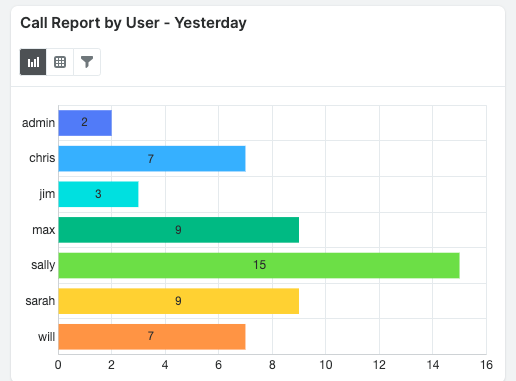
For more information on creating and configuring dashboards, please refer to the Dashboards and Dashlets documentation.