Example Matrix Report: Opportunities Won Per Month By Salesperson
Learn how to create a matrix report that displays the sum of opportunities that have a status of "Closed Won" grouped by month for each salesperson.
Overview
A matrix report is used to display a grid of summaries for grouped data, similar to a spreadsheet's pivot table. A matrix report does not include detail data. For more information about the different types of reports in Sugar®, please refer to the Reports documentation.
Use Case
This article will walk through creating a matrix report that displays the sum of opportunities that have a status of "Closed Won" grouped by month for each salesperson.
Beginning with version 9.1.0, each user's license type (e.g. Sugar Serve) determines what functionality is available as described in the License Types Matrix documentation. Please note that the Opportunities module used to create the example matrix report in this article is not available for Sugar Serve users.
Steps to Complete
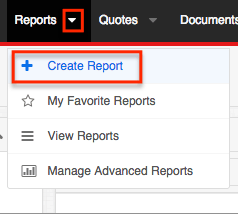
- Click the triangle to the right of the Reports module tab to display the Actions menu. Choose "Create Report".
- The first step of the report wizard will prompt you to select a report type. Choose "Matrix Report" and then select "Opportunities" as the target module.

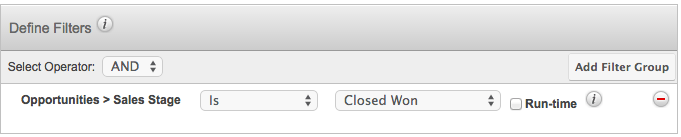
- Next, define the report's filter. In the Available Fields section, select the field "Sales Stage" and then set the filter to "Sales Stage is Closed Won".
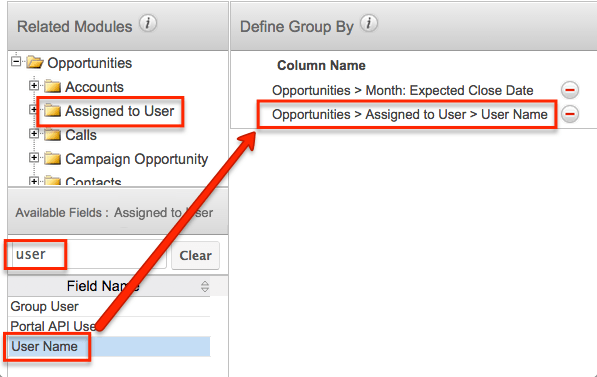
- Click the Next button to define the report's groupings. Group by the month closed and the assigned user:
- In the Available Fields section, select the field "Month: Expected Close Date".
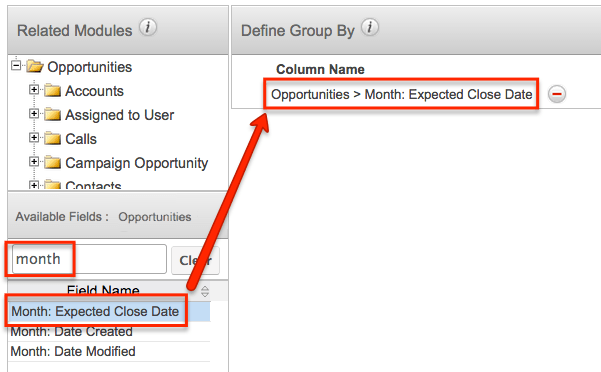
- Because an opportunity's assigned user is a relate field, find the folder named "Assigned to User" in the Related Modules section. Click on the words "Assigned to User" (not the folder icon) to update the Available Fields list below. In the Available Fields section, select "User Name".
Click the Next button to proceed to specify the display summaries. The first two display summaries should be automatically defined based on selections from the previous step. Add one more summary by selecting "SUM: Converted Amount" from the Available Fields pane. Click "Next" to proceed to the Chart Options step. Choose whether or not you would like to display a chart to illustrate the report results. This optional chart will be displayed in addition to the data matrix. Any chart type will render successfully for a matrix report, but a bar chart type is especially compatible with matrix data because it will segment each bar by the secondary group-by field selected in step 4. Select "No Chart" if you only want to display a data matrix. Click "Next" to complete the Report Details step. Insert a name for the report and select the Optional Related Module box next to "Opportunities > Assigned to User". This will ensure that opportunities that have no defined assigned user are included in this report. Click the Save and Run button.
Application
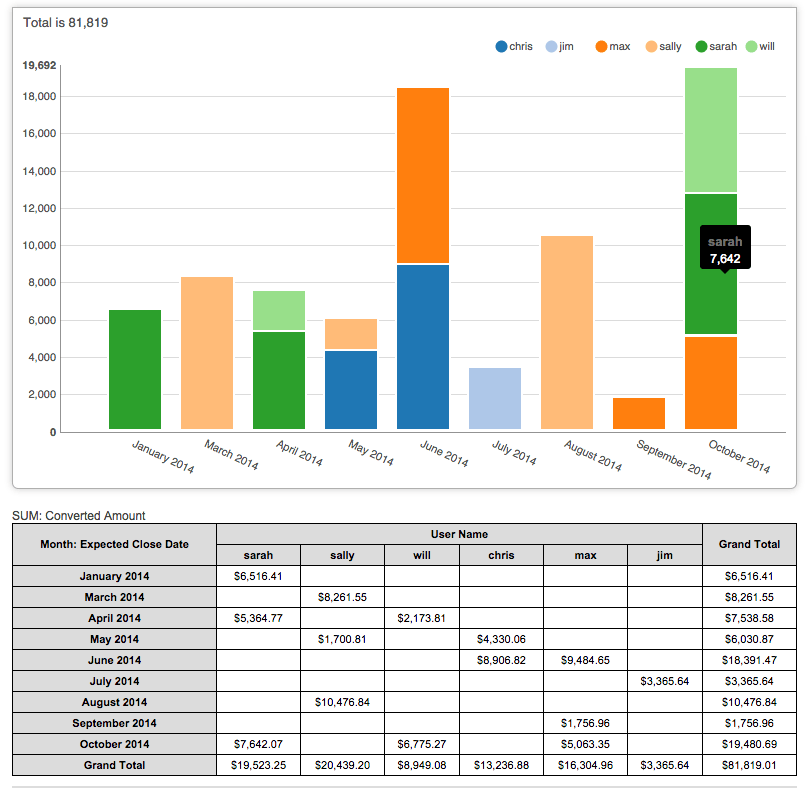
The results display the sum of won opportunities per month by salesperson as well as the grand totals per salesperson and the grand totals per month. The example report below includes an optional vertical bar chart (see step 6).