Service Insights Reports
Overview
The Service Insights reports are available to Sugar Serve customers. These reports can be displayed in the Sugar Discover dashlet and provide a way to monitor changes Cases module. The reports described on this page are the ones that come out of the box with Serve. Your organization may engage with your implementation partner or Sugar's Professional Services team to modify these reports to fit your needs.
Prerequisites
Service Insights reports are powered by Sugar Discover, a smart data discovery solution. These capabilities are available exclusively to Sugar Serve customers who are SugarIdentity-enabled and are leveraging the stock Cases module. Sugar instances must also be hosted on SugarCloud in one of the supported regions: the U.S.A., EU (Frankfurt, Germany), or Australia.
To use the out-of-the-box reports to their full potential, you must be using the following stock fields in the Cases module:
- Account Name
- Assigned To
- Business Hours to First Response (or Hours to First Response)
- Business Hours to Resolution (or Hours to Resolution)
- Date Created
- Escalated
- First Response Target Time
- First Response Actual Time
- First Response SLA Met
- ID
- Priority
- Resolved Date
- Status (displayed as Case Status in the reports below)
- Source
- Subject
For more information on which reports require which fields, see the Sugar Fields Used in Reports section. In the documentation, we refer to fields and options according to their stock names, e.g., First Response SLA Met field and High value in the Priority field. If you have altered the stock Sugar fields, your reports will need to be updated to use the new fields.
Snapshot Date
For improved tracking and reporting, it is often helpful to be able to see the state of your Sugar instance at a point in its history. You might wonder, for example, "At this point last month, how many open cases did I have?" This could then be used to compare to the present. For example, "Do we have more open cases now, and if so, why?". Discover helps you gather these types of insights by taking snapshots of your instance.
A snapshot is a picture of how your Sugar data looked at a given point in time. We refer to these points in time as the "snapshot date" below. Over the course of a day, changes in your Sugar instance will sync to Discover and therefore appear on your Service Insights reports typically within 5 minutes. You can refresh data manually by clicking the three-dots menu in the lower left corner of the Discover dashlet and clicking "Refresh Results". Snapshots are taken every day between 12:00 a.m. and 1:00 a.m. in your instance's time zone.
Discover Access Levels
By default, all regular Sugar user types are set to the "NoAccess" role for Discover (and thus cannot view Service Insights reports). All System Administrator Sugar users are set to the "Admin" role for Discover. The admin must set roles for regular users before they can view reports.
To assign user roles, the admin must log in to Discover and click on the profile icon in the top right corner, then select "Admin" to access the Manage Users page. Use the dropdown menu in the column on the right to adjust the role of each user.
The following Sugar Discover roles dictate the access level of the Service Insights reports and the Sugar Discover dashlet:
- NoAccess: Users with this role cannot view the Service Insights reports on a Sugar dashboard.
- Admin: Users with this role have the same abilities as a User, with the additional ability to edit default SugarCRM datasets and administer users.
- User: Users with this role can view public reports, build reports, and share new reports.
- ReadOnly: Users with this role have access to view public reports, share reports, and drill link through reports. These users see a simplified user interface that hides items to which they do not have access.
- DashletUser: Users with this role can view the Service Insights reports on a Sugar dashboard.
Note that Service Insights reports show the same data for everyone and do not change the report to hide records or fields that are controlled by Sugar roles and teams. Therefore, a user with access to view Service Insights reports will see all data from Sugar regardless of their Sugar role or team designations. You should not grant Discover access to a user who should not be able to see all case records in Sugar. Furthermore, if you have Enhanced Forecasting reports (available with Sell Premier), giving a user access to Discover also provides them access to the Enhanced Forecasting reports. Therefore those users will have access to see case and opportunity data.
For more information on user administration in Discover, refer to the User Administration documentation in the Sugar Discover User Guide.
Viewing Reports on a Dashboard
These reports can be placed on your Home, record view, and list view dashboards by adding a Sugar Discover dashlet to the appropriate dashboard. To add the Sugar dashlet, choose "Sugar Discover" from the Add Dashlet list and then select the appropriate report.
For more information on the Sugar Discover dashlet, refer to the Sugar Dashlets documentation.
Service Insights Reports
The following sections provide details about the reports that can be used to understand your service organization's metrics. Note that for many of these reports, the time period for the data in the report is user-chosen by a slicer. Various other slicers allow you to control precisely which data is included in each report.
Agent Leaderboard by Cases Closed
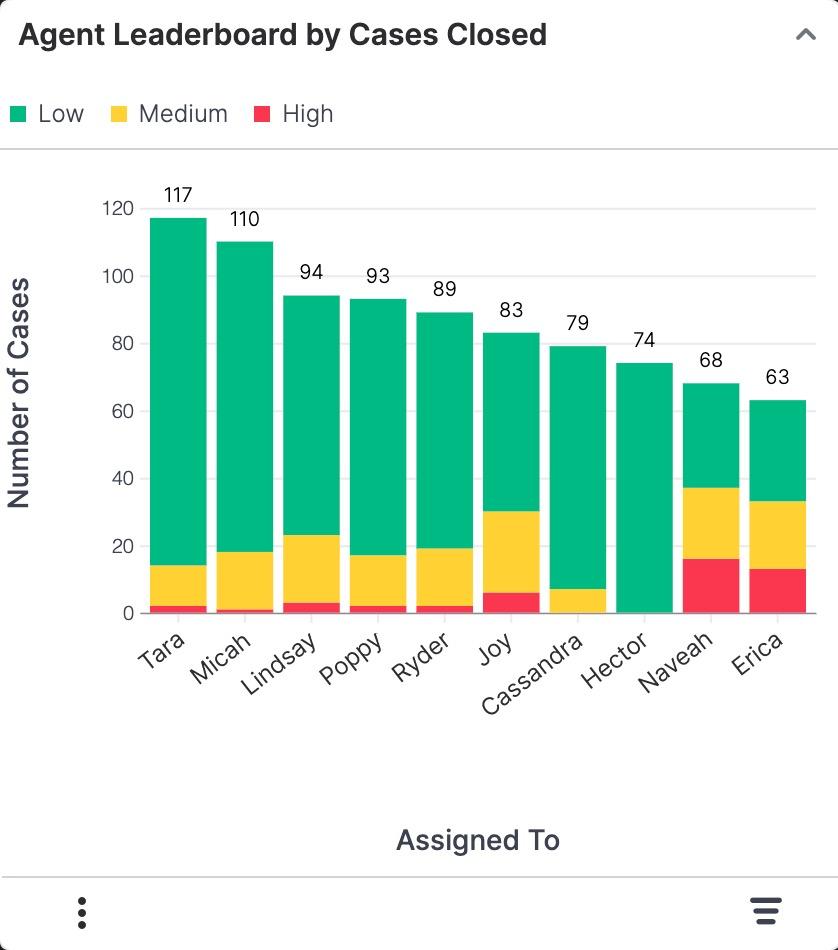
This report shows you the top 10 users who have the most cases closed in the chosen time. Each agent's cases are segmented into priorities so you can see the high performers.
Examples of insights that can be gained from this report include:
- Which agents are closing the most cases and have a high efficiency?
- Which agents are closing the most high-priority cases?
Average Handle Time
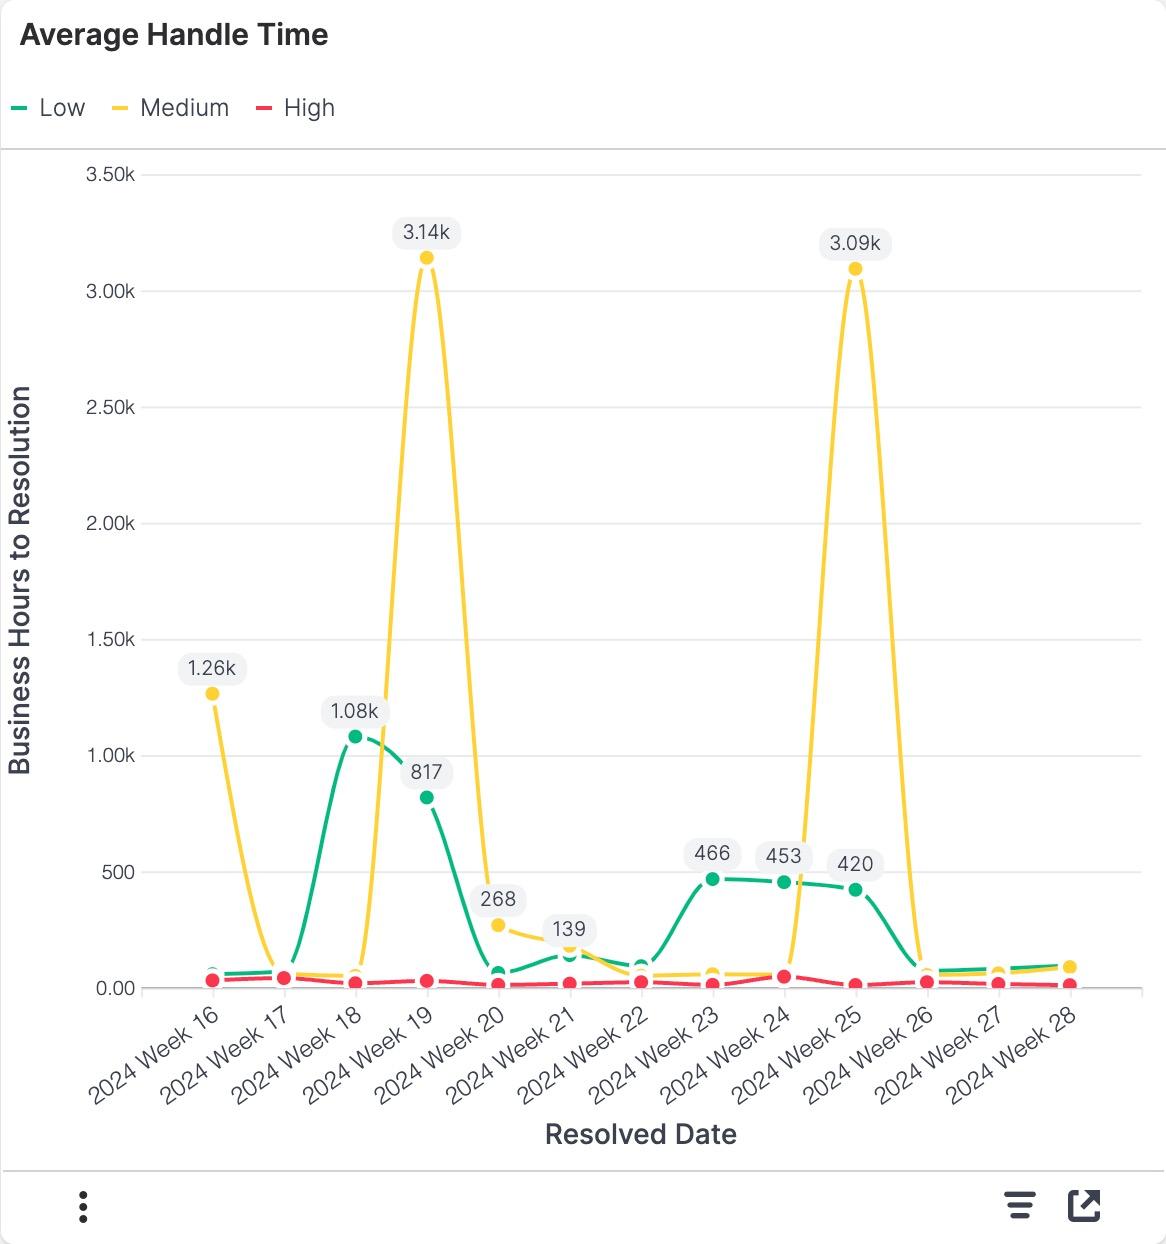
This report shows the trend of average handle time (i.e., Business Hours to Resolution field) for resolved cases in the chosen time broken down by priority, allowing you to track which cases are taking the most time.
Examples of insights that can be gained from this report include:
- How efficient and effective are agents in resolving cases?
- Are higher-priority cases resolved in a timely manner?
Average Time to First Response
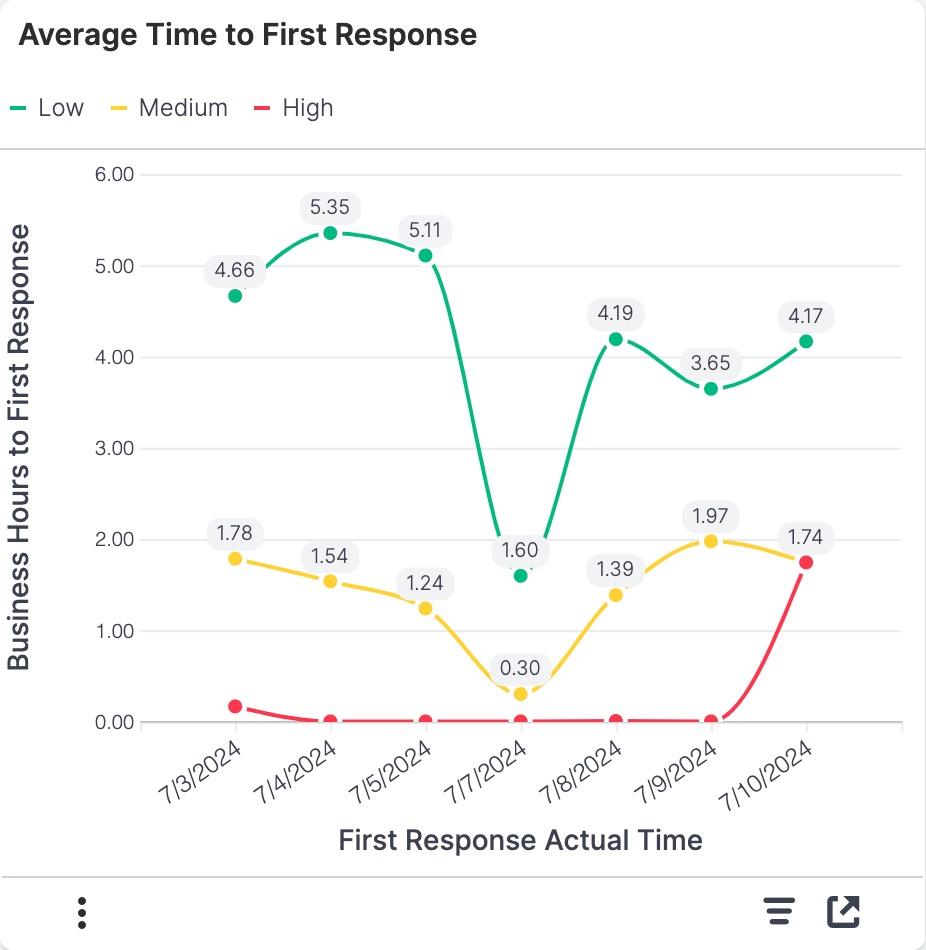
This report shows the trend for the average business hours until the customer gets a first response (i.e., Business Hours to First Response field) based on the date the first response was sent. The included dates are user-chosen with the slicer. Using this report can help support managers understand if the priority or day of the week affects the speed of first response.
Examples of insights that can be gained from this report include:
- How are response times trending over time?
- Does response time change based on the day of the week?
Case Aging (Open Cases)
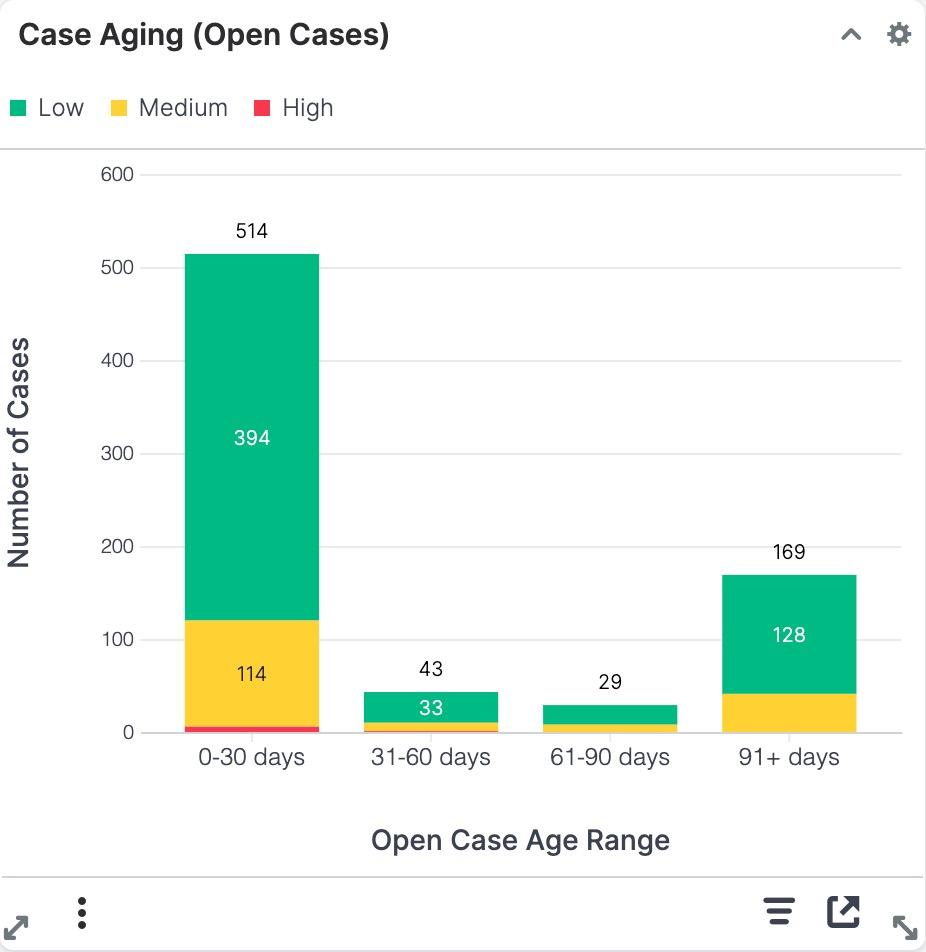
The Case Aging (Open Cases) report shows the number of cases that are currently in an open state (i.e., not Closed, Rejected, or Duplicate) that have been open for each time range. Each column is segmented by priority so you can see how case age relates to priority so that support managers can prioritize and allocate resources effectively to address the most critical and aging cases first.
|
Open Case Age Definition The case age is defined as the number of days between the cases's Date Created and the day you are viewing the report. |
Examples of insights that can be gained from this report include:
- What are the ages of the open cases in the system?
- Are high-priority cases aging?
Case Aging (Resolved Cases)
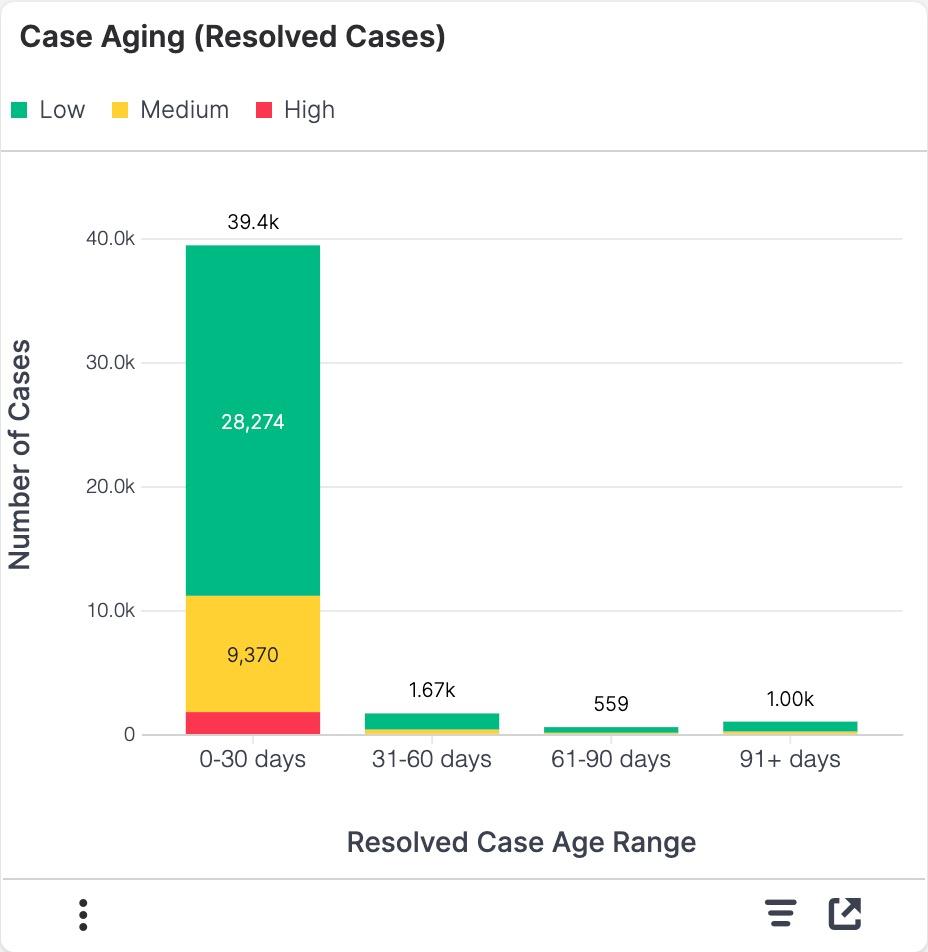
This report shows the time to resolution for resolved cases in the system. This report also segments the age by priority so you can see how fast different priority cases are resolved. This report is useful for support managers who want to see the age of resolved cases so they can understand how long it takes to resolve cases and identify patterns.
|
Resolved Case Age Definition The resolved case age is the number of days between the case's Date Created and the Resolved Date fields. |
Examples of insights that can be gained from this report include:
- How old are cases typically before they get resolved?
Case Creation Trend
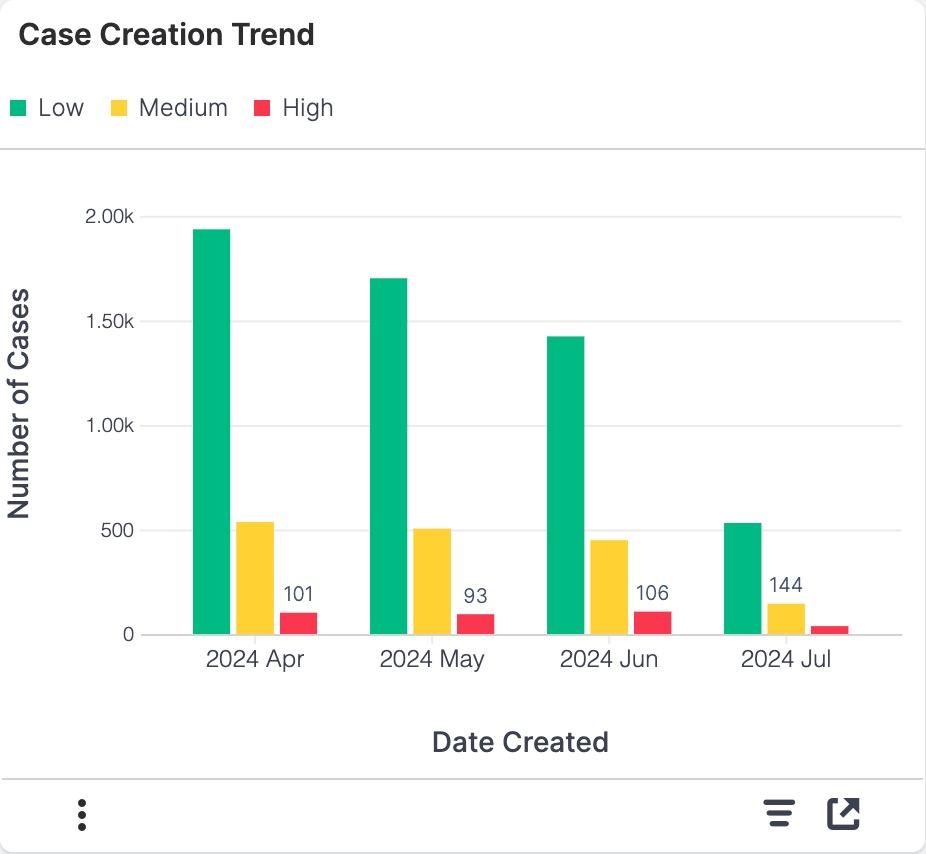
This report shows the trend in how many cases are created in each month, segmented by the priority of the case. The months included can be adjusted using the slicer. This helps identify service demand patterns to help forecast future resource allocation.
Examples of insights that can be gained from this report include:
- When does customer service demand peak?
Case Resolution Trend
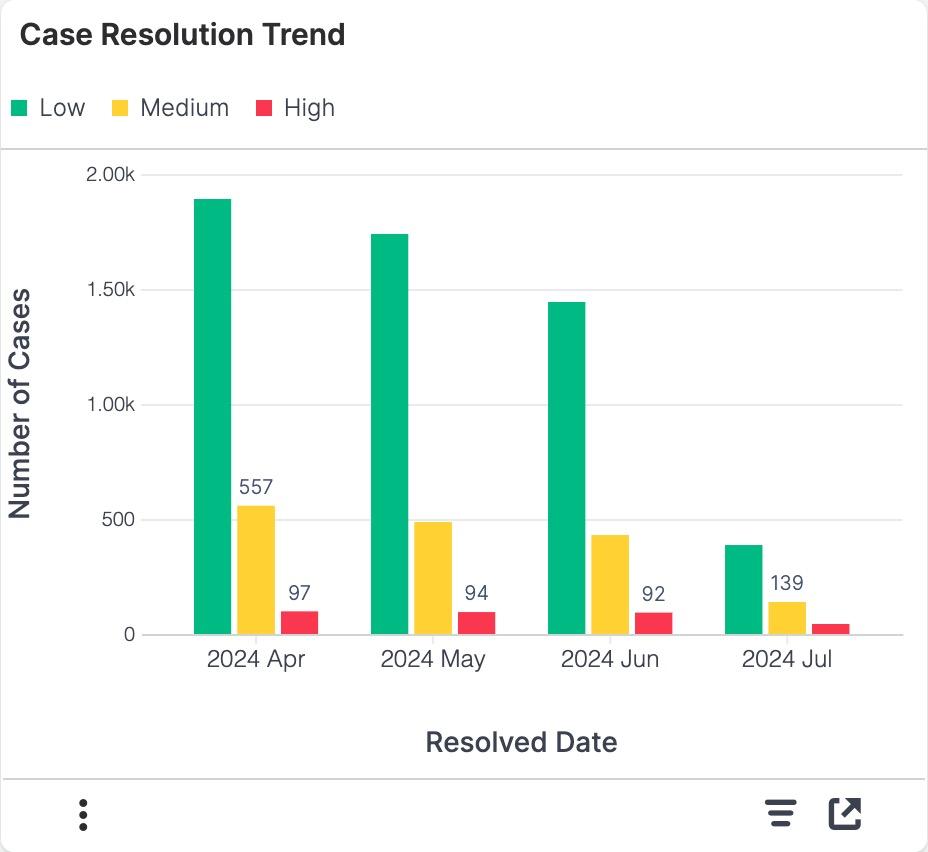
The Case Resolution Trend report shows the trend of how many cases are resolved in each month segmented by priority. The months included can be adjusted using the slicer. This shows the trend in case resolution over previous months.
Examples of insights that can be gained from this report include:
- When is customer service output highest?
Case Source Change Over Time
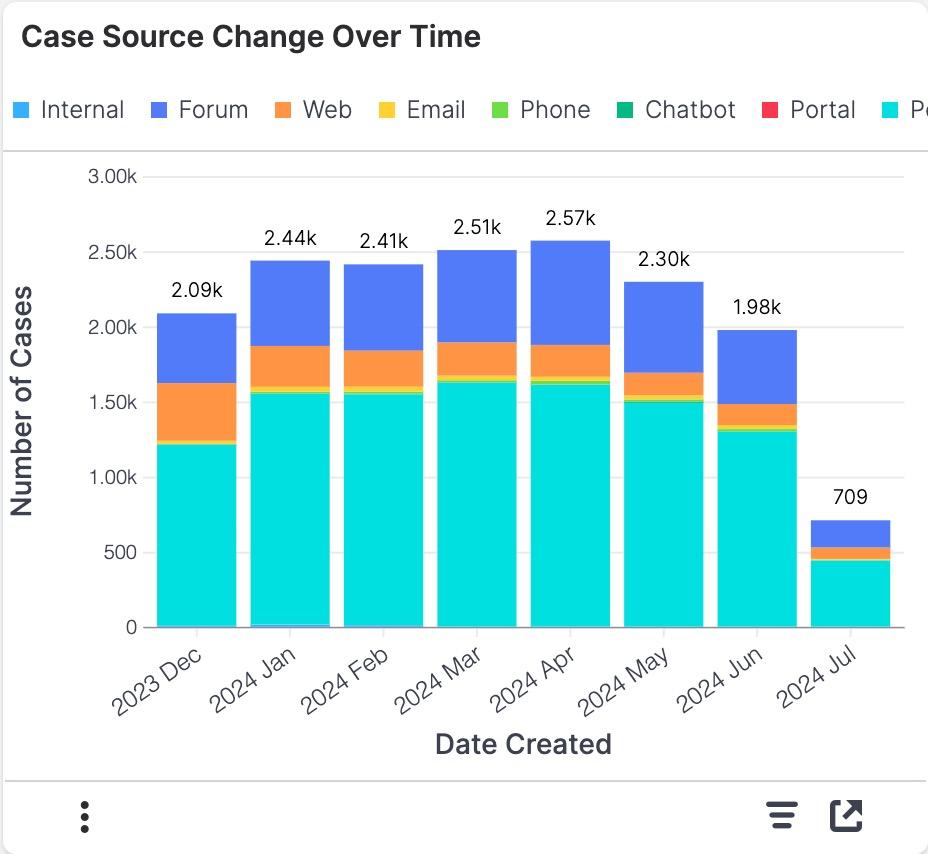
This report shows how the source of customer service cases shifts over a user-chosen time. This report helps support managers understand how customers prefer to engage with support so that the proper channels can be appropriately staffed.
Examples of insights that can be gained from this report include:
- How are customers seeking help?
Escalations Over Time
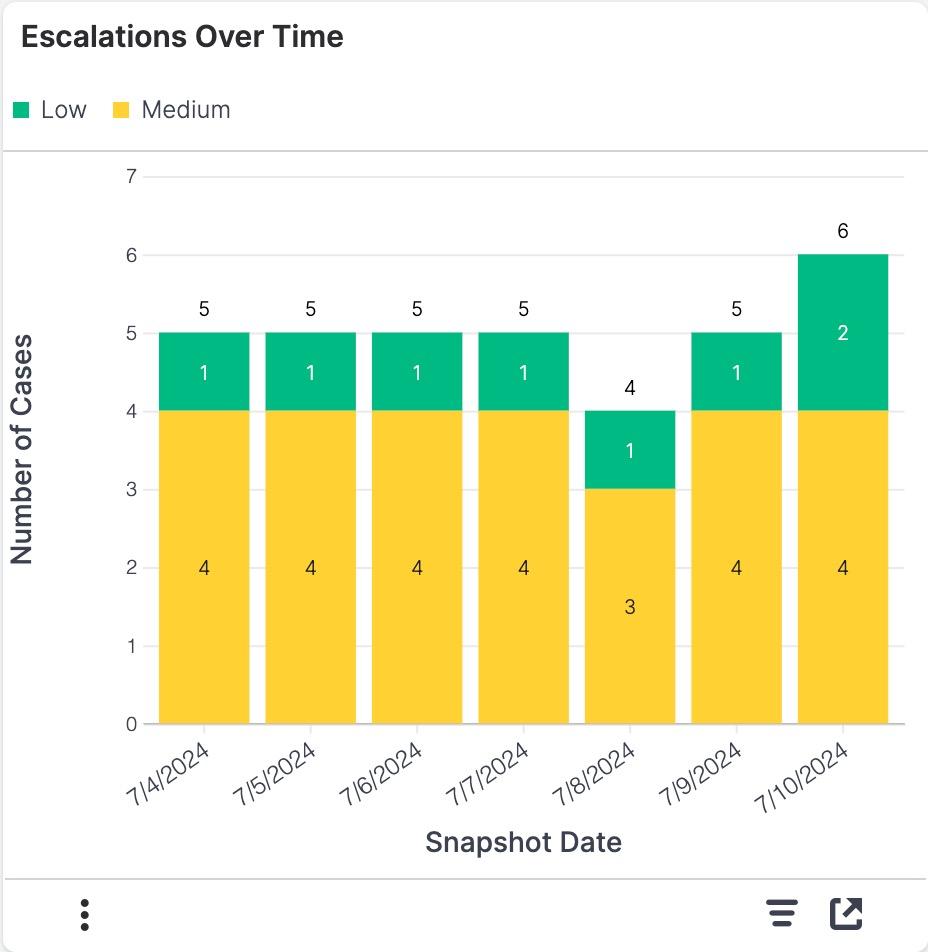
This report shows how many cases are escalated and open (i.e., not Closed, Rejected, Duplicate) on each day. The timeframe can be adjusted with the slicer.
Examples of insights that can be gained from this report include:
- Is the complexity of cases changing resulting in more escalated cases?
- Are cases requiring more intervention?
Open Cases Trend
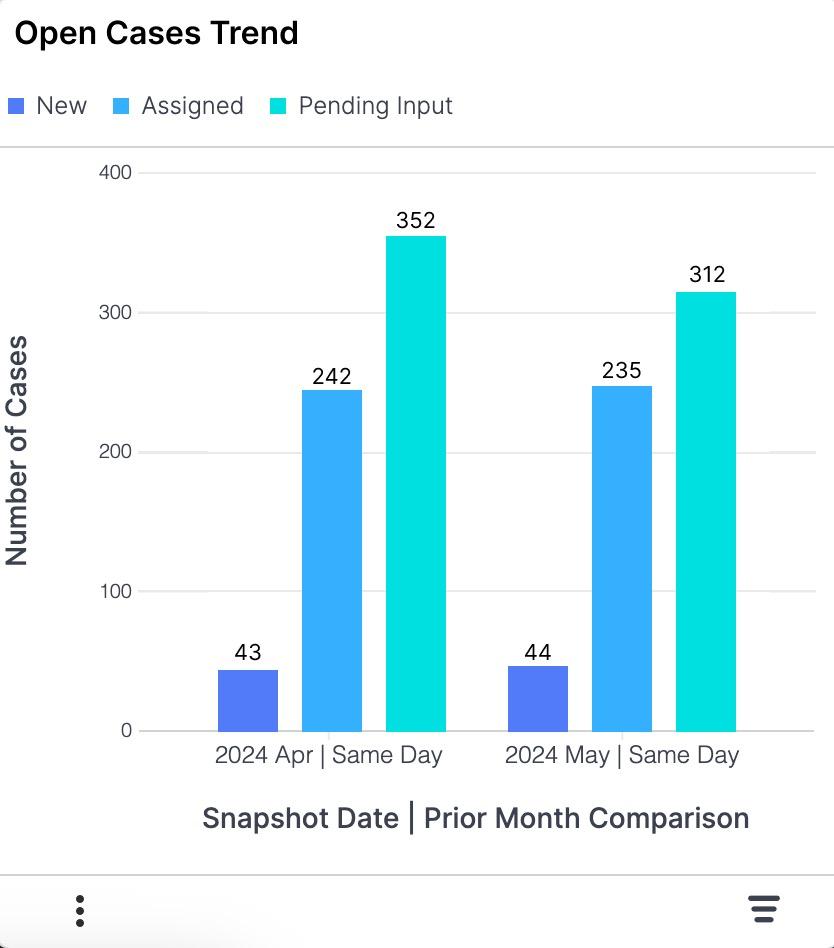
This report shows the trend of open cases today and at the same point in time in previous months. Only cases that are not in the Closed, Rejected, or Duplicate status are included in this report. This report shows the status of the open cases in each month so you can see how your caseload today compares to prior months. The number of prior months included in the report can be adjusted with the slicer.
Examples of insights that can be gained from this report include:
- How is the number of new cases changing compared to previous months and why might that be?
SLA Compliance Rate
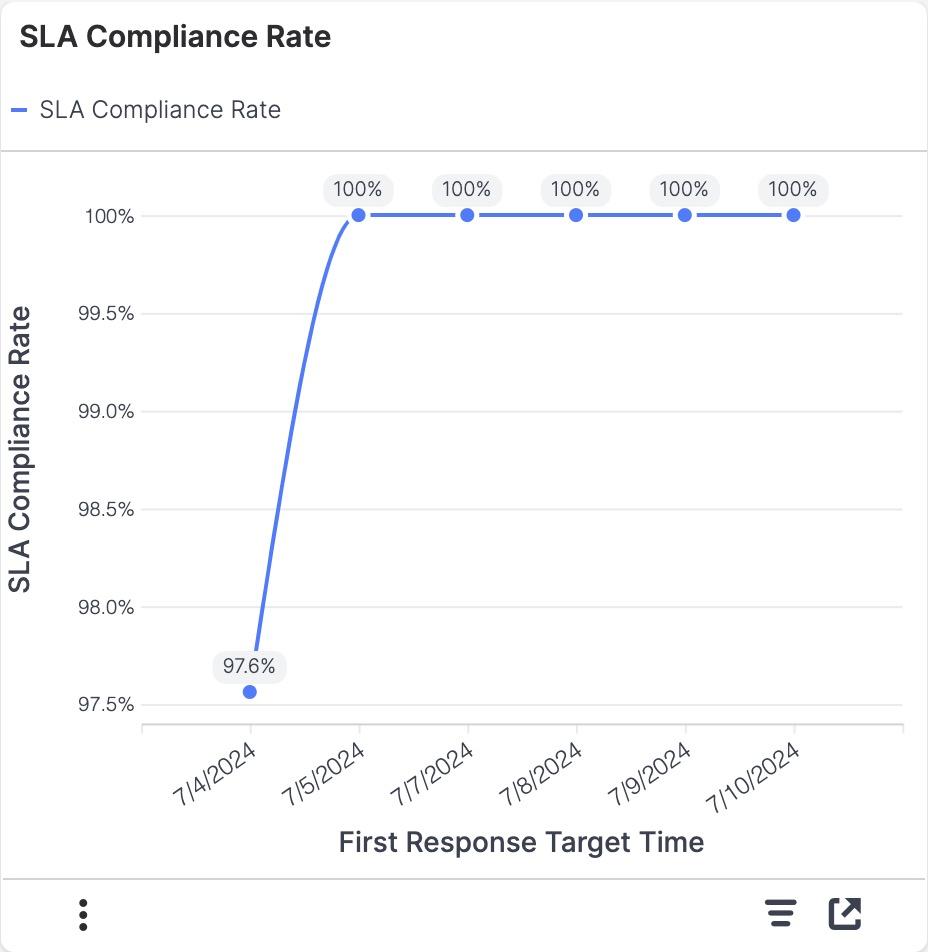
The SLA Compliance Rate report shows the calculated trend of service level agreement (SLA) compliance rate based on the First Response Target Time field. Cases that do not have a First Response Target Time are excluded from this report.
|
SLA Compliance Rate Definition The SLA Compliance Rate is the number of cases that met the first response SLA divided by the total number of cases with a first response target time on that date. Example Calculation SLA Compliance Rate = (Number of cases that met the first response SLA due on July 4, 2024) ÷ (Total number of cases that have a First Response Target Time on July 4, 2024) x 100% = 97.6% |
Examples of insights that can be gained from this report include:
- How often are we meeting our SLA commitments?
- Are there times when our SLA compliance falls?
SLA Trend
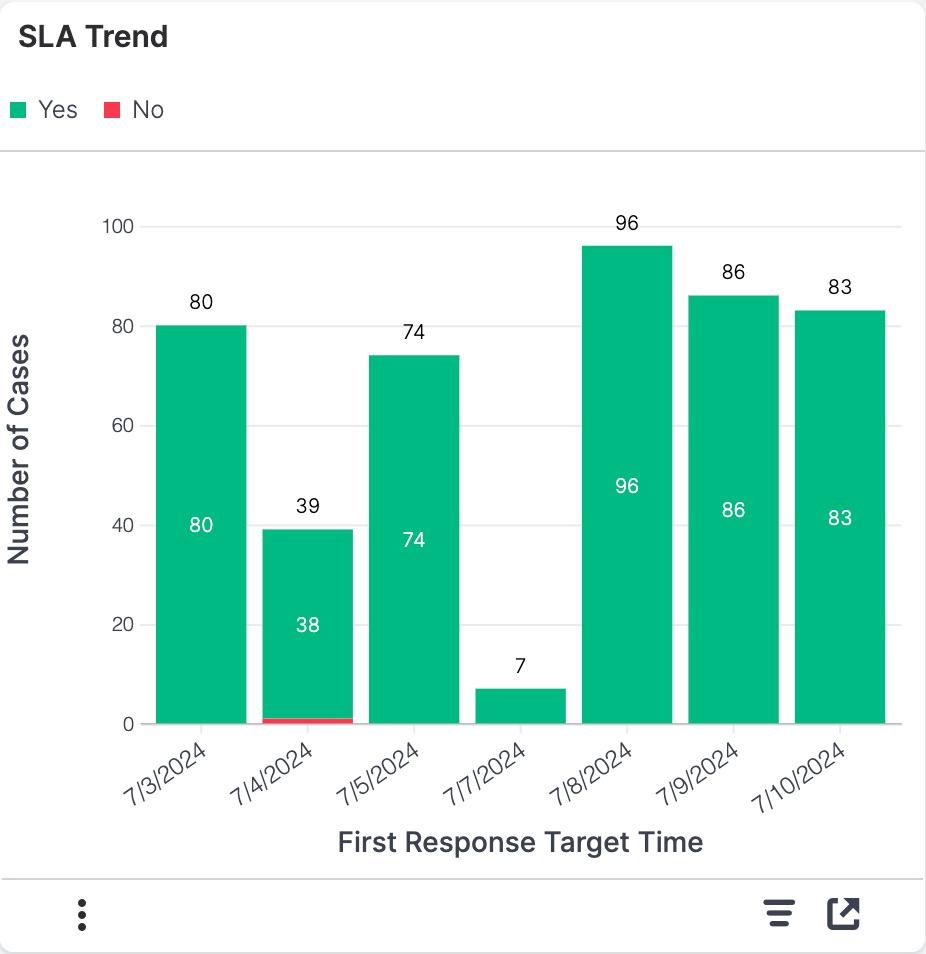
This report shows how many cases are meeting or missing the service level agreements (SLA) (i.e., First Response SLA Met field) based on the First Response Target Time field.
Examples of insights that can be gained from this report include:
- How many cases are missing the SLA?
- How well are we complying with our SLA?
Case Details
The Case Details report is used as the target for all of the out-of-the-box visualizations. If you have permission to drill into reports, this is the report you will be taken to in order to view more details on the segment. The pivot table shows the case Subject, Account Name, Priority, Status, Assigned To, average Business Hours to First Response, average Business Hours to Resolution, and sum of the number of cases for the segment you drilled into. This report is intended to be viewed only as a target for drill linking from another report.
Sugar Fields Used in Reports
When using the out-of-the-box Service Insights reports, the reports will display only if all the fields are present in your Sugar instance and the name has not been altered. If a particular report is not rendering, use the chart below to determine if you are missing a required field.
| Cases module fields |
||||||||||||||||
| Report | Account Name | Assigned To | Business Hours to First Response | Business Hours to Resolution | Date Created | Escalated | First Response Target Time | First Response Actual Time | First Response SLA Met | ID | Priority | Resolved Date | Status | Source | Subject | Type |
| Agent Leaderboard by Cases Closed | S | ✔ | S | ✔ | ✔ | S | S | S | ||||||||
| Average Handle Time | S | S | ✔ | S | ✔ | ✔ | S | S | ||||||||
| Average Time to First Response | S | S | ✔ | ✔ | S | ✔ | S | S | S | |||||||
| Case Aging (Open Cases) | S | S | ✔ | S | ✔ | ✔ | S | S | S | |||||||
| Case Aging (Resolved Cases) | S | S | ✔ | ✔ | ✔ | ✔ | S | S | ||||||||
| Case Creation Trend | S | S | ✔ | ✔ | ✔ | S | S | S | ||||||||
| Case Resolution Trend | S | S | ✔ | ✔ | ✔ | S | S | |||||||||
| Case Source Change Over Time | S | ✔ | S | ✔ | S | S | ✔ | S | ||||||||
| Escalations Over Time | S | S | ✔ | ✔ | S | S | ||||||||||
| Open Cases Trend | S | S | ✔ | S | ✔ | S | S | |||||||||
| SLA Compliance Rate | S | S | ✔ | ✔ | ✔ | S | S | |||||||||
| SLA Trend | S | S | ✔ | ✔ | ✔ | S | S | |||||||||
| Case Details | ✔ | ✔ | ✔ | ✔ | ✔ | ✔ | ✔ | ✔ | ||||||||
✔: This field is needed for the report.
S: This field is used in the slicer only.
Configure Reports
If your organization does not use a particular stock Sugar field outlined above, you will need to configure the report to use the fields that best represent your data. Anyone with admin access to Discover can do this configuration. We recommend reaching out to your Sugar partner or Sugar representative if you need help configuring your reports.
Remove Missing Slicers
Suppose the report you want to use is not rendering only because you do not have a slicer field present (e.g., you want to use the Agent Leaderboard by Cases Closed report but your organization does not use Source). In that case, a Discover admin can configure this in a fairly straightforward way:
- Open the Discover interface.
- Click on the Home icon to open the Library.
- Select the report (e.g., Agent Leaderboard by Cases Closed) to open it. You will see that the report has missing fields.
- Open the Query Layout panel by clicking the bar chart icon in the upper left corner. Confirm that the only fields that are highlighted are in the Slicer section. If so, you can proceed safely. If other fields are highlighted, your report will need more configuration.
- Click the Remove All Missing Fields button. Once the field is removed, your report should render.
- Click the Save button in the top right and select "Save As" to save a copy of your report. Use this copy on your Sugar dashboards.