Report Templates
Overview
Sugar's Reports module comes with a number of pre-built, template reports. These reports display information from Sugar modules (e.g., Accounts, Contacts, Opportunities, etc.) that will help provide insights into your CRM data. This page lists the template reports that come with the current version of Sugar and helps explain the type of information provided in each report.
Please note that Sugar ships with over 100 template reports, which may vary by version. For descriptions of template reports that shipped with previous versions of Sugar, please refer to the Understanding Legacy Stock Reports article. In addition to template reports, users can create their own reports. For more information on creating reports, please refer to the Reports documentation.
Viewing Report Templates
All of Sugar's template reports can be accessed via the Reports module. From the Reports list view, template reports can be identified using the template tag, report template filters, or viewing an enabled checkbox in the Template column. You may also preview a template report from list view to read its description and other information from the report's fields. For more information on previewing reports, please refer to the User Interface documentation.
Please note that you will only be able to see reports as allowed by your team membership, user access type, and assigned roles. For more information on teams and roles, please refer to the Team Management and Role Management documentation in the Administration Guide.
Template Tag
Report templates are automatically tagged in Sugar with the "Template" tag. Each report also has a category tag such as "Administrative" or "Sales and Marketing". The reports listed on this page under Report Templates by Category are organized by the reports' category tags in Sugar. Users can filter the Reports list view by tag as explained in the User Interface documentation.
Report Template Filters
The Reports list view search provides a filter option that allows users to narrow the list of visible reports. In addition to the default module filters, the following filters are available for the Reports module:
- Templates: Filter the list view to show only template reports.
- Non Templates: Filter the list view to hide all template reports.
- With Charts: Filter the list view to show only reports designed with charts.
Users can further refine the results by typing a search query in the search bar and can create and save their own custom filters. For more information on searching and filtering the list view, please refer to the Search documentation.
Using Report Templates
Any user may view a report template according to their role and team permissions. These templates are crafted with stock Sugar fields so that you can start visualizing your data immediately. Report templates cannot be added, edited, mass-updated, or deleted. If you want to edit the contents of a report, you must duplicate the report template and save the edited copy with a new name. Report templates can also be duplicated directly from the list view actions menu.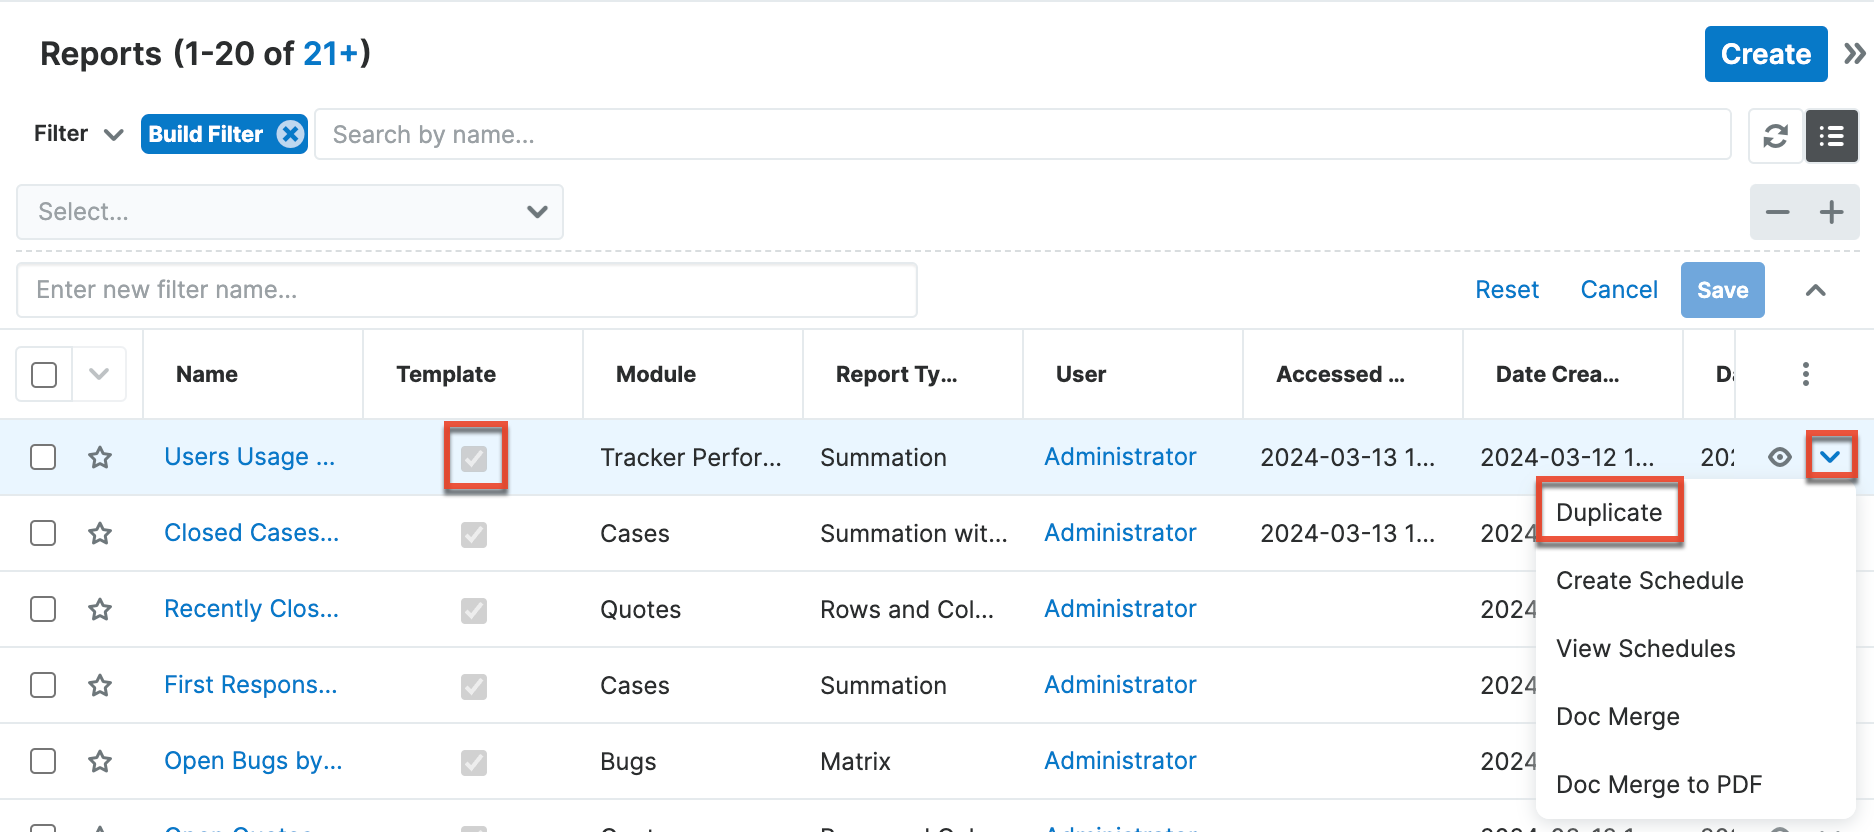
Many of the reports are designed with run-time filters so that you can filter your results further. These filters can be used without duplicating the report. For information on how to navigate a report in the results view, refer to the Reports documentation.
Note: The only fields you can edit on a report template are "Assigned to" and "Teams". You can edit these fields via Preview.
Report Templates by Category
The reports on this page have been shipped with the current version. For more information on reports that shipped with previous versions but are no longer being shipped in current versions of Sugar, please refer to the Understanding Legacy Stock Reports article.
Administration Reports
The following reports were designed for administrators to gain insight into teams and users, usage patterns, and the performance of their Sugar instance. The reports in this section are tagged "Template" and "Administrative" in the Reports module.
Note: The tracker settings must be enabled via Admin > Trackers before tracker data becomes reportable in Sugar. Please refer to the Understanding Tracker Reports article for in-depth descriptions of each template tracker report.
| Name | Module | Type | Chart Type | Description |
| Active User Sessions (Last 7 Days) | Tracker Sessions | Rows and Columns | Lists the duration of all user sessions over the last 7 days. | |
| Licensed User List 1 | Users | Rows and Columns | Administrators can refer to this report to periodically check the number of active users counting against their license and ensure they are not close to exceeding their limit. | |
| List of Teams and Licensed Users 1 | Teams | Summation with details | Provides the list of teams and the number of users in the team. Group and portal users are excluded from this list. | |
| Modules Used By My Direct Reports (Last 30 Days) | Trackers | Summation | Horizontal Bar | Displays a summary of module usage in the past 30 days for all users who report to the current user. |
| My Module Usage (Last 30 Days) | Trackers | Summation | Horizontal Bar | Displays a summary of module usage in the last 30 days for the current user. |
| My Module Usage (Last 7 Days) | Trackers | Summation | Horizontal Bar | Displays a summary of module usage in the last 7 days for the current user. |
| My Module Usage (Today) | Trackers | Summation | Horizontal Bar | Displays a summary of module usage so far today for the current user. |
| My Recently Modified Records (Last 30 Days) | Trackers | Rows and Columns | Lists records assigned to the current user that were saved in the last 30 days. | |
| My Records Modified (Last 7 Days) | Trackers | Rows and Columns | Lists records assigned to the current user that were saved in the last 7 days. | |
| My Usage Metrics (Last 30 Days) | Tracker Performance | Summation | Shows the total server response time in seconds, total number of database round trips, and total number of files accessed by the current user in the last 30 days. | |
| My Usage Metrics (Last 7 Days) | Tracker Performance | Summation | Shows the total server response time in seconds, total number of database round trips, and total number of files accessed by the current user in the last 7 days. | |
| My Usage Metrics (Today) | Tracker Performance | Summation | Shows the total server response time in seconds, total number of database round trips, and total number of files accessed by the current user so far today. | |
| Records Modified By My Direct Reports (Last 30 Days) | Trackers | Rows and Columns | Lists records saved in the last 30 days by users who report to the current user. | |
| Slow Queries | Tracker Queries | Rows and Columns | Lists the details for queries that took longer than the query threshold limit defined in Admin > Trackers. | |
| User Sessions Summary (Last 7 Days) | Tracker Sessions | Summation | Summarizes the number of session roundtrips and total active time for each user over the last 7 days. | |
| Users Usage Metrics (Last 30 Days) | Tracker Performance | Summation | Shows the total server response time in seconds, total number of database round trips, and total number of files accessed for each user in the last 30 days. | |
| Users Usage Metrics (Last 7 Days) | Tracker Performance | Summation | Shows the total server response time in seconds, total number of database round trips, and total number of files accessed for each user in the last 7 days. |
1 This report is also available for regular users.
General Reports
The following reports will help many types of users. The reports in this section are tagged "Template", "Customer Service", and "Sales and Marketing" in the Reports module.
| Name | Module | Type | Chart Type | Description |
| Call Activity by User | Calls | Summation with details | Vertical Bar | Number of calls held this year grouped by the assigned user. The call status, time period, and assigned user can be adjusted using the run-time filters. |
| Customers By Tier | Accounts | Summation | Vertical Bar | Number of accounts at each service level. The assigned to user and service level tier can be adjusted with the run-time filters. |
| My Open Tasks by Priority and Status | Tasks | Matrix | Horizontal Bar | Open tasks assigned to the current user grouped by priority and status. The assigned user and task status can be adjusted with the run-time filters. This report allows users to focus on higher-priority tasks that are near completion. |
| Open Calls | Calls | Rows and Columns | List of calls assigned to the current user that are scheduled or canceled in the last 7 days. The call status, start time, and assigned user can be adjusted with the run-time filters. | |
| Open Cases for My Customers | Cases | Summation with details | Treemap | Number of cases that are new, assigned, or pending input that are associated with an account the current user is assigned to. These cases are grouped by account name to give you insight into which accounts have the most open cases. The user can be changed with the run-time filter. |
Customer Service Reports
The following reports will help customer service users and managers gather important information about cases and bugs in Sugar. The reports in this section are tagged "Template" and "Customer Service" in the Reports module.
| Name | Module | Type | Chart Type | Description |
| All Cases Due Today and Overdue 1 | Cases | Summation | Horizontal Bar | All cases with a follow-up date that has passed or is today. Defaults to all cases with a follow-up date in the past 30 days. |
| All Open Cases by Followup Date 1 | Cases | Summation with details | Vertical Bar | Number of open cases grouped by the follow-up date. |
| Average Difference From Follow-Up Date by Week by Agent 1 | Cases | Matrix | Vertical Bar | The average difference from the targeted follow-up date in business hours by week for each agent. Includes cases created in the last 30 days, but this range can be changed using the run-time filter. A run-time filter can also filter by cases that either met or missed their first response SLA. |
| Average Time to First Response by Agent 1 | Cases | Summation | Horizontal Bar | The average time in business hours until the first response on a case, per agent. Includes cases created in the last 30 days, but this range can be changed using the run-time filter. |
| Average Time to Resolution by Week by Agent 1 | Cases | Summation | Horizontal Bar | The average time in business hours it takes to resolve cases by week for each agent. Includes cases resolved in the last 30 days, but this range can be changed using the run-time filter. |
| Average Time to Resolution by Week by Type 1 | Cases | Summation | Horizontal Bar | The average time in business hours it takes to resolve cases by week for each case type. Includes cases resolved in the last 30 days, but this range can be changed using the run-time filter. |
| Bugs by Product Category by Status | Bugs | Matrix | Horizontal Bar | Number of bugs created by category and their current status. This report gives a sense of which area of the product generates bugs. The time period can be adjusted in the report using run-time filters. |
| Bugs Created by Month By Category | Bugs | Matrix | Vertical Bar | Number of bugs created each month summarized by the category. This report provides a trend on the number of bugs being generated across the category. |
| Bugs Created by Month By Priority | Bugs | Matrix | Vertical Bar | Number of bugs created each month summarized by their priority. This report provides a trend on the number of bugs. |
| Cases That Missed the First Response SLA 1 | Cases | Matrix | Vertical Bar | The number of cases that missed their first response SLA in the last 7 days. The time period can be changed using the run-time filter. |
| Cases with No Calls, Meetings, Tasks, or Emails | Cases | Matrix | Summary count of cases where no activity has taken place or is scheduled. Those cases are counted that have no calls, meetings, or tasks scheduled or completed. | |
| Closed Cases by Time to Resolution | Cases | Summation with details | Horizontal Bar | Number of closed cases grouped by assigned user and summarized by average hours to resolution. The status of the case can be changed with the run-time filter. |
| Daily Average Time to First Response 1 | Cases | Summation | Horizontal Bar | The daily average time in business hours until the first response on a case. Includes cases created in the last 7 days, but this range can be changed using the run-time filter. |
| First Response SLA Success Rate 1 | Cases | Summation | Pie | All cases created in the last 30 days, separated by whether or not their first response SLA was met. The run-time filters can be used to change the time period or narrow the results to only cases assigned to a specific agent. |
| List of Changes to Case Status 1 | Change Timers | Rows and Columns | List of all changes to case status. Includes cases created in the last 30 days, but this range can be changed using the run-time filter. | |
| List of Recently Resolved Cases 1 | Cases | Rows and Columns | A list of recently closed cases across all business centers. The time period can be adjusted in the report. | |
| My Average Difference From Follow-Up Date by Week 1 | Cases | Summation | Vertical Bar | The average difference from the targeted follow-up date in business hours by week for the current user. Includes cases created in the last 30 days, but this range can be changed using the run-time filter. A run-time filter can also be used to filter by cases that either met or missed their first response SLA. |
| My Cases Due Today and Overdue 1 | Cases | Summation | Horizontal Bar | All cases assigned to the current user with a followup date that has passed or is today. Defaults to all cases with follow-up date in the past 30 days. |
| My Cases in the Last Week by Status 1 | Cases | Summation | Horizontal Bar | Cases modified by the current user in the last 7 days, grouped by the status of the case. The time period can be adjusted in the report. This report makes it easy to identify recently worked on cases. |
| My Cases Resolved this Month by Week 1 | Cases | Summation | Vertical Bar | This report displays a chart for all cases that were closed in the selected time period and groups them by week. |
| My Open Bugs by Priority | Bugs | Summation | Pie | List of open bugs assigned to the current user summarized by priority. |
| My Open Cases by Followup Date 1 | Cases | Summation with details | Vertical Bar | Number of open cases assigned to the current user grouped by the follow-up date. |
| My Open Cases by Priority | Cases | Summation | Horizontal Bar | List of open cases assigned to the current user summarized by priority. |
| My Open Cases by Status 1 | Cases | Summation | Pie | This pie chart shows the percent of cases that are open by status for the current user. |
| My SLA Success Rate 1 | Cases | Summation | Vertical Bar | The history of cases the current user responded to that either met or missed their first response SLA. Includes cases in the last 30 days, but this range can be changed using the run-time filter. |
| New Cases by Business Center by Week 1 | Cases | Summation | Vertical Bar | Number of cases created for each business center by week. The time period can be adjusted in the report. |
| New Cases by Customer Tier by Week 1 | Cases | Summation | Vertical Bar | Number of cases created by the service level of the customer (customer tier) by week. The time period can be adjusted in the report. |
| New Cases Opened by Month | Cases | Summation with details | Vertical Bar | Number of cases grouped by the month in which they were created. The time period can be adjusted with the run-time filter. |
| New Portal Users Awaiting Activation 1 | Contacts | Rows and Columns | A list of portal users created but not yet activated. Includes contacts created in the last 7 days, but this range can be changed using the run-time filter. | |
| Open Bugs by User by Priority | Bugs | Matrix | Number of bugs assigned to each user grouped by priority of the bug. This report gives a sense of which bugs need attention the most. | |
| Open Bugs by User by Status | Bugs | Matrix | Number of bugs assigned to each user and the priority of the bug. This report gives a sense of the workload of users working on the bugs. | |
| Open Cases Awaiting First Response That Missed SLA 1 | Cases | Rows and Columns | All open cases that missed the first response SLA and are still awaiting first response. | |
| Open Cases Awaiting First Response Within SLA 1 | Cases | Rows and Columns | All open cases that are within their SLA and awaiting first response. | |
| Open Cases by Customer Tier and Priority 1 | Cases | Matrix | Horizontal Bar | A summary of open cases grouped by the service level of the customer (customer tier) and priority. |
| Open Cases By Month By User | Cases | Summation | Vertical Bar | List of open cases by created month and grouped by user. |
| Open Cases by User by Priority | Cases | Matrix | Horizontal Bar | Number of cases assigned to each user and the priority of the bug. This report gives a sense of the workload of users working on the cases. |
| Open Cases by User by Status | Cases | Matrix | Horizontal Bar | Number of cases assigned to each user and the current status of the bug. This report gives a sense of which cases need attention the most. |
| Recently Created Cases 1 | Cases | Rows and Columns | A list of all recently created cases across all business centers. The time period can be adjusted in the report. | |
| Status of Open Tasks Assigned by Me 1 | Tasks | Summation with details | Vertical Bar | Open tasks that the current user has assigned to others. This report helps users know who to follow up with. |
| Summary of Bugs by Priority by Week Created | Bugs | Matrix | Vertical Bar | Number of bugs created each week by priority. The time period can be adjusted in the report using the run-time filters. |
| Summary of Bugs by Source by Week Created | Bugs | Matrix | Vertical Bar | Number of bugs created each week by source. The time period can be adjusted in the report using the run-time filters. |
| Summary of Bugs by Status by Week Created | Bugs | Matrix | Vertical Bar | Number of bugs created each week by status. The time period can be adjusted in the report using the run-time filters. |
| Summary of Cases by Priority by Week Created | Cases | Matrix | Vertical Bar | Number of cases created each week by priority. The time period can be adjusted in the report using the run-time filters. |
| Summary of Cases by Source by Week Created | Cases | Matrix | Vertical Bar | Number of cases created each week by source. The time period can be adjusted in the report using the run-time filters. |
| Summary of Cases by Status by Week Created | Cases | Matrix | Vertical Bar | Number of cases created each week by status. The time period can be adjusted in the report using the run-time filters. |
| Summary of Open Cases by Priority | Cases | Summation | Horizontal Bar | Number of cases that are still open summarized by priority of bug. |
| Total Cases Resolved this Month by Agent 1 | Cases | Summation | Horizontal Bar | Number of cases that were resolved during the month grouped by agent and priority. The time period can be adjusted in the report. |
| Total Cases Resolved this Month by Business Center 1 | Cases | Matrix | Horizontal Bar | Number of cases that were resolved during the month grouped by business center and priority. The time period can be adjusted in the report. |
| Total Time Spent on Cases by Week by Case Type 1 | Change Timers | Summation | Vertical Bar | The total time in business hours spent on cases for each week by case type. Includes cases created in the last 30 days, but this range can be changed using the run-time filter. |
1 This report is only available for Sugar Serve or Enterprise users.
Data Privacy Reports
The following reports will help data privacy managers and marketing users make privacy-related insights and identify leads, contacts, and targets who have opted in to or out of marketing communications. The reports in this section are tagged "Template" and "Data Privacy" in the Reports module.
| Name | Module | Type | Chart Type | Description |
| Count of Contacts by Country | Contacts | Summation | Total count of existing contacts grouped by country. | |
| Count of Leads (unconverted) by Country | Leads | Summation | Total count of existing leads (unconverted) grouped by country. | |
| Count of Targets by Country 1 | Targets | Summation | Total count of existing targets grouped by country. | |
| Data privacy activity completed and rejected each month | Data Privacy | Matrix | Vertical Bar | Number of data privacy activities completed or rejected each month. The month is based on date closed. |
| Data Privacy Activity Due Now | Data Privacy | Summation with details | Horizontal Bar | List of all data privacy activity that is due shortly. Use the run-time filter to adjust the time period. |
| Data Privacy Activity Overdue | Data Privacy | Summation with details | Horizontal Bar | List of all data privacy activity that are still open and the due date is in the past. |
| List of Contacts with No Consent | Contacts | Rows and Columns | List of all contacts who have not provided any consent for any business purpose. | |
| List of Emails Opted In | Email Address | Rows and Columns | List of all emails currently opted in. | |
| List of Emails Opted Out | Email Address | Rows and Columns | List of all emails currently opted out. | |
| List of Leads with no Consent 1 | Leads | Rows and Columns | List of all leads who have not provided any consent for any business purpose. | |
| List of Open Data Privacy Activities | Data Privacy | Rows and Columns | A list of all data privacy activities that have a status of open. | |
| List of Open Data Privacy Activities assigned to me | Data Privacy | Rows and Columns | List of open data privacy activity assigned to the current user. | |
| Number of Data Privacy Activity created each month by type | Data Privacy | Matrix | Vertical Bar | Number of data privacy activities created each month by activity type. |
| Open Data Privacy Activities by Type | Data Privacy | Summation with details | Horizontal Bar | List of all open data privacy activity grouped by activity type. |
| Recently Created Data Privacy Activity | Data Privacy | Rows and Columns | A list of all recently created data privacy activity. The time period can be adjusted in the report using the run-time filters. |
1 This report is only available for Sugar Sell or Enterprise users.