Enhanced Forecasting Reports
Overview
The Enhanced Forecasting reports are available to Sugar Sell Premier customers. These reports can be displayed in the Sugar Discover dashlet and provide you with a way to monitor changes to your pipeline, trends, and forecasts over time. The reports described on this page are the ones that come out of the box with Sell Premier. Your organization may engage with your implementation partner or Sugar's Professional Services team to modify these reports to fit your needs.
Prerequisites
Enhanced Forecasting reports are powered by Sugar Discover, a smart data discovery solution that continuously analyzes your sales metrics, learns normal patterns and relationships between attributes in your data, and surfaces insights into changes impacting those metrics. These capabilities are available exclusively to Sugar Sell Premier customers who are SugarIdentity-enabled and are leveraging the stock Opportunities module with the two-range forecast configuration. Sugar instances must also be hosted on SugarCloud in one of the supported regions: the U.S.A., EU (Frankfurt, Germany), or Australia.
To use the out-of-the-box reports to their full potential, you must be using the following stock fields in the Opportunities module:
- Account Name
- Assigned to
- Date Created
- Expected Close Date
- Forecast Stage
- ID
- Likely
- Opportunity Name
- Type
- Sales Stage
You must also be using the stock Industry field in the Accounts module. For more information on which reports require which fields, see the Sugar Fields Used in Reports section. In the documentation, we refer to fields and options according to their stock names, e.g., Likely field and Closed Won value in the Sales Stage field. If you have altered the stock Sugar fields, your reports will need to be updated to use the new fields.
These configurations also assume that your organization forecasts on a quarterly cycle, so several reports show results segmented by quarter. While you may still use these reports if you forecast on a different timescale, you should be aware of this assumption.
Note: If you use the Opportunities with Revenue Line Items model of opportunity management, these reports will show the data for the parent opportunity which has calculated and cascading fields based on the RLIs.
Snapshot Date
For improved tracking and reporting, it is often helpful to be able to see the state of your Sugar instance at a point in its history. You might wonder, for example, "At this point last quarter, how many idle opportunities did I have?" This could then be used to compare to the present. For example, "Do we have more idle opportunities now, and if so, why?". Discover helps you gather these types of insights by taking snapshots of your instance.
A snapshot is a picture of how your Sugar data looked at a given point in time. We refer to these points in time as the "snapshot date" below. Over the course of a day, changes in your Sugar instance will sync to Discover and therefore appear on your Enhanced Forecasting reports typically within 5 minutes. Snapshots are taken every day between 12:00 a.m. and 1:00 a.m. in your instance's time zone.
Discover Access Levels
By default, all regular Sugar user types are set to the "NoAccess" role for Discover (and thus cannot view Enhanced Forecasting reports). All System Administrator Sugar users are set to the "Admin" role for Discover. The admin must set roles for regular users before they can view reports.
To assign user roles, the admin must log in to Discover and click on the profile icon in the top right corner, then select "Admin" to access the Manage Users page. Use the dropdown menu in the column on the right to adjust the role of each user.
The following Sugar Discover roles dictate the access level of the Enhanced Forecasting reports and the Sugar Discover dashlet:
- NoAccess: Users with this role cannot view the Enhanced Forecasting reports on a Sugar dashboard.
- Admin: Users with this role have the same abilities as a User, with the additional ability to edit default SugarCRM datasets and administer users.
- User: Users with this role can view public reports, build reports, and share new reports.
- ReadOnly: Users with this role have access to view public reports, share reports, and drill link through reports. These users see a simplified user interface that hides items to which they do not have access.
- DashletUser: Users with this role can view the Enhanced Forecasting reports on a Sugar dashboard.
Note that Enhanced Forecasting reports show the same data for everyone and do not change the report to hide records or fields that are controlled by Sugar roles and teams. Therefore, a user with access to view Enhanced Forecasting reports will see all data from Sugar regardless of their Sugar role or team designations. You should not grant Discover access to a user who should not be able to see all opportunity records in Sugar.
For more information on user administration in Discover, refer to the User Administration documentation in the Sugar Discover User Guide.
Viewing Reports on a Dashboard
These reports can be placed on your Home, record view (Accounts, Opportunities, Revenue Line Items, and Cases modules), and list view (Forecasts module) dashboards by adding a Sugar Discover dashlet to the appropriate dashboard. To add the Sugar dashlet, choose "Sugar Discover" from the Add Dashlet list and then select the appropriate report.
For more information on the Sugar Discover dashlet, refer to the Sugar Dashlets documentation.
Enhanced Forecasting Reports
The following sections provide details about the reports that can be used for forecasting and optimizing your pipeline and revenue.
Note: The currency symbol displayed on your reports will depend on your system's currency setting.
Average Deal Size Trend
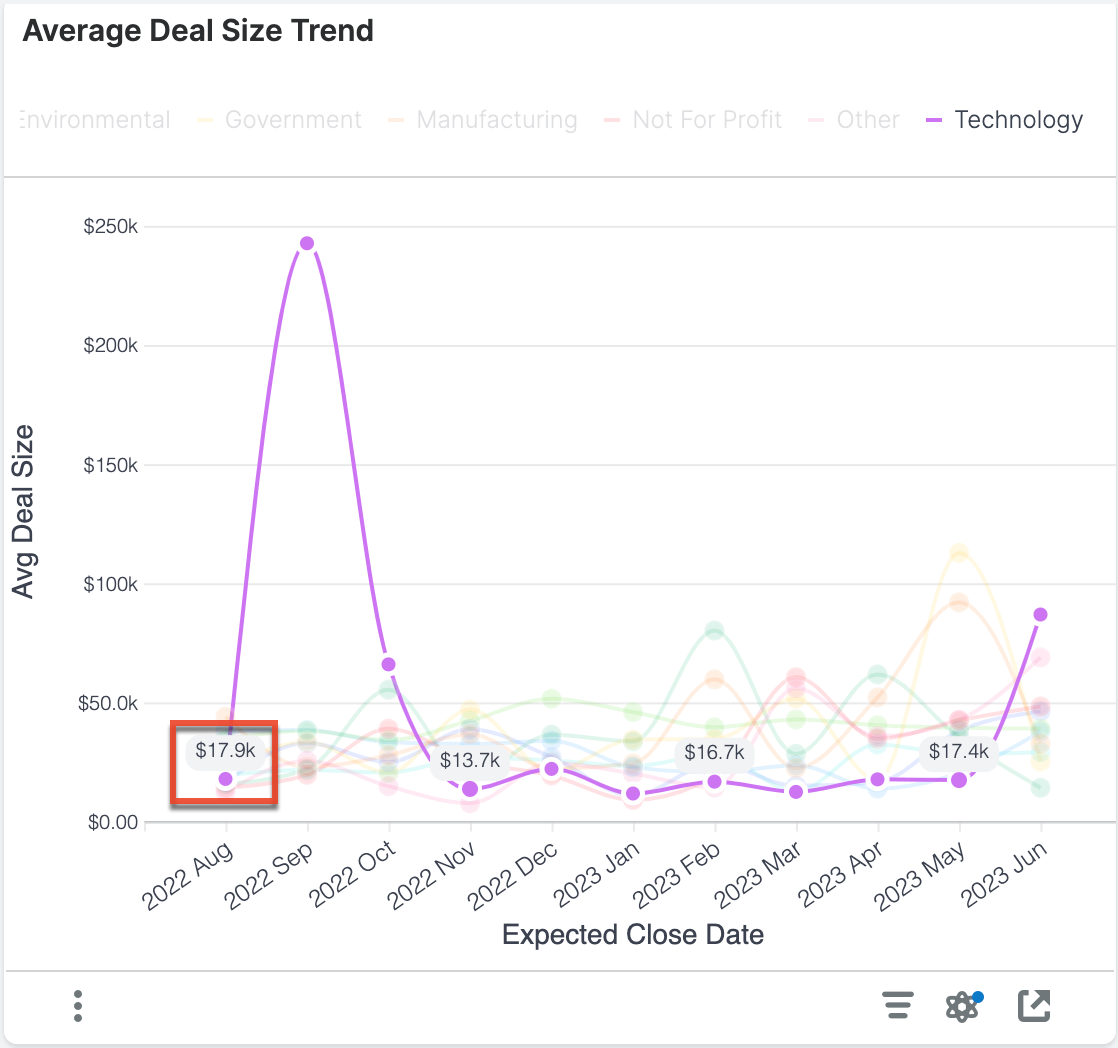
This report shows the average deal size for opportunities with expected close dates in each of the last 10 months so that you can find positive or negative trends within key business segments.
|
Average Deal Size Definition The average deal size is the sum of revenue dollars for opportunities with an expected close date in the indicated month and sector divided by the number of "Closed Won" opportunities with an expected close date in the indicated month and sector. Example Calculation for Point Highlighted in Chart Avg Deal Size = (Sum of |
Examples of insights that can be gained from this report include:
- In which segments of the business is our average deal size increasing or decreasing?
Current Quarter Forecast Changes Since Last Week
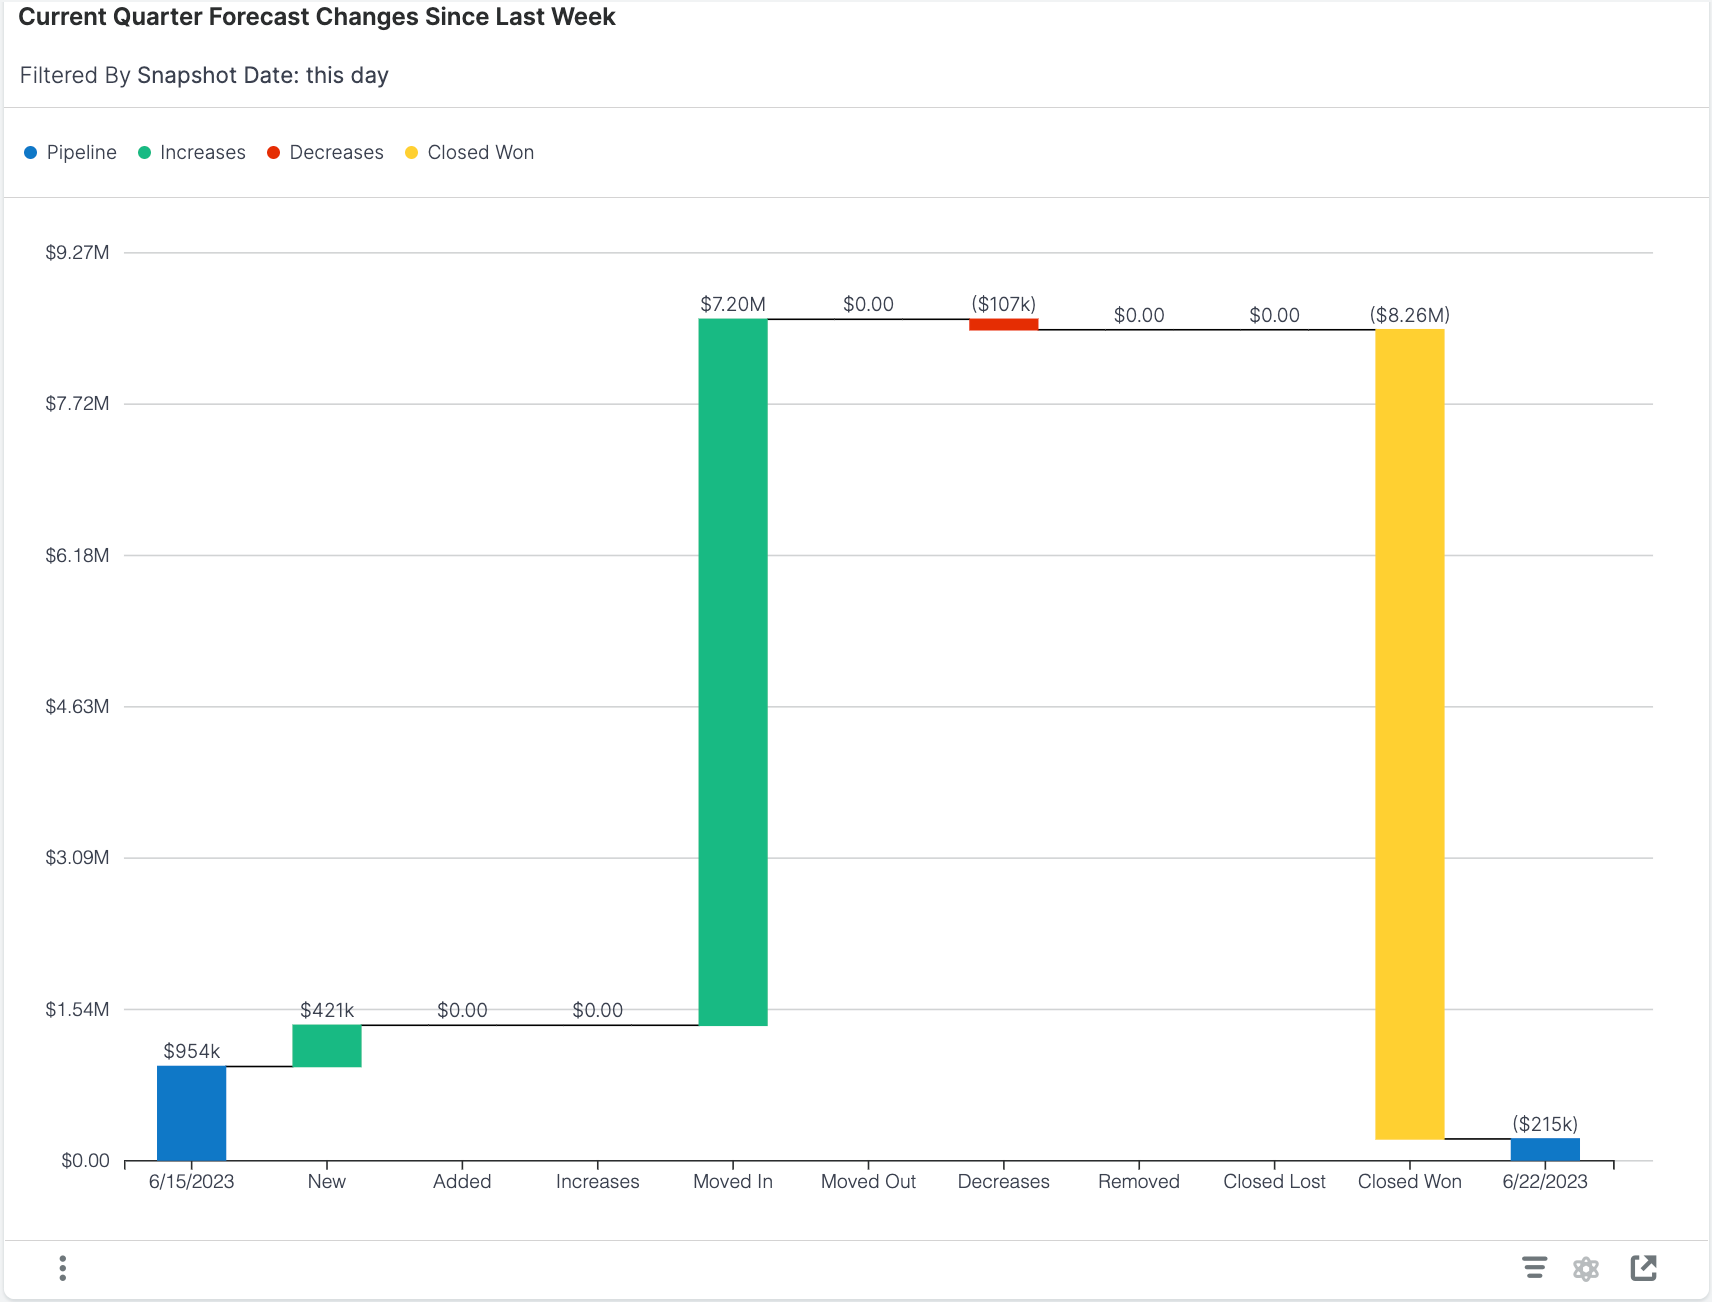
This report shows how your forecast has changed in the last 7 days, which can be particularly helpful for sales leaders who want to keep track of what changes are happening within their forecast over time (e.g., from week to week). With this type of data and visualization, sales leaders can identify risks, spot upside opportunities, and make accurate forecast commitments. The Forecast Changes report shows the total forecasted pipeline at the beginning (i.e., 7 days ago) and end (i.e., today) of the week as blue bars on the left and right of the chart, respectively. Between the blue bars, green, red, and yellow bars display increases, decreases, and "Closed Won" opportunities, respectively. Increases and decreases are further subdivided based on the type of activity that increased or decreased value from the forecast.
|
Forecast Change Category Definitions:
Example Interpretation for Chart There was $954k in the open pipeline at the beginning of the week, and $7.20M worth of opportunities were moved into the forecast, $107k worth of opportunities decreased in value, and $8.26M worth of opportunities were "Closed Won". These changes, along with the others, lead to $215k remaining pipeline at the end of the week. |
Examples of insights that can be gained from this report include:
- How did my forecasted pipeline change over the last week?
- Where am I gaining or losing the most opportunities from my pipeline?
Forecast Accuracy
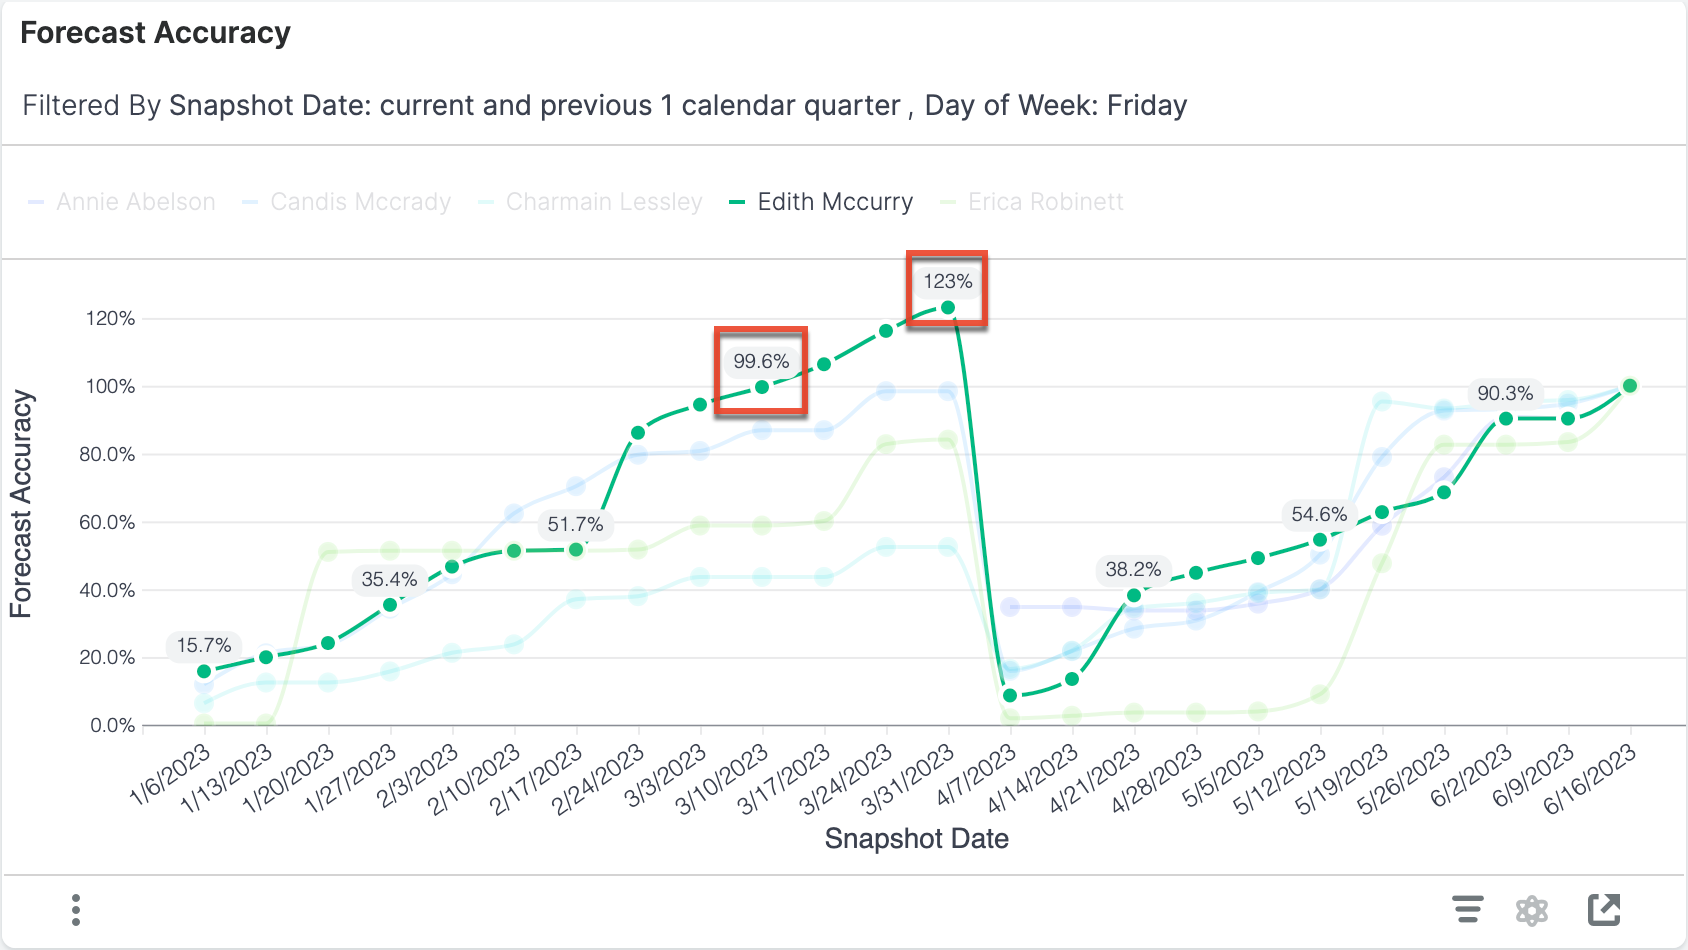
This report shows a simple forecast accuracy metric over time. The forecast accuracy calculation is recorded every Friday for the current and previous calendar quarter.
|
Forecast Accuracy Definition The accuracy of the forecast is the expected likely revenue for the period divided by the expected likely revenue on the last snapshot date included in the report. The last snapshot date on your plot will therefore always show 100% expected, and the earlier data points will adjust as more snapshots provide more information. A forecast accuracy above 100% indicates that the seller overestimated their sales on that day, while a forecast accuracy below 100% indicates that the seller underestimated their sales. Expected Likely Definition The sum of
Example Interpretation for Data Highlighted in Chart On 3/10/2023, Edith's expected likely for all her opportunities was $1.298M. On the last day of the chart, 6/16/2023, her expected likely was $1.303M. Therefore, Forecast Accuracy = $1.298M ÷ $1.303M × 100%= 99.6%. On 3/31/2023, Edith's expected likely was $1.604M so her forecast accuracy on that day is: Forecast Accuracy = $1.604M ÷ $1.303M × 100%= 123%. Note that the dollar values used in these example calculations are not visible in the report and were found for demonstration purposes by looking at the raw data. |
Examples of insights that can be gained from this report include:
- How does our forecast accuracy improve over the period?
Note that this report does not support drill-down.
Forecast: Current vs Prior Quarters
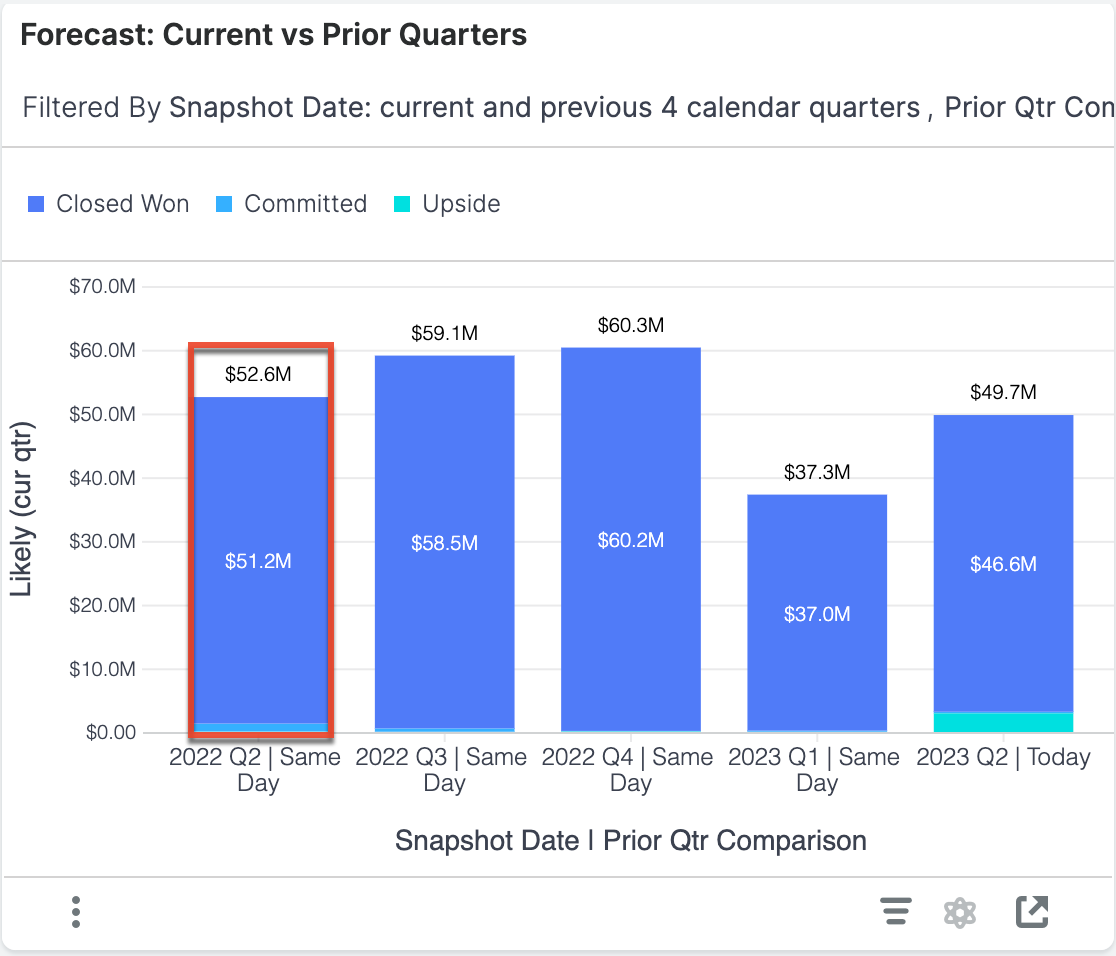
This report shows a historical comparison of your total pipeline for the current quarter compared to the pipeline as it looked on the same day in prior quarters. The y-axis displays the likely revenue for opportunities with an expected close date in each quarter. This report does not include any opportunities that are "Closed Lost" or have moved to the "Closed Lost" stage, so you only see your "Closed Won" opportunities and open pipeline.
|
Likely (curr qtr) Definition The sum of Committed Definition Opportunities that are considered committed are ones with a Forecast Stage of "Include". Upside Definition Opportunities that are considered as upside are ones with a Forecast Stage of "Exclude". Example Interpretation for Bar Highlighted in Chart On this day in 2022's second quarter, all opportunities that had an expected close date in Q2 of 2022 had a likely revenue of $52.6M. |
Each bar is further segmented by "Closed Won" versus open pipeline (e.g., Committed and Upside) so that you can see how your open pipeline changes throughout the time period.
Examples of insights that can be gained from this report include:
- How does the total pipeline for this quarter compare to the same day from prior quarters?
Funnel Flow Analysis
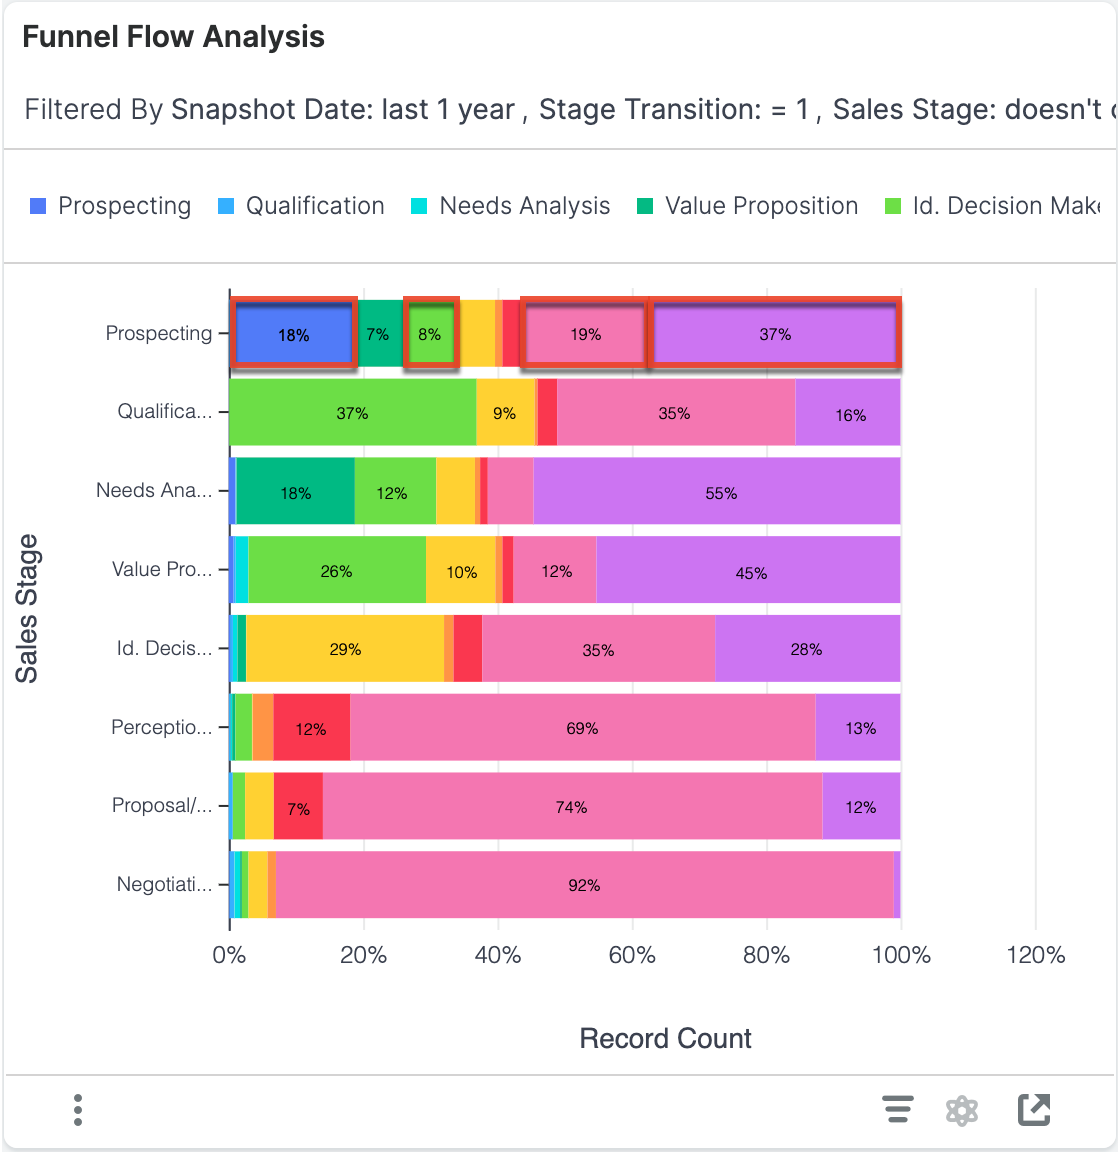
This report illustrates how opportunities flowed through your sales cycle. The y-axis represents the sales stage of an opportunity on some snapshot date in the past year when a transition occurred, and the color stacks represent which stage the opportunity transitioned to next (i.e., if the opportunity transitions between multiple stages within a year, it will appear in multiple segments). This report does not include "Closed Won" and "Closed Lost" as starting sales stages.
|
Example Interpretation for Data Highlighted in Chart For all records that were in the "Prospecting" stage when a stage transition occurred, 18% transitioned to "Prospecting" (dark blue), 19% transitioned directly to "Closed Won" (pink), and 37% transitioned directly to "Closed Lost" (purple). To further demonstrate what is happening in these segments, consider the following opportunities (for these examples, the day you are viewing the report [i.e., "today"] is January 1, 2024): Opportunity A Opportunity A was created and the stage was set to "Prospecting" on September 30, 2023. The opportunity stayed in that stage until December 10, when Sarah moved the opportunity to "Id. Decision Makers". Enhanced Forecasting detected that the sales stage changed—and that it changed from "Prospecting" to "Id. Decision Makers"—and added the opportunity to the Id. Decision Makers segment (light green) in the report above. But by the end of the day on December 10, Sarah realized she should not have moved the opportunity and moved it back to "Prospecting". Enhanced Forecasting updated the sales stage that Opportunity A transitioned to from "Id. Decision Makers" to "Prospecting", and therefore moved the opportunity from the light green segment to the Prospecting segment (dark blue) in the report above. Since Enhanced Forecasting retains only the final state of the data at the end of the day, the transition to "Id. Decision Makers" was forgotten. Opportunity B Opportunity B was created and the stage was set to "Prospecting" on July 10, 2023. The opportunity stayed in that stage until July 15, when Sarah moved the opportunity to "Id. Decision Makers" after she met with the customer. Enhanced Forecasting detected that the sales stage changed—and that it changed from "Prospecting" to "Id. Decision Makers"—and adds the opportunity to the Id. Decision Makers segment (light green) in the report above. But then Sarah learned that the customer was so impressed with the meeting that they signed the contract on the same day (July 15), so Sarah moved the opportunity to "Closed Won". Enhanced Forecasting updated the sales stage that Opportunity B transitioned to from "Id. Decision Makers" to "Closed Won", and therefore moved the opportunity from the light green segment to the Closed Won segment (pink) in the report above. Since Enhanced Forecasting retains only the final state of the data at the end of the day, the transition to "Id. Decision Makers" was forgotten. Opportunity C Opportunity C was created and the stage was set to "Prospecting" on January 5, 2023. The opportunity stayed in that stage until March 10, when Sarah moved the opportunity to "Closed Lost". On all snapshot dates between January 5 and March 10, the opportunity was in "Prospecting"; in the March 10 snapshot, the opportunity was in "Closed Lost". Enhanced Forecasting detected that the sales stage changed—and that it changed from "Prospecting" to "Closed Lost"—and added that opportunity to the Closed Lost segment (purple) in the report above. Opportunity D Opportunity D was created and the stage was set to "Prospecting" on November 15, 2022. The opportunity stayed in that stage until December 26, 2022, when Sarah moved the opportunity to "Qualifications". This opportunity was not represented in the report above because the stage did not transition in the last year. Opportunity E Opportunity D was created and the stage was set to "Prospecting" on December 13, 2023. The opportunity has not changed stage. This opportunity was not represented in the report above because the stage did not transition. |
Examples of insights that can be gained from this report include:
- Where are deals dropping out of the sales process?
- Are we investing too much time on deals that we eventually lose? (i.e., a high percentage of transitions to "Closed Lost" in late stages of the sales process)
Funnel Velocity & Conversion
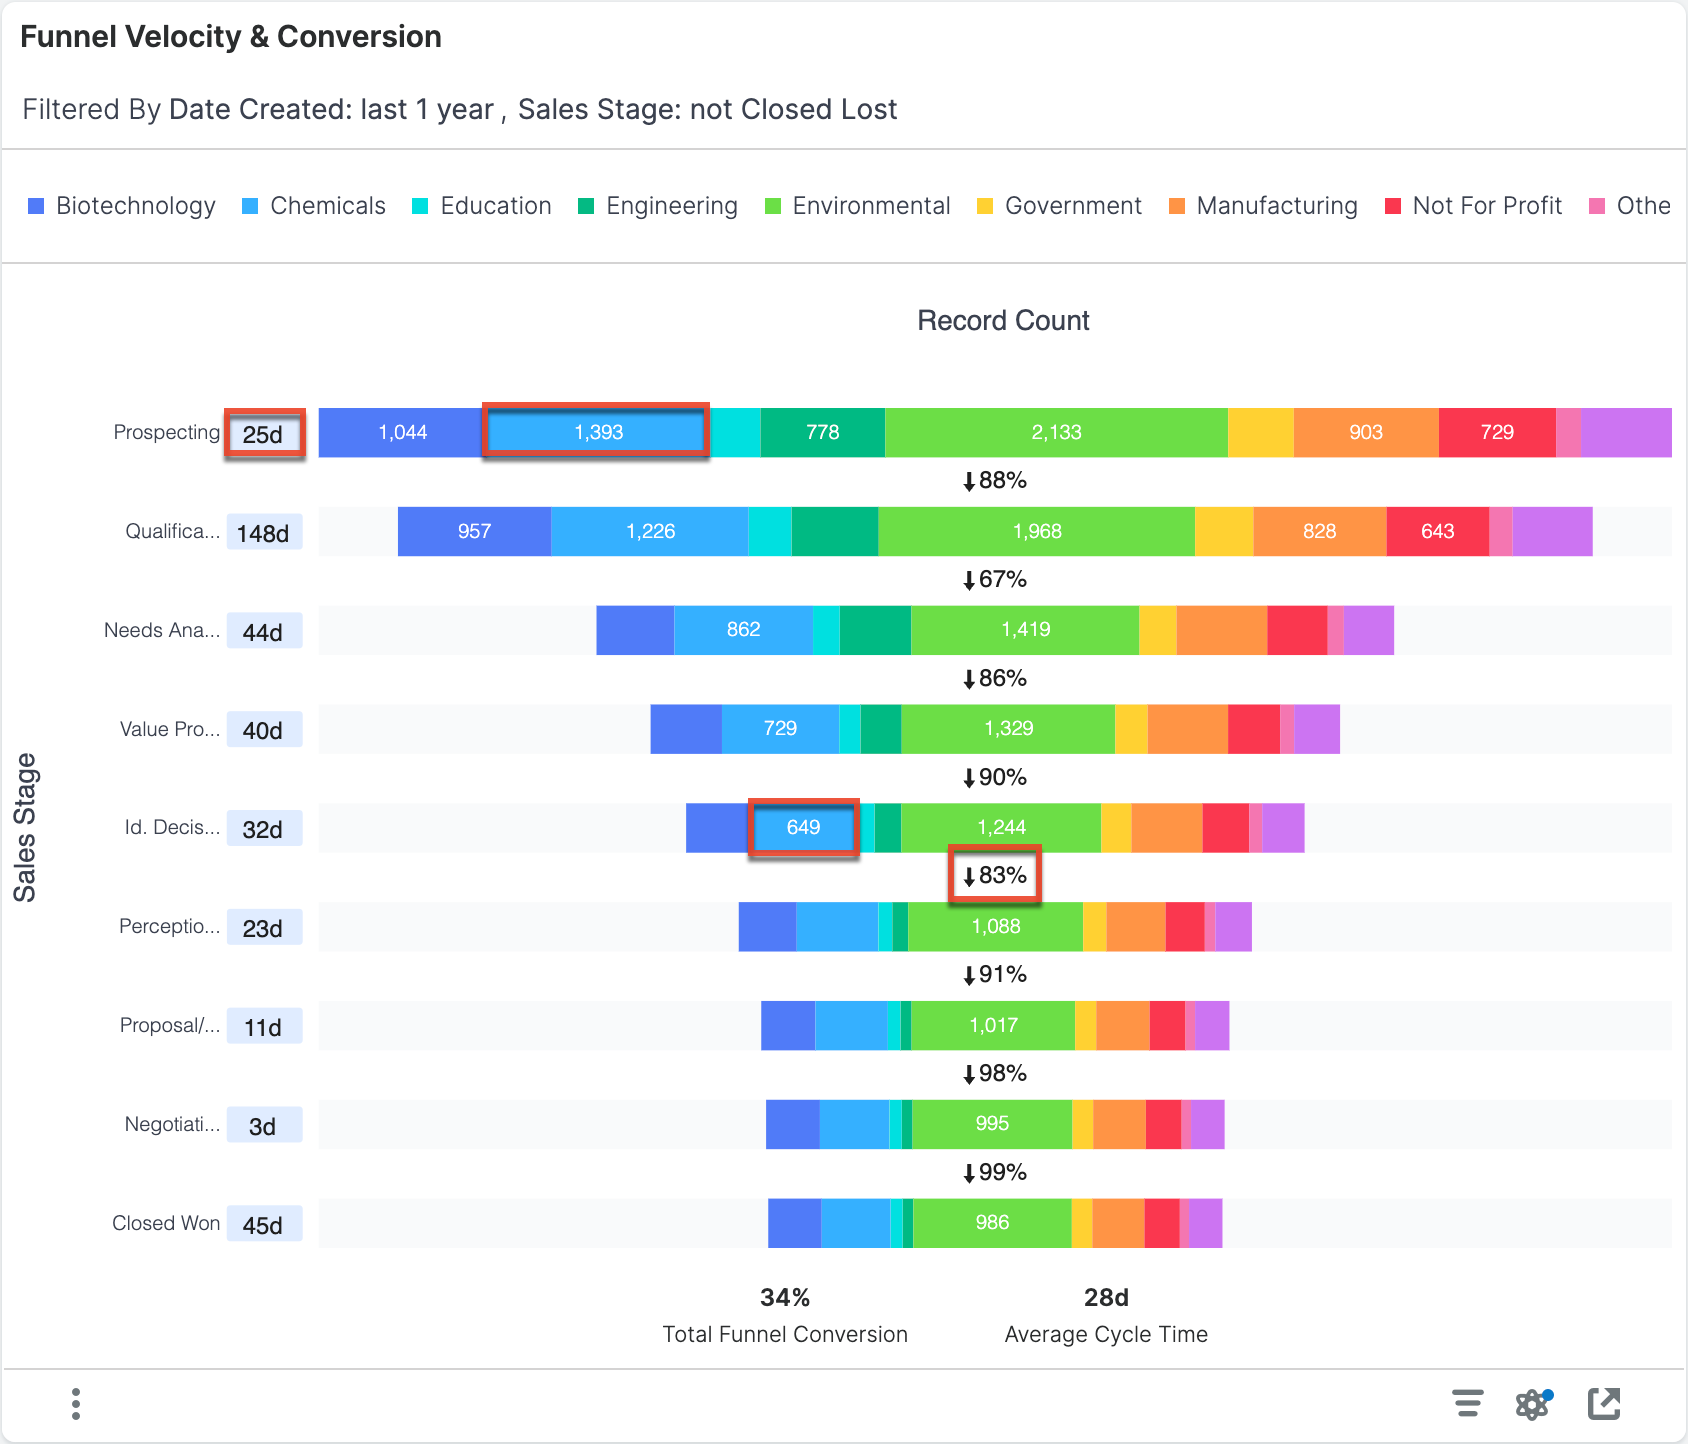
The Funnel Velocity & Conversion report provides a type of "cohort analysis", which looks at what happens to all opportunities that were created in the past year as they pass through the Sales Stages from top to bottom. This chart excludes opportunities that are in the "Closed Lost" stage so that you can focus on your active pipeline.
The values along the left side of the funnel show the average number of days that the opportunities spent in that stage of the sales cycle. These values consider only the records that flowed through a given stage and ignore records that either have not progressed that far, skipped that stage in the sales process, or spent less than a day in the stage.
Each funnel stage (horizontal bar) provides the number of records that progressed at least that far in the sales cycle divided by industry. Records do not need to have spent time in the stage to be considered in this count (e.g., all records that are in the Qualification stage are also included in the Prospecting record count because the records have advanced beyond the Prospecting stage). The percentage between the stages indicates what percent of the previous stage made it at least as far as the next stage.
At the bottom of the funnel, there are two summary metrics.
|
Summary Metrics Definitions
Example Interpretation for Data Highlighted in Chart For example, in the chart above, all records that were created in the past year that are in or have been in the Prospecting stage have spent 25 days in that stage. Any opportunities that skipped that stage (e.g., and started in the Qualification stage) do not impact the 25-day calculation. In the chemicals industry, there are 1,393 records that were created in the past year that were either created in the Prospecting stage or a later stage. There are also 649 records that reached at least the Id. Decision Makers stage in the chemicals industry. Any records that did not reach the Id. Decision Makers stage were marked as "Closed Lost" at some point earlier in the cycle. Of the opportunities that reached the Id. Decision Makers stage, 83% of them progressed at least as far as the next stage, Perception Analysis. In the chart above, the 34% funnel conversion value indicates that 34% of the opportunities that entered the funnel at any stage reached the final (i.e., "Closed Won") stage. The number of opportunities that were "Closed Lost" will impact this calculation. All the opportunities that reached the final stage, regardless of where they started, spent an average of 28 days in the sales funnel. The cycle time does not include any opportunities that were "Closed Lost". |
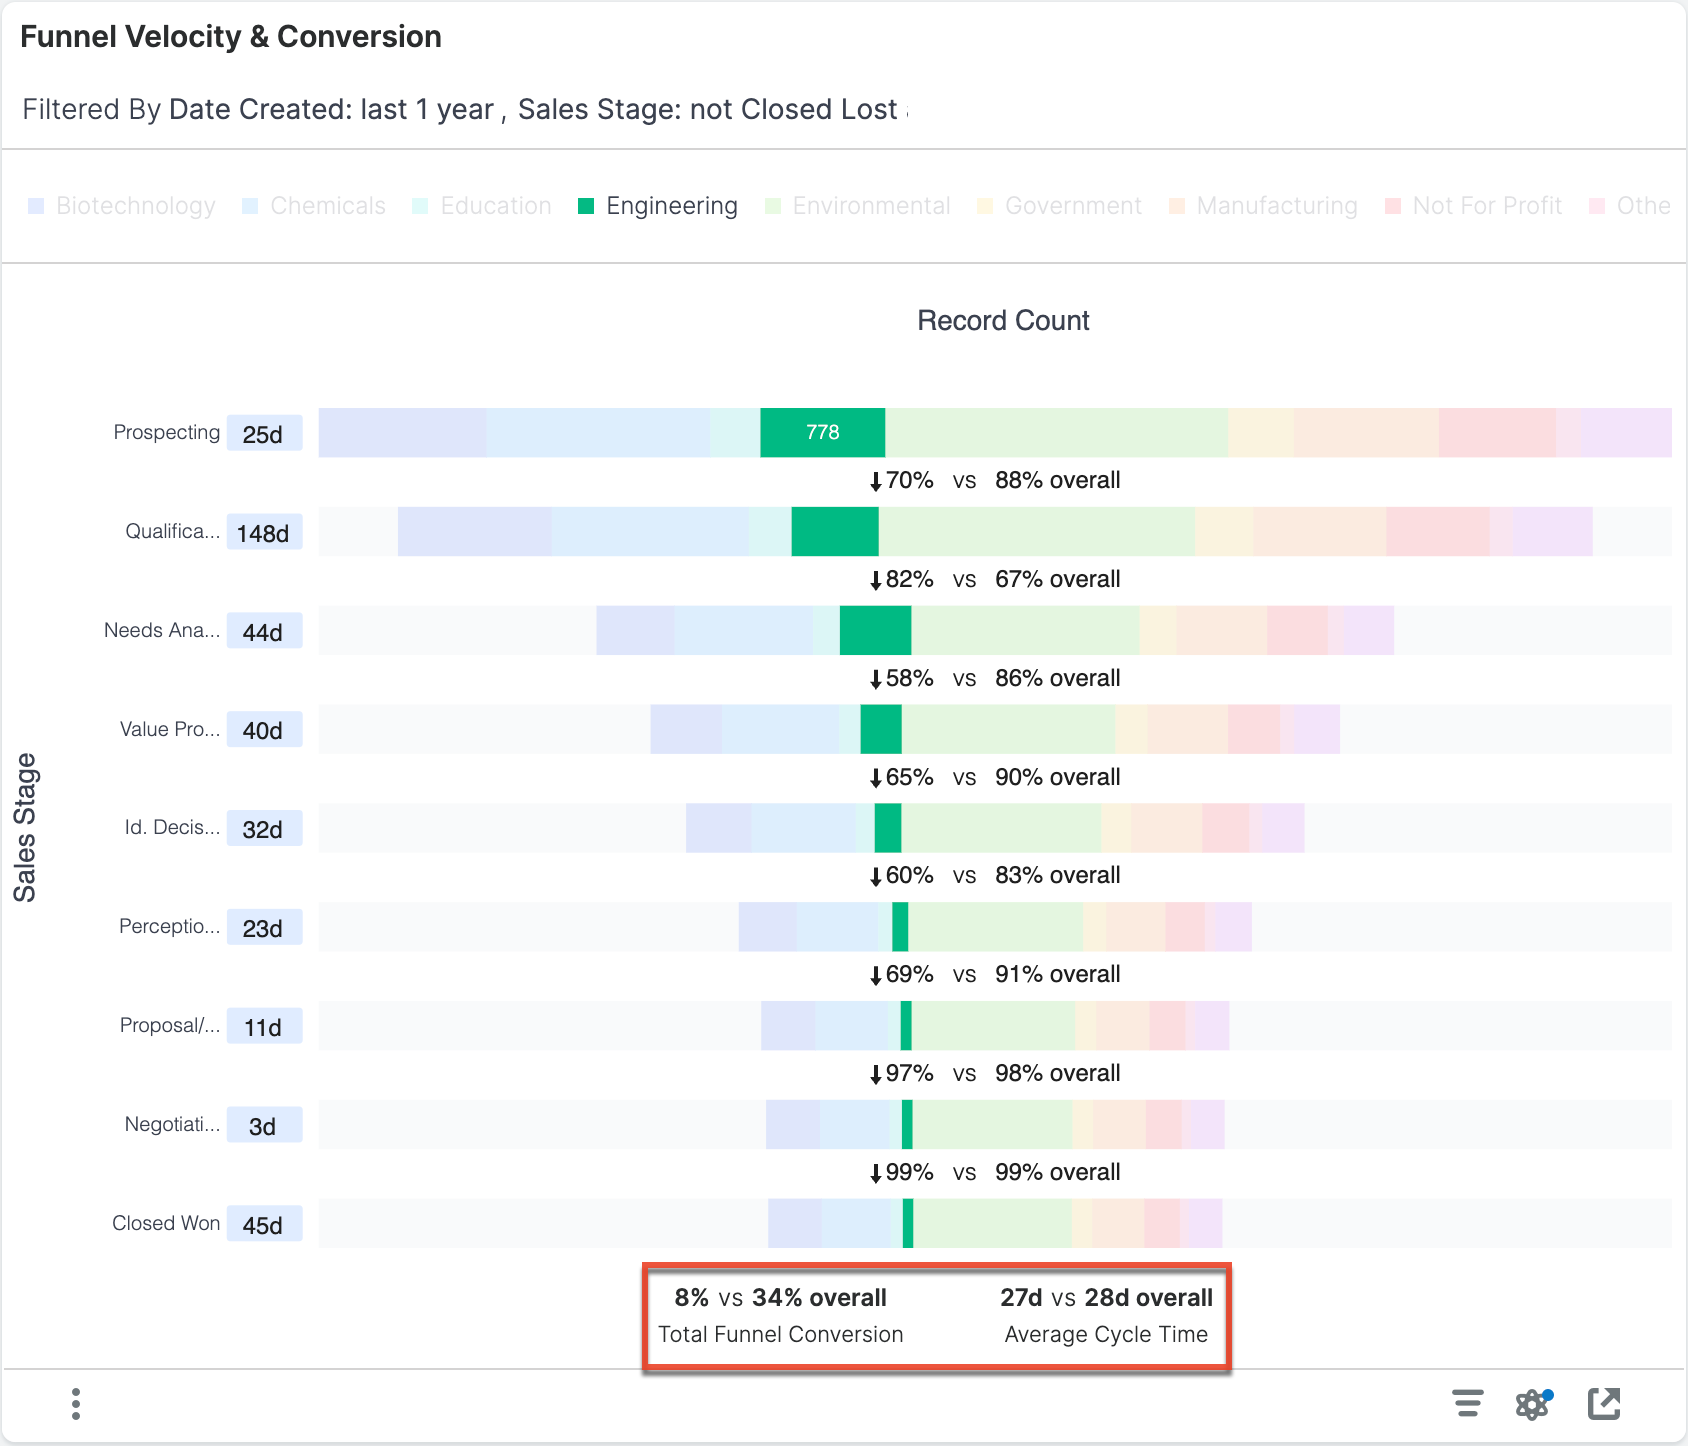
The funnel is segmented by industry. You can also analyze one or more segments of the funnel at a time by either clicking on the label in the legend or one of the segments in the report. The unselected data will fade, and the statistics will update to show a comparison of the statistics for the industry versus the aggregate data. This feature allows you to see how a segment of the data compares with the whole. For example, the engineering industry shows a lower-than-average funnel conversion rate and a slightly shorter-than-average cycle time.
Examples of insights that can be gained from this report include:
- What are our conversion rate (count) and average sales cycle length for opportunities created last year?
- Where are deals spending the most time in the sales cycle?
Note that this report does not support drill-down.
Funnel Velocity & Revenue Conversion
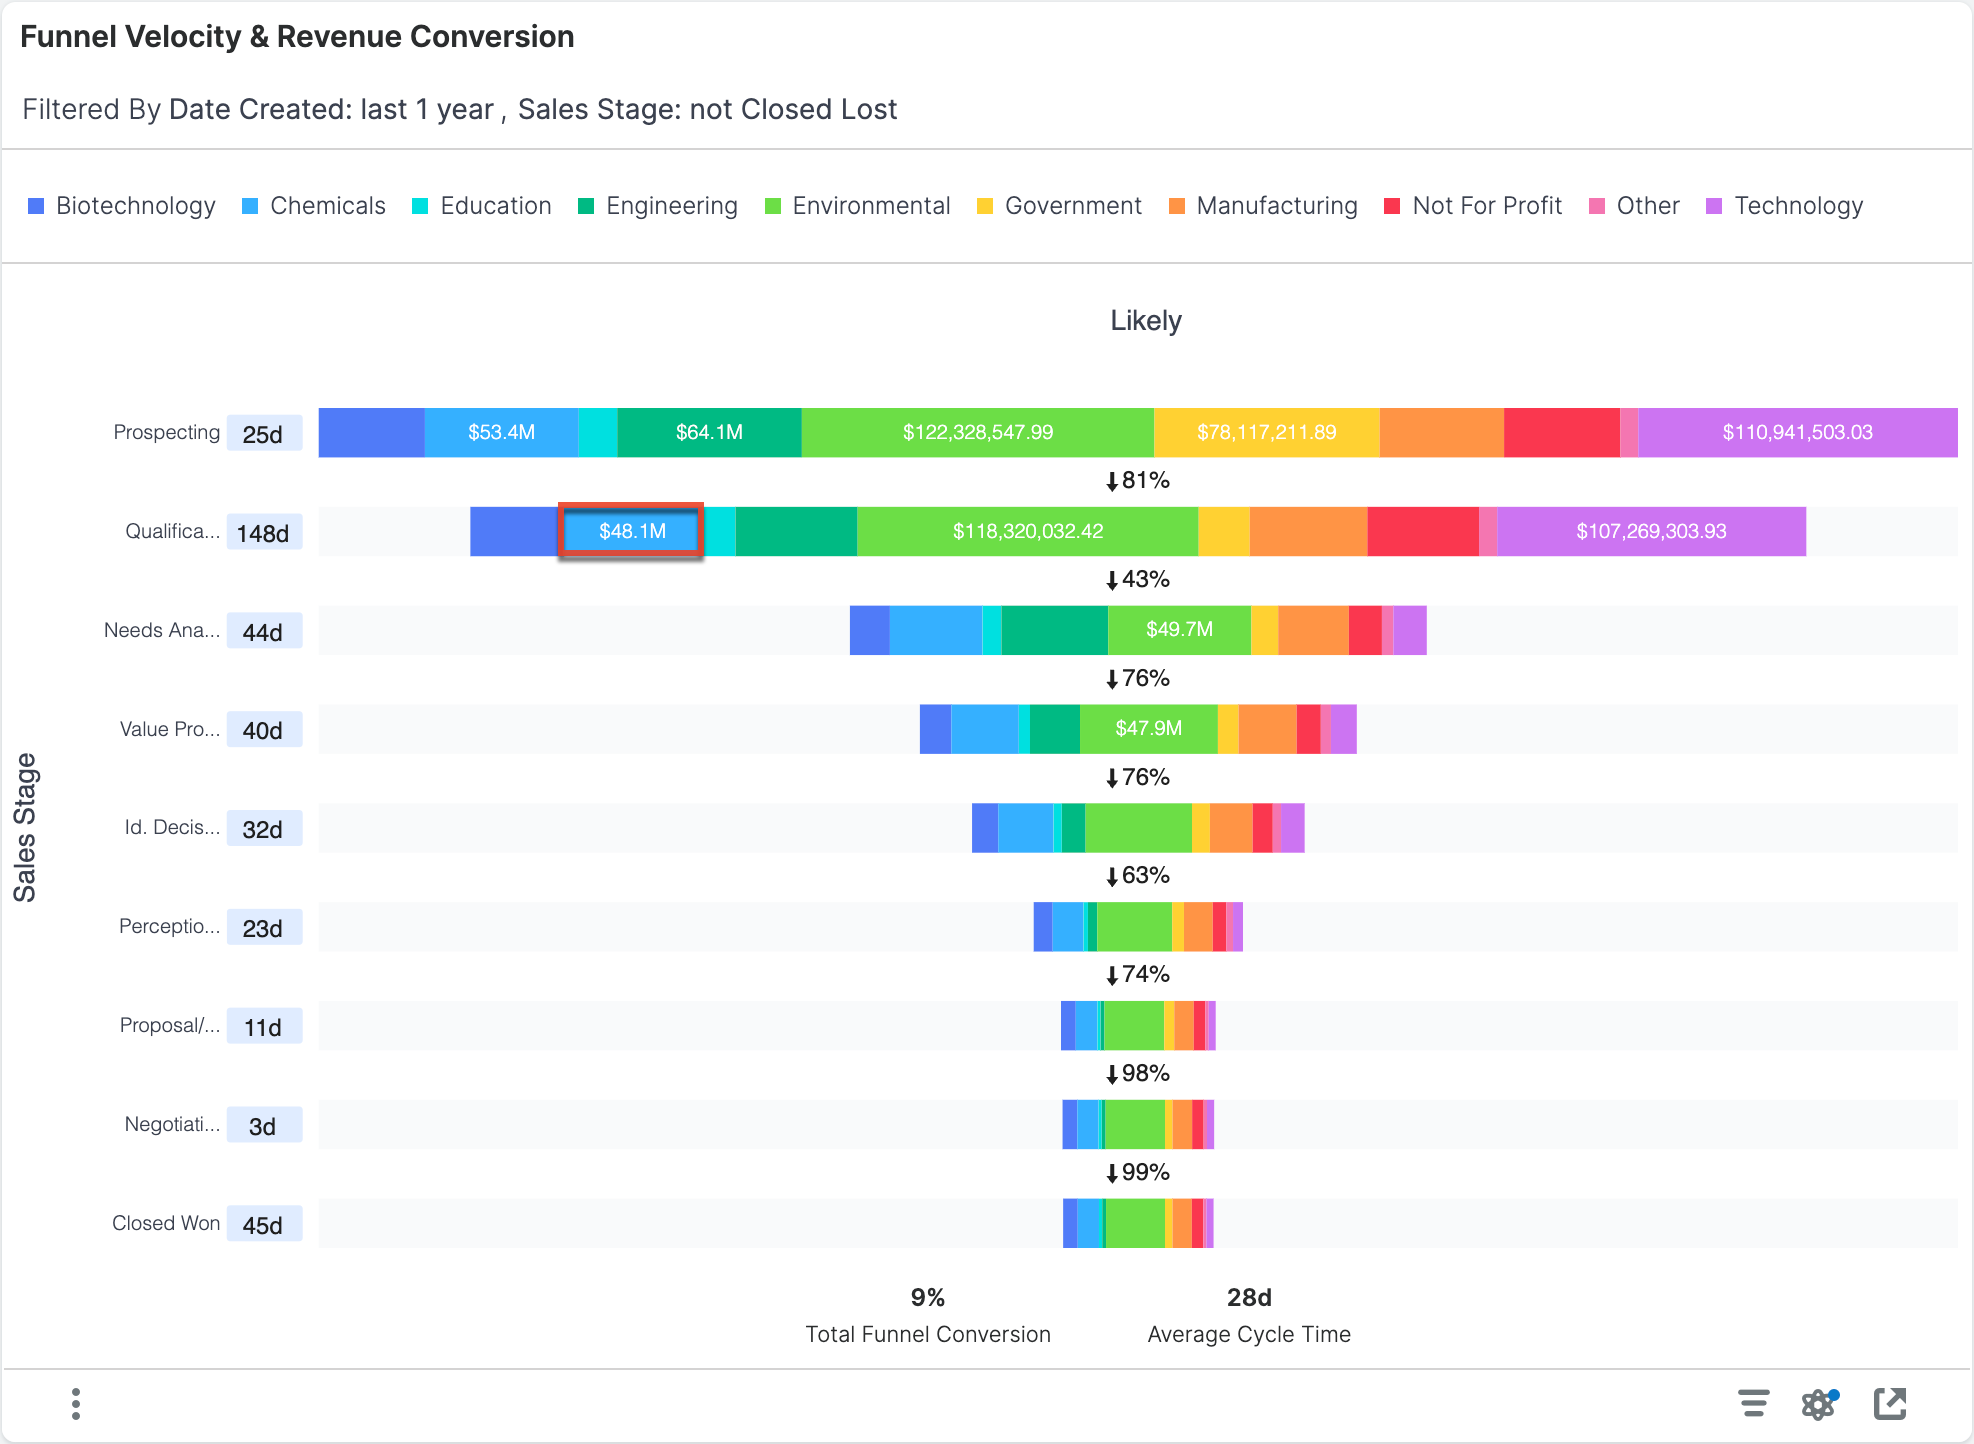
This report is similar to the Funnel Velocity & Conversion Report, except instead of viewing conversion based on opportunity count, they are based on the sum of revenue dollars. This report uses the opportunities that were created in the past year and excludes opportunities that are in the "Closed Lost" stage. The revenue associated with each record is the revenue when the record entered the stage.
|
Example Interpretation for Data Highlighted in Chart If an engineering industry opportunity has a Likely value of $25,000 and then is transitioned to the Qualification stage, that opportunity is contributing $25,000 to the $48.1M total for the engineering industry Qualification stage. If that opportunity is then changed to have a Likely value of $50,000, the $48.1M value will not update. If the opportunity is later transitioned to the Needs Analysis stage, the opportunity contributes $50,000 towards the total Likely for the engineering industry segment. |
Examples of insights that can be gained from this report include:
- What are our conversion rate (revenue) and average sales cycle length for opportunities created last year?
- Where are deals spending the most time in the sales cycle?
For a more detailed explanation of funnel metrics, see the description for the Funnel Velocity & Conversion Report above.
Note that this report does not support drill-down.
Idle Opportunities Trend Monthly
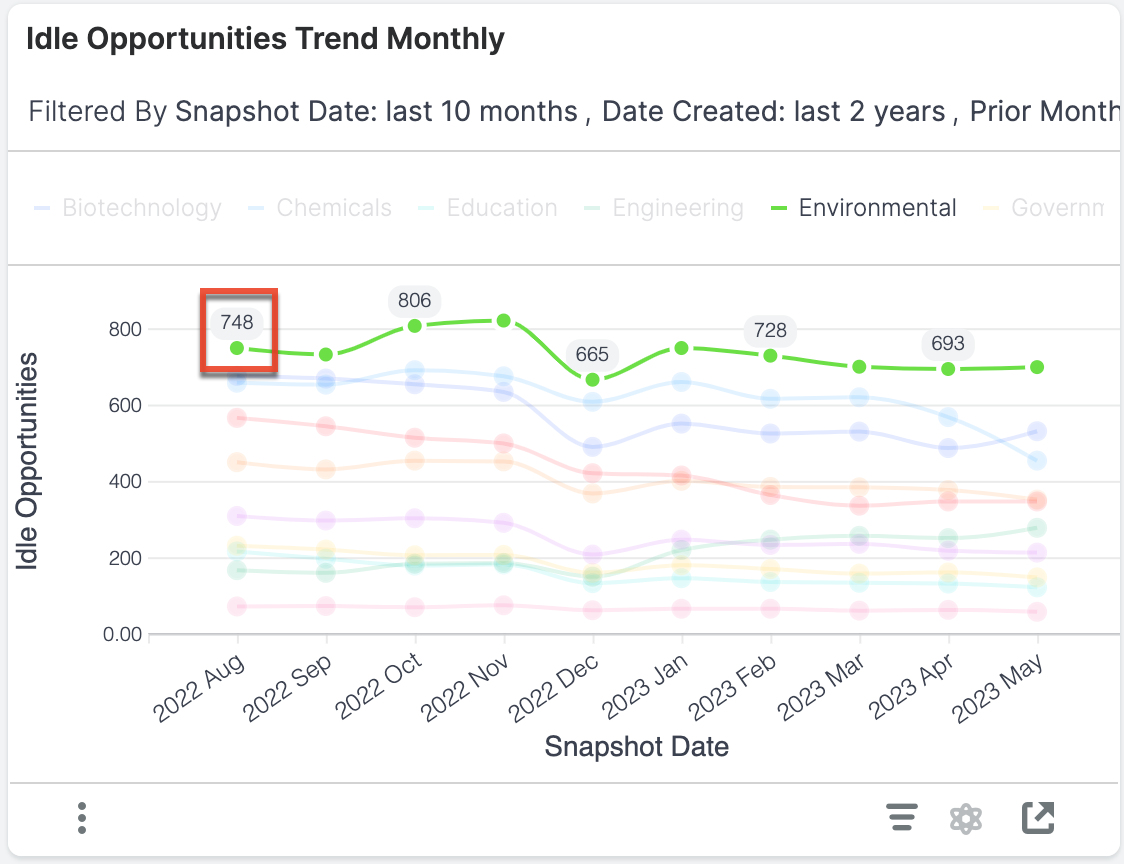
This report shows the number of idle opportunities on the last day of the trailing ten months. This report only includes opportunities created within the last 2 years.
|
Idle Opportunity Definition Idle opportunities are opportunities that have been in the same stage for more than 30 days. Example Interpretation for Point Highlighted in Chart On the last day of August 2022, there were 748 idle opportunities in the environmental |
Examples of insights that can be gained from this report include:
- Is the number of stalled opportunities trending up or down within key business segments?
Pipeline Creation Trend
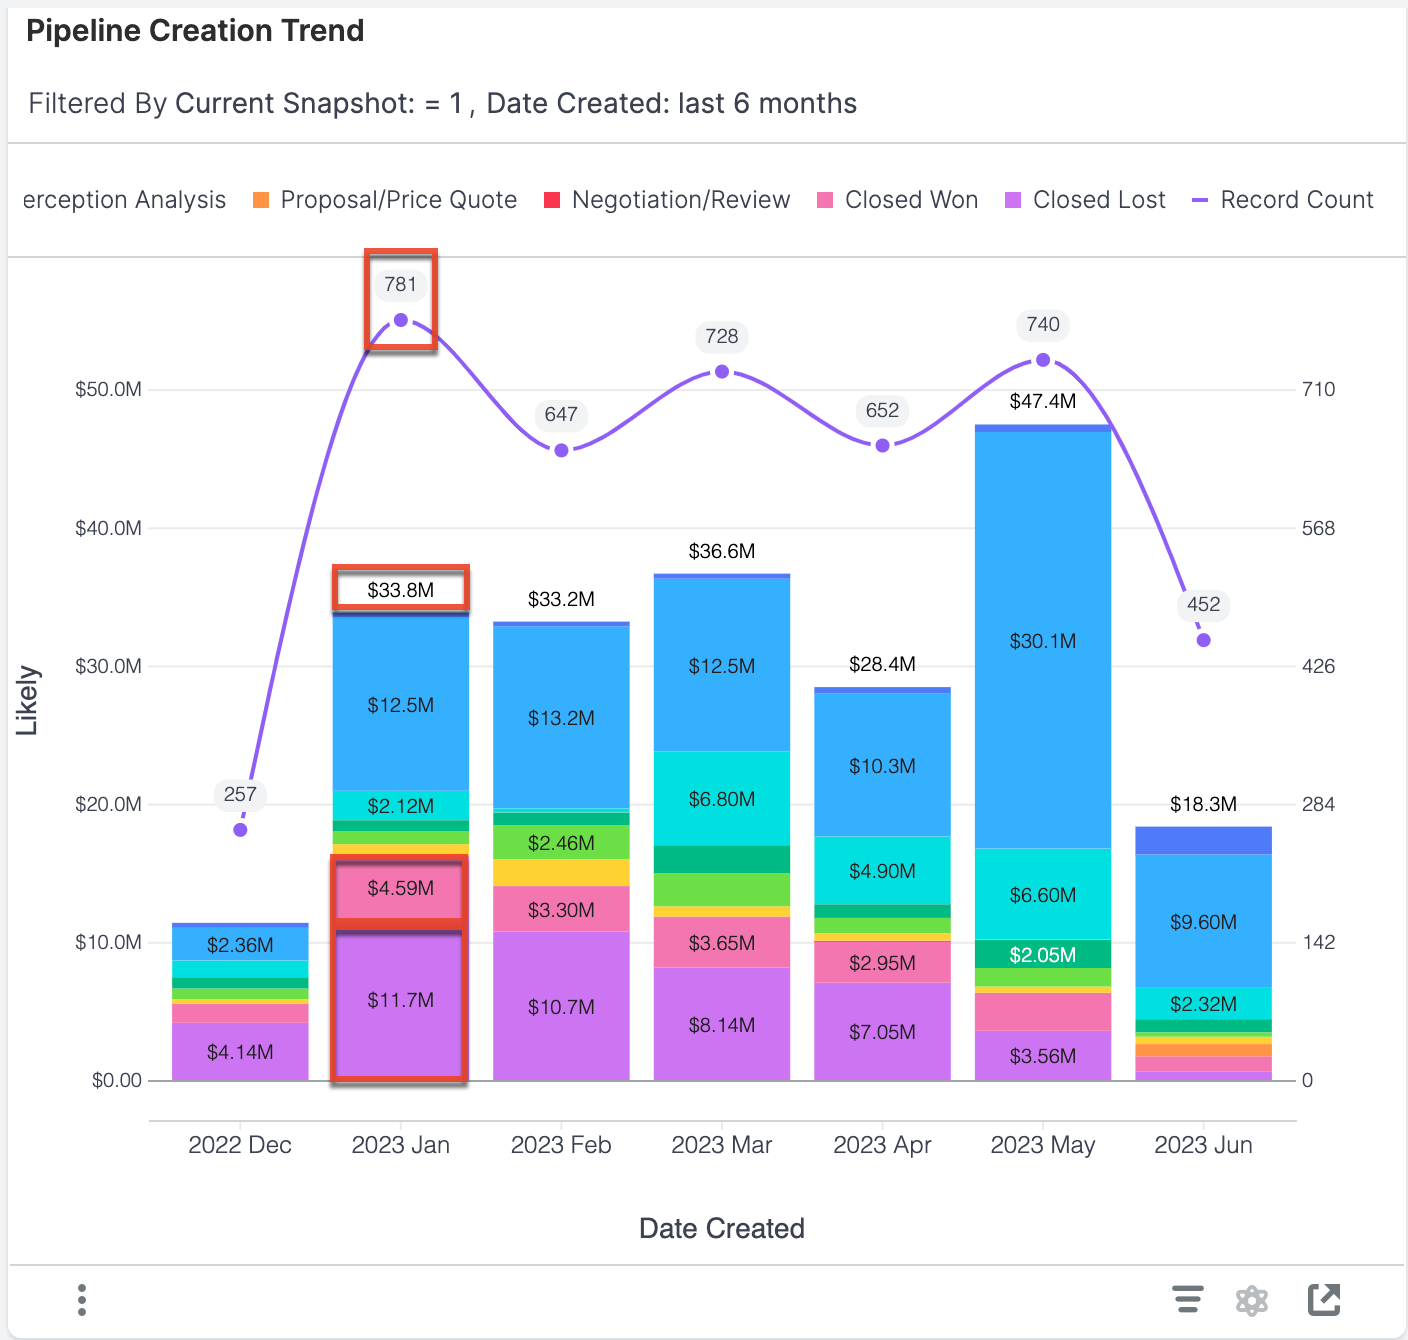
The Pipeline Creation Trend report shows the total pipeline generated in the last 6 months. The opportunities that were created in the last 6 months are segmented by the month in which they were created. The pipeline revenue (bar graph) represents the current value of all opportunities created in the specified month. The breakdown of sections within the column represents what Sales Stage those opportunities are currently in so that you can see how quickly the pipeline matures relative to when it was created. The count of opportunities (line chart) provides a visual representation of how many records were created in each month and allows you to quickly assess the relationship between the pipeline amount and the number of sales opportunities generated, while also facilitating a relative comparison of deals and pipeline generated from month to month.
|
Example Interpretation for Data Highlighted in Chart In January 2023, 781 opportunities were created. As of today, those opportunities represent $33.8M of pipeline. Since they were created, $4.59M has converted to "Closed Won", $11.7M is "Closed Lost" and the rest remains as open pipeline. |
Examples of insights that can be gained from this report include:
- Is our pipeline generation trending up or down over the past 6 months?
- Are sales deals progressing with adequate velocity after creation?
Pipeline: Current & Next Quarter
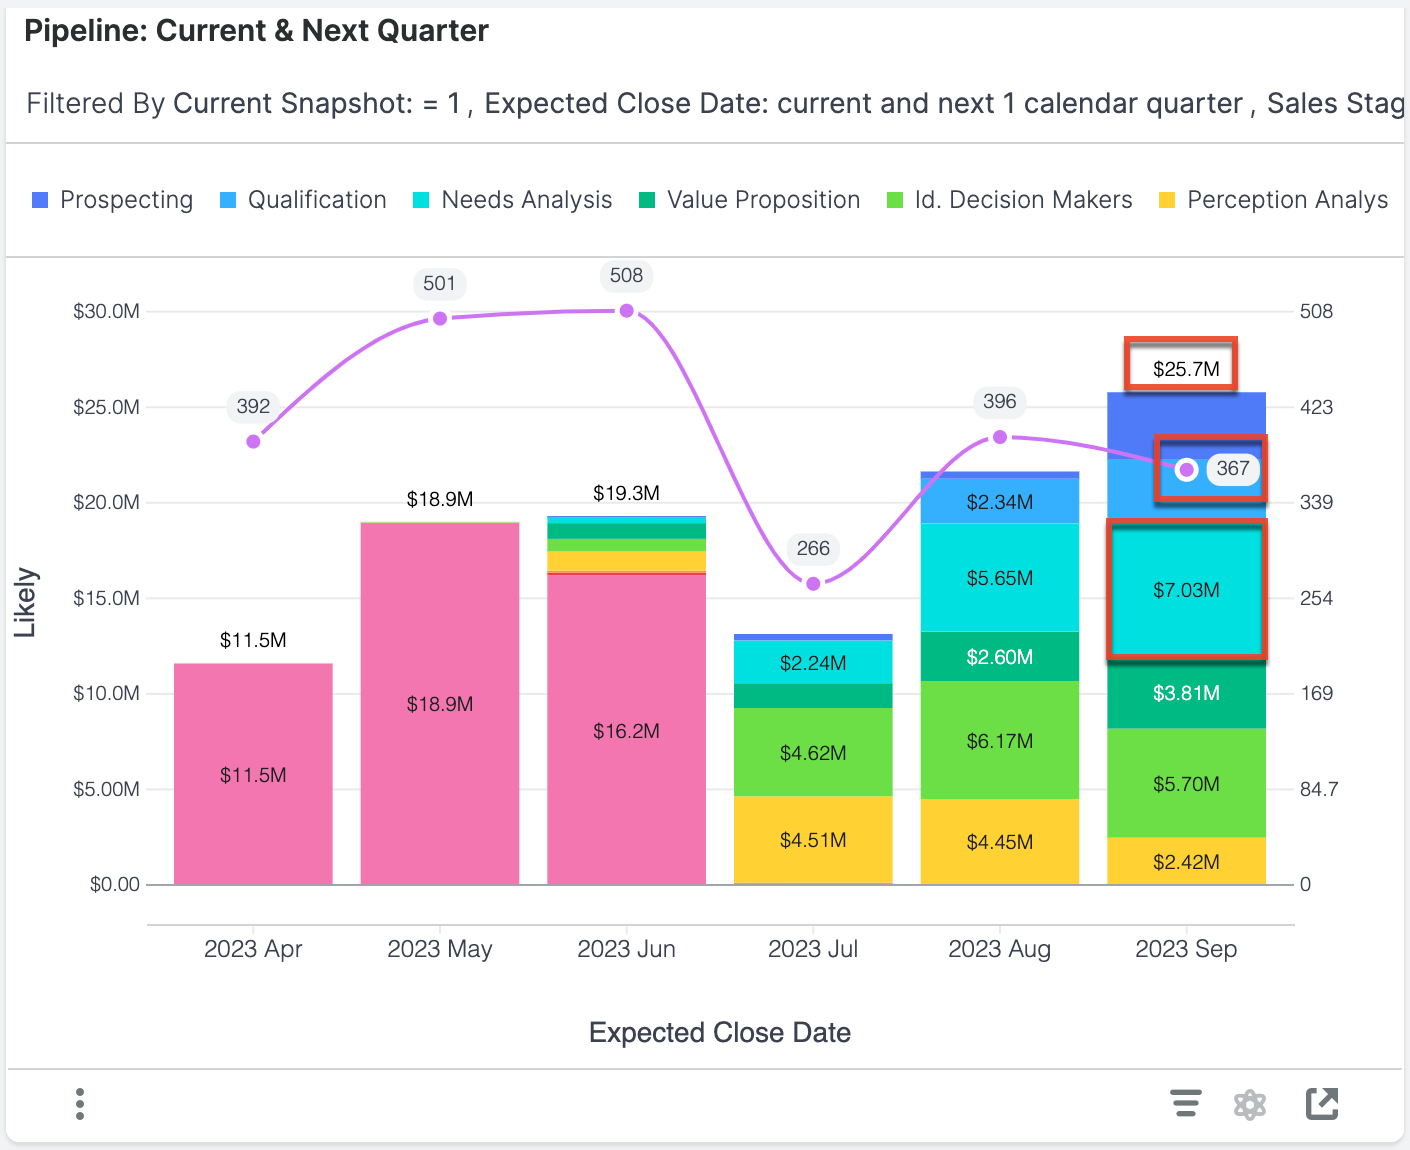
This report provides visibility into the total pipeline remaining for the current quarter and the total pipeline for the next quarter in terms of revenue (bar graph) and opportunity count (line plot). The pipeline for each quarter is determined by the expected close date of the opportunities. Pipeline revenue is further broken down by Sales Stage to indicate pipeline maturity. This chart excludes opportunities that are in the "Closed Lost" stage so that you can focus on your active pipeline.
Each column represents the total likely revenue for opportunities in your Sugar instance with an expected close date in the given month.
|
Example Interpretation for Data Highlighted in Chart There are 367 opportunities with an expected close date in September 2023. They have a total likely revenue of $25.7M and $7.03M worth of opportunities are still in the Needs Analysis stage. |
Examples of insights that can be gained from this report include:
- Do we have enough remaining pipeline to hit our targets?
- Do we have adequate pipeline coverage to hit next quarter's targets?
- Are we focusing enough effort on maturing next quarter's pipeline?
Sales Cycle Trend
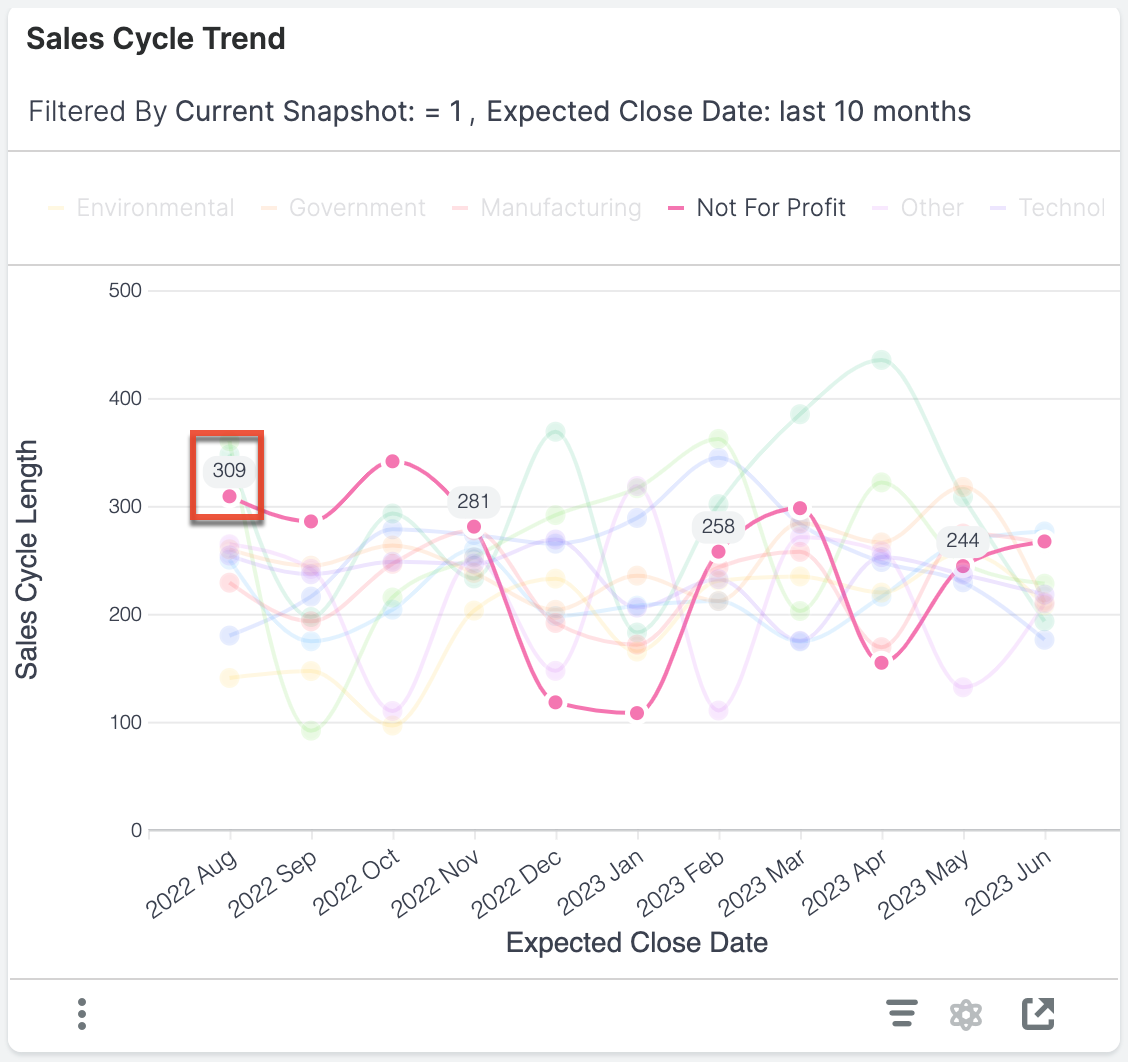
This report shows the sales cycle trend for opportunities with expected close dates in each of the last 10 months so that you can spot positive or negative trends within key business segments.
|
Sales Cycle Length Definition The sales cycle length is the number of days between when a "Closed Won" opportunity was created and its expected close date. The average sales cycle length takes the average of these values for opportunities with an expected close date in the indicated month and segment. Example Calculation for Point Highlighted in Chart Average Sales Cycle Length = (Total number of days between the |
Examples of insights that can be gained from this report include:
- In which segments of the business is our average sales cycle length increasing or decreasing?
Sales Velocity by Stage
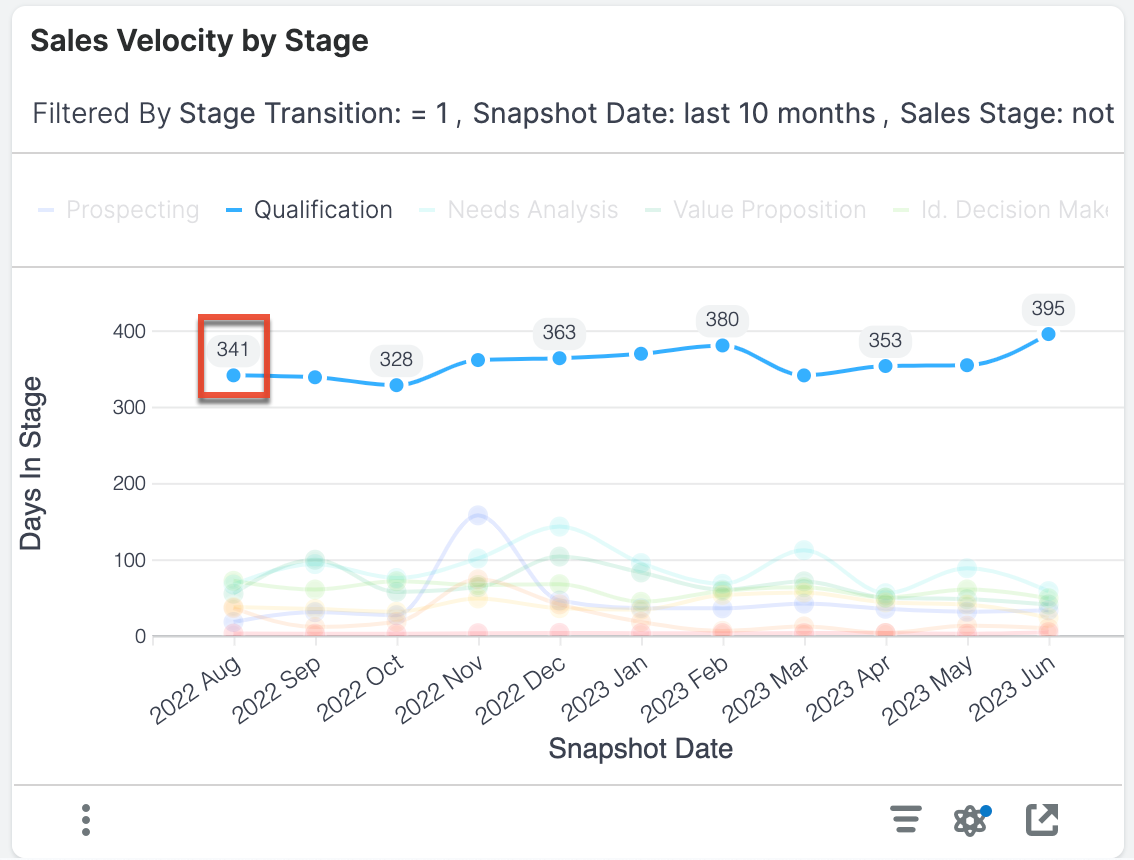
This report shows the average days spent in each stage of your sales process for opportunities that transitioned through those stages during the last 10 months. This allows viewers to spot trends where sales velocity is increasing or decreasing in specific areas of the sales process and in which month the sales process moved fastest (i.e., had the fewest days in a stage). This report does not include any opportunities that are "Closed Won" or "Closed Lost".
|
Days in Stage Definition The days in stage is the number of days the opportunity spent in a given stage before transitioning to another stage. The average is calculated by dividing the sum of the days spent in a given stage in the indicated month by the number of opportunities in that stage in the indicated month. Example Calculation for Point Highlighted in Chart Average days in stage = (Total number of days opportunities spent in the Qualification stage in August 2022) ÷ (Number of opportunities in the Qualification stage in August 2022) = 341 days. |
Examples of insights that can be gained from this report include:
- Where are deals spending the most time in the sales process?
- Are our efforts to increase velocity around the qualification process having success?
Top 10 Reps for Idle Opportunities
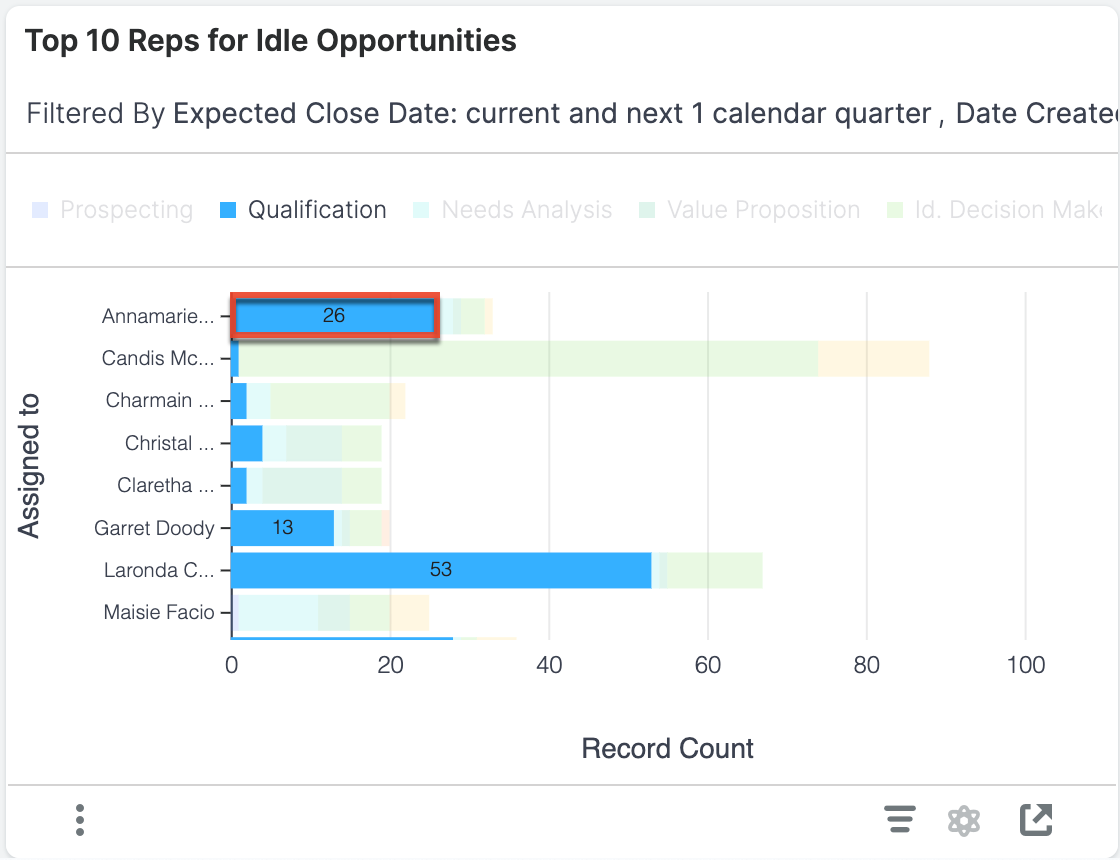
This report shows the 10 sellers with the current highest number of idle opportunities expected to close within the current and next calendar quarter to help you identify individuals who may be struggling to progress their sales deals. This report only includes opportunities created within the last 2 years.
|
Idle Opportunity Definition Idle opportunities are opportunities that have been in the same stage for more than 30 days. Example Interpretation for Bar Highlighted in Chart Annamarie has 26 opportunities in the Qualification stage that have been in that stage for more than 30 days. |
Examples of insights that can be gained from this report include:
- Which reps have the greatest number of stalled opportunities expected to close in the current and next quarter?
Top 20 Committed Opportunities This Quarter
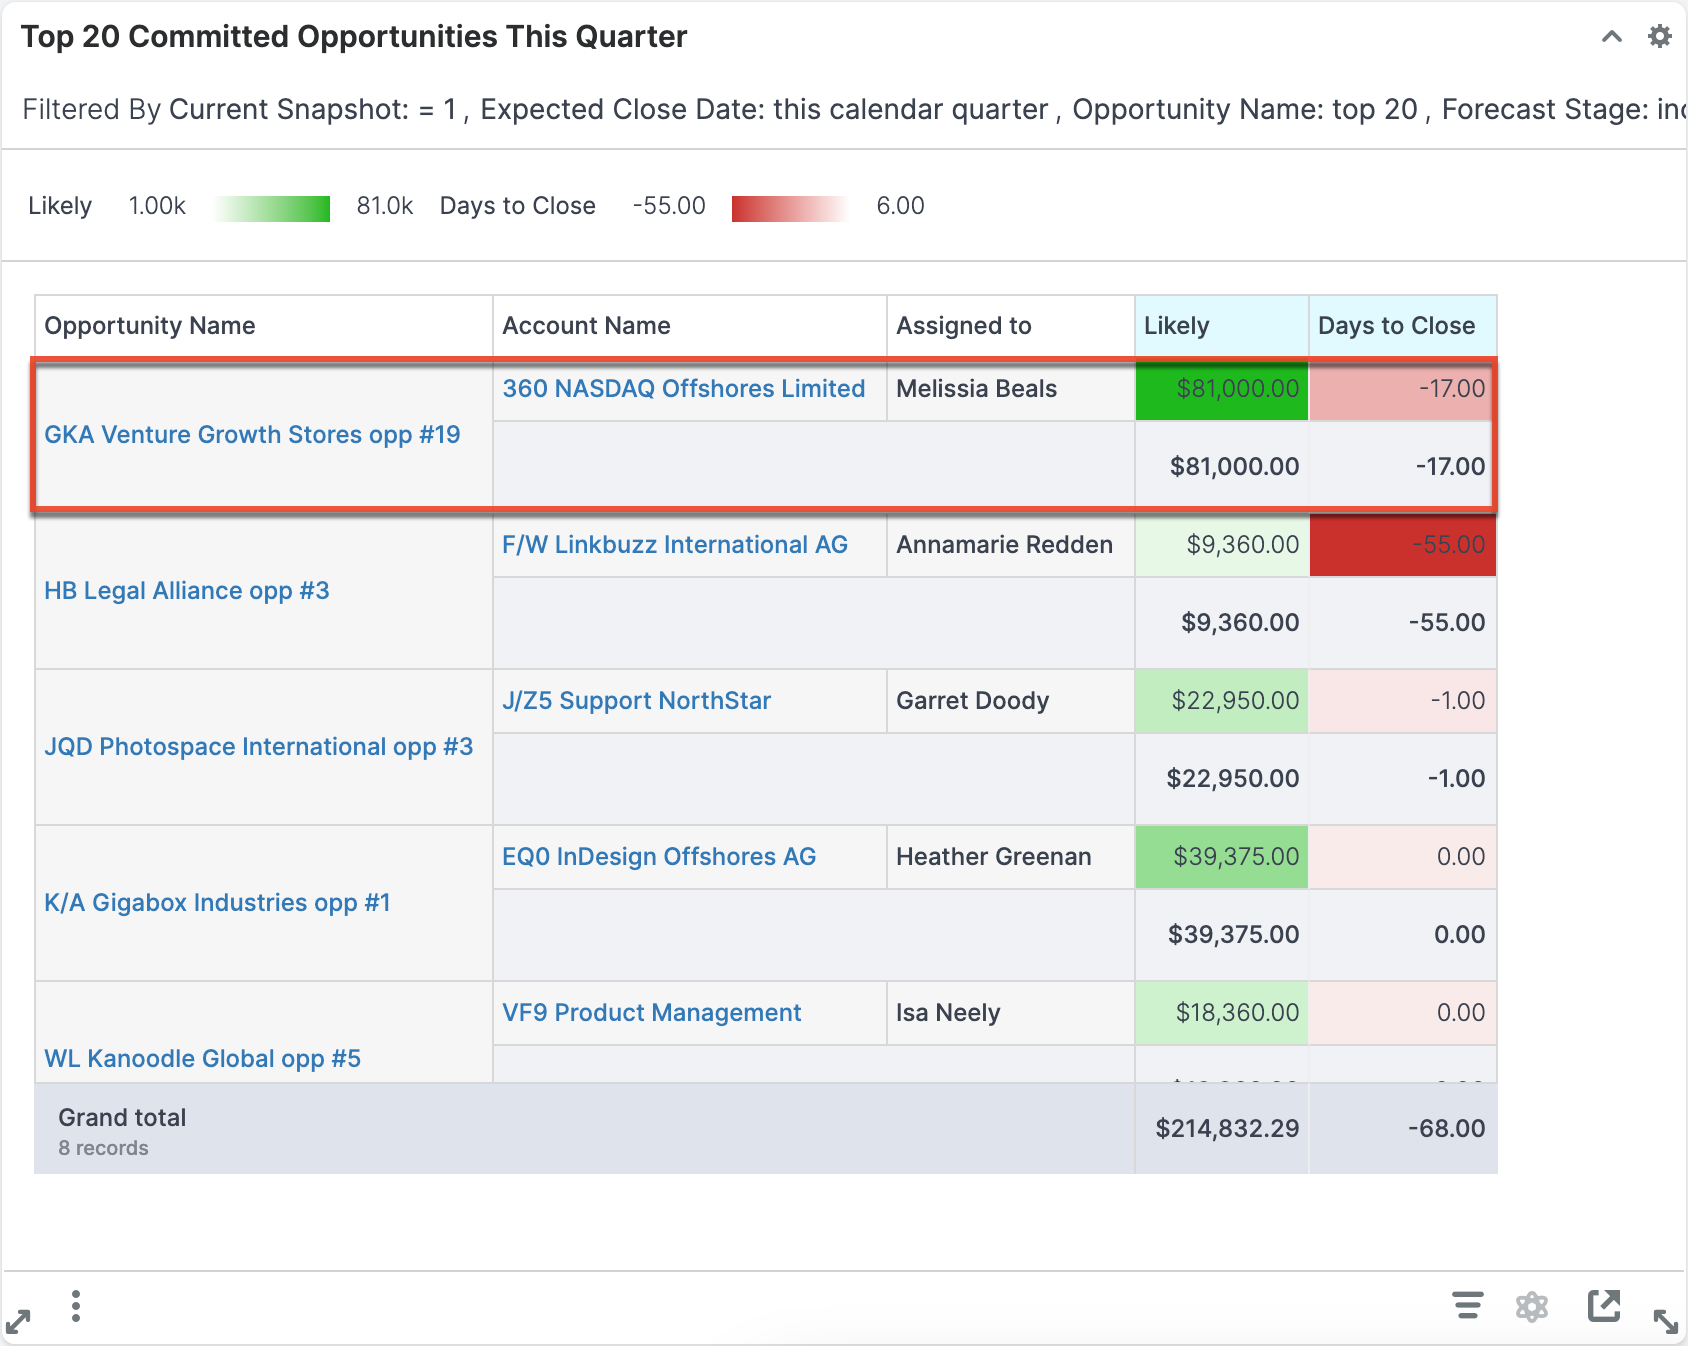
This report displays the top 20 committed opportunities with the highest total likely revenue for the current quarter. These are opportunities that have an expected close date within the current quarter, are included in the forecast (i.e., the Forecast Stage field is set to "Include"), and are not yet "Closed Won" or "Closed Lost".
|
Example Interpretation for Data Highlighted in Chart The opportunity called "GKA Venture Growth Stores opp #19" is assigned to Melissia. While it has a high likely revenue, the days to close is negative. This means that Melissia the opportunity has an expected close date of 17 days ago. You can use this information to follow up with Melissia about the status of that highly lucrative opportunity. |
Examples of insights that can be gained from this report include:
- Which opportunities are going to produce the most revenue?
- How long until the top opportunities are expected to close?
Top 20 Upside Opportunities This Quarter
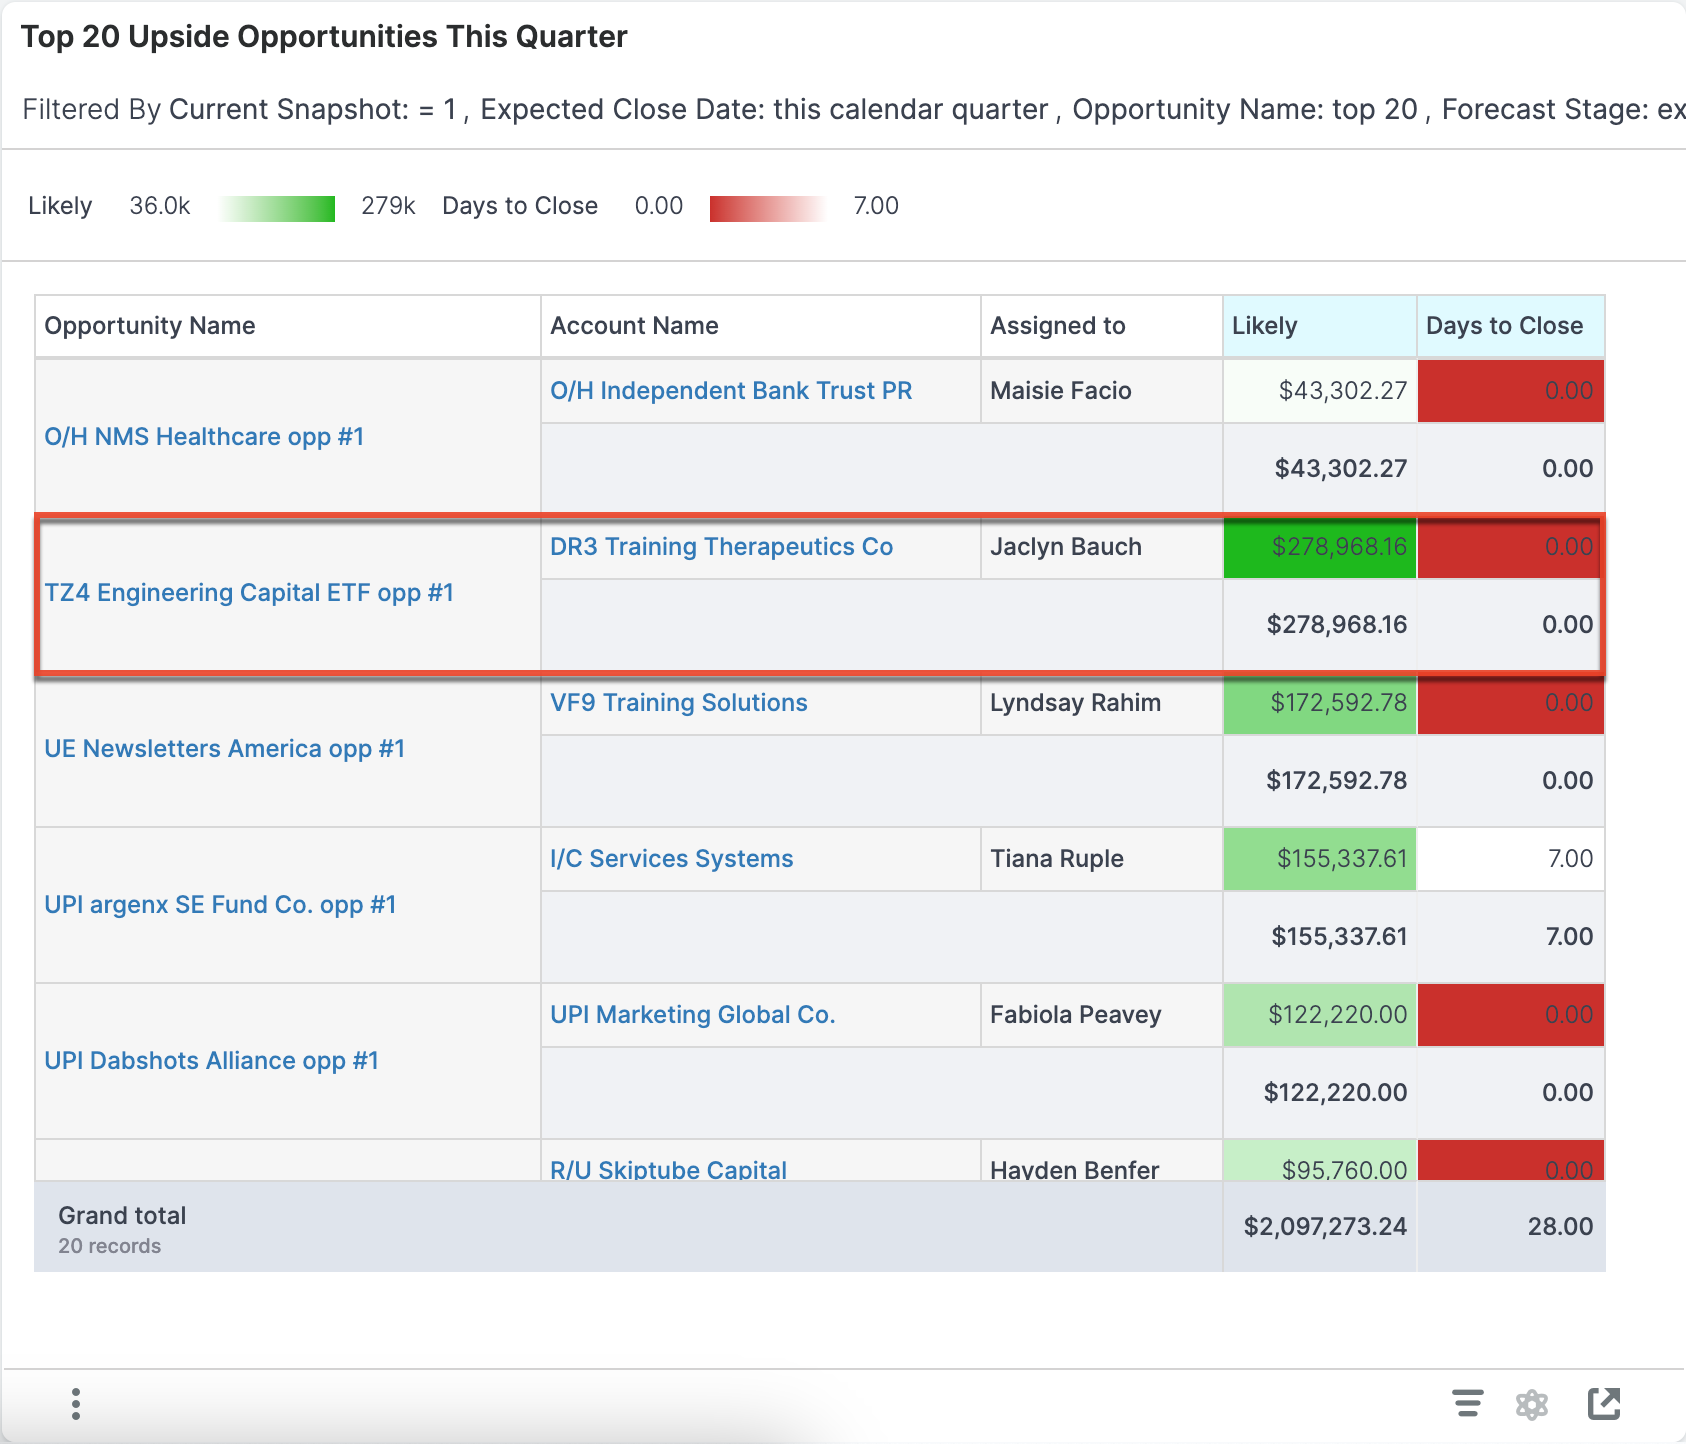
This report displays the top 20 upside opportunities with the highest total likely revenue for the current quarter. These are opportunities that have an expected close date within the current quarter, are not committed to the forecast (i.e., the Forecast Stage field is set to "Exclude"), and are not yet "Closed Won" or "Closed Lost".
|
Upside Definition An upside opportunity is an open opportunity that has an expected close date within this quarter but was not committed to the forecast (i.e., the Forecast Stage is set to "Exclude"). Example Interpretation for Data Highlighted in Chart The opportunity called "TZ4 Engineering Capital ETF opp #1" is assigned to Jaclyn. The likely revenue is impressive and would be great to pull into this quarter. But today is the expected close date (i.e., zero days to close). Jaclyn should reach out to that opportunity and see if she can close the deal or adjust the record with a new expected close date. |
Examples of insights that can be gained from this report include:
- Which opportunities that were not previously forecasted are going to produce the most revenue?
Win Rate Trend
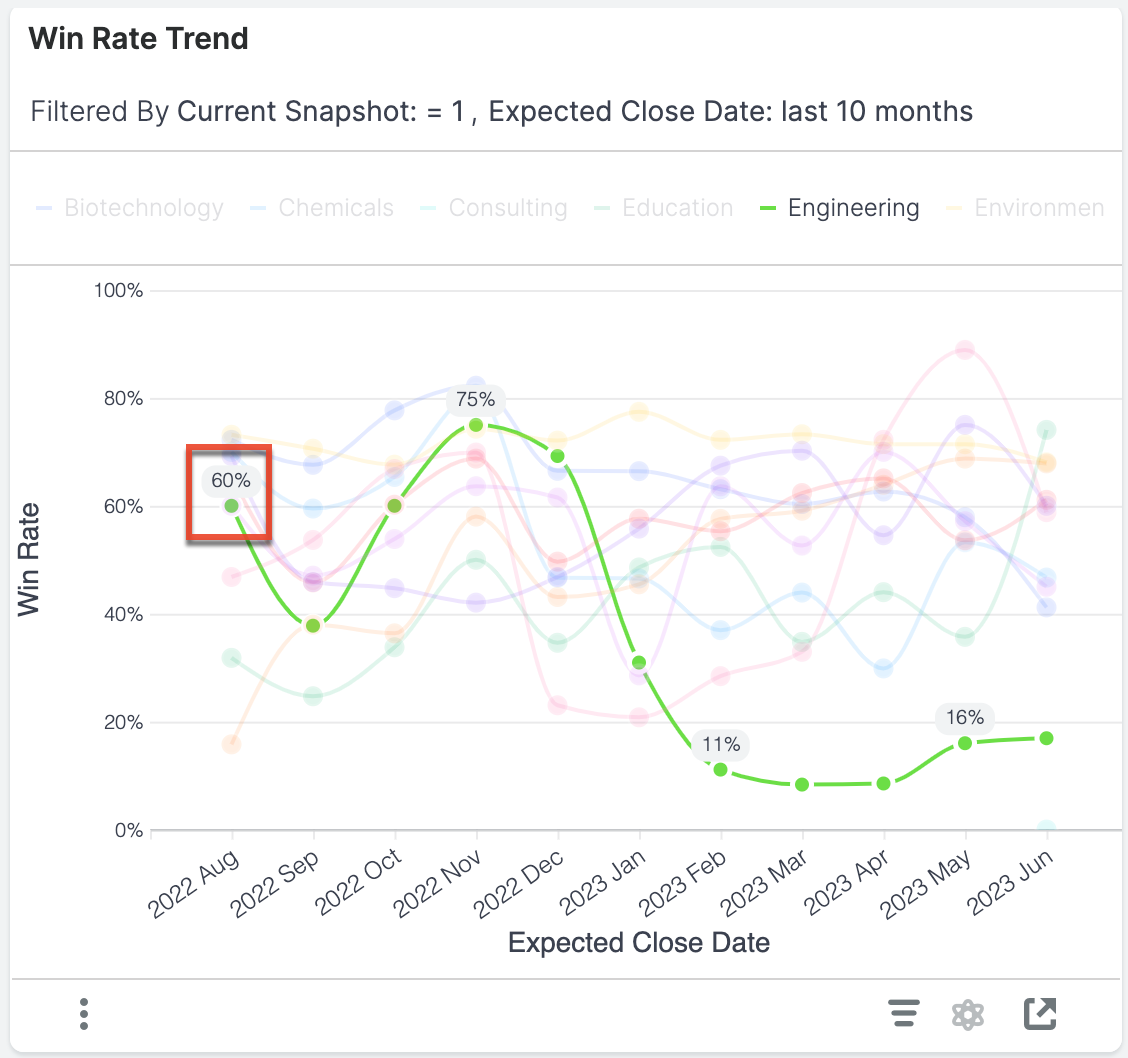
This report shows the win rate for opportunities with expected close dates in each of the last 10 months so that you can spot positive or negative trends within key business segments.
|
Win Rate Definition The win rate is the number of "Closed Won" opportunities with an expected close date in the indicated month and segment divided by the total number of closed items with an expected close date in the indicated month and segment. Closed items include items that are in the "Closed Won" or "Closed Lost" stage. Example Calculation for Point Highlighted in Chart Win Rate = (Number of "Closed Won" opportunities with an |
Examples of insights that can be gained from this report include:
- In which segments of the business is our win rate increasing or decreasing?
Opportunity Details
The Opportunity Details report is used as the target for many of the out-of-the-box visualizations. If you have permission to drill into reports, this is one of the reports you will be taken to in order to view more details on the segment. The pivot table shows the Assigned to, Account Name, Sales Stage, Opportunity Name, Expected Close Date, Likely, and Days in Stage for the opportunities in the segment you drilled into.
Forecast Changes Details
The Forecast Changes Details report is used as the target for the Current Quarter Forecast Changes Since Last Week report. If you have permission to drill into reports, when you click on a segment of the Forecast Changes report, you will be directed to this pivot table where you will see the Snapshot Date, Assigned to, Account Name, Opportunity Name, Forecast Origin (i.e., how the opportunity entered the forecast), Forecast Exit (i.e., how the opportunity exited the forecast), and Expected Close Date for the opportunities in the segment you drilled into.
Sugar Fields Used in Reports
When using the out-of-the-box Enhanced Forecasting reports, the reports will display only if all the fields are present in your Sugar instance and the name has not been altered. If a particular report is not rendering, use the chart below to determine if you are missing a required field.
| Opportunities module fields | Accounts module field | ||||||||||
| Report | Account Name | Assigned to | Date Created | Expected Close Date | Forecast Stage | ID | Likely | Opportunity Name | Type | Sales Stage | Industry |
| Average Deal Size Trend | S | ✔ | ✔ | S | ✔ | ✔ | |||||
| Win Rate Trend | S | ✔ | S | ✔ | ✔ | ||||||
| Sales Cycle Trend | S | ✔ | ✔ | S | ✔ | ✔ | |||||
| Sales Velocity by Stage | S | S | ✔ | S | |||||||
| Idle Opportunities Trend Monthly | S | ✔ | S | ✔ | ✔ | ||||||
| Top 10 Reps for Idle Opportunities | ✔ | ✔ | ✔ | ✔ | S | ✔ | S | ||||
| Forecast: Current vs Prior Quarters | S | S | ✔ | S | |||||||
| Pipeline: Current & Next Quarter | S | ✔ | ✔ | ✔ | S | ✔ | S | ||||
| Pipeline Creation Trend | S | ✔ | ✔ | ✔ | S | ✔ | S | ||||
| Funnel Velocity & Conversion | S | ✔ | ✔ | S | ✔ | ✔ | |||||
| Funnel Velocity & Revenue Conversion | S | ✔ | ✔ | S | ✔ | ✔ | |||||
| Funnel Flow Analysis | S | ✔ | S | ✔ | S | ||||||
| Forecast Accuracy | ✔ | ✔ | ✔ | ✔ | S | ✔ | S | ||||
| Current Quarter Forecast Changes Since Last Week | S | ✔ | ✔ | ✔ | ✔ | S | ✔ | S | |||
| Top 20 Committed Opportunities This Quarter | ✔ | ✔ | ✔ | ✔ | ✔ | ✔ | S | ✔ | S | ||
| Top 20 Upside Opportunities This Quarter | ✔ | ✔ | ✔ | ✔ | ✔ | ✔ | S | ✔ | S | ||
| Opportunity Details | ✔ | ✔ | ✔ | ✔ | ✔ | ✔ | S | ✔ | S | ||
| Forecast Changes Details | ✔ | ✔ | ✔ | ✔ | ✔ | ✔ | S | ✔ | S | ||
✔: This field is needed for the report.
S: This field is used in the slicer only.
Configure Reports
If your organization does not use a particular stock Sugar field outlined above, you will need to configure the report to use the fields that best represent your data. This configuration can be done by anyone with admin access to Discover. We recommend reaching out to your Sugar partner or Sugar representative if you need help configuring your reports.
Remove Missing Slicers
If the report you want to use is not rendering only because you do not have a slicer field present (e.g., you want to use the Sales Velocity by Stage report but your organization does not use Industry), an admin can configure this in a fairly straightforward way:
- Open the Discover interface.
- Click on the Home icon to open the Library.
- Select the report (e.g., Sales Velocity by Stage) to open it. You will see that the report has missing fields.
- Open the Query Layout panel by clicking the bar chart icon in the upper left corner. Confirm that the only field that is highlighted is in the Slicer section. If so, you can proceed safely. If other fields are highlighted, your report will need more configuration.
- Click the Remove All Missing Fields button. Once the field is removed, your report should render.
- Click the Save button in the top right and select "Save As" to save a copy of your report. Use this copy on your Sugar dashboards.
Additional Reports
The following reports are not available out of the box and require implementation by a partner or Sugar's Professional Services team. Please contact your partner or Sugar representative to get started.
Forecast Tracker
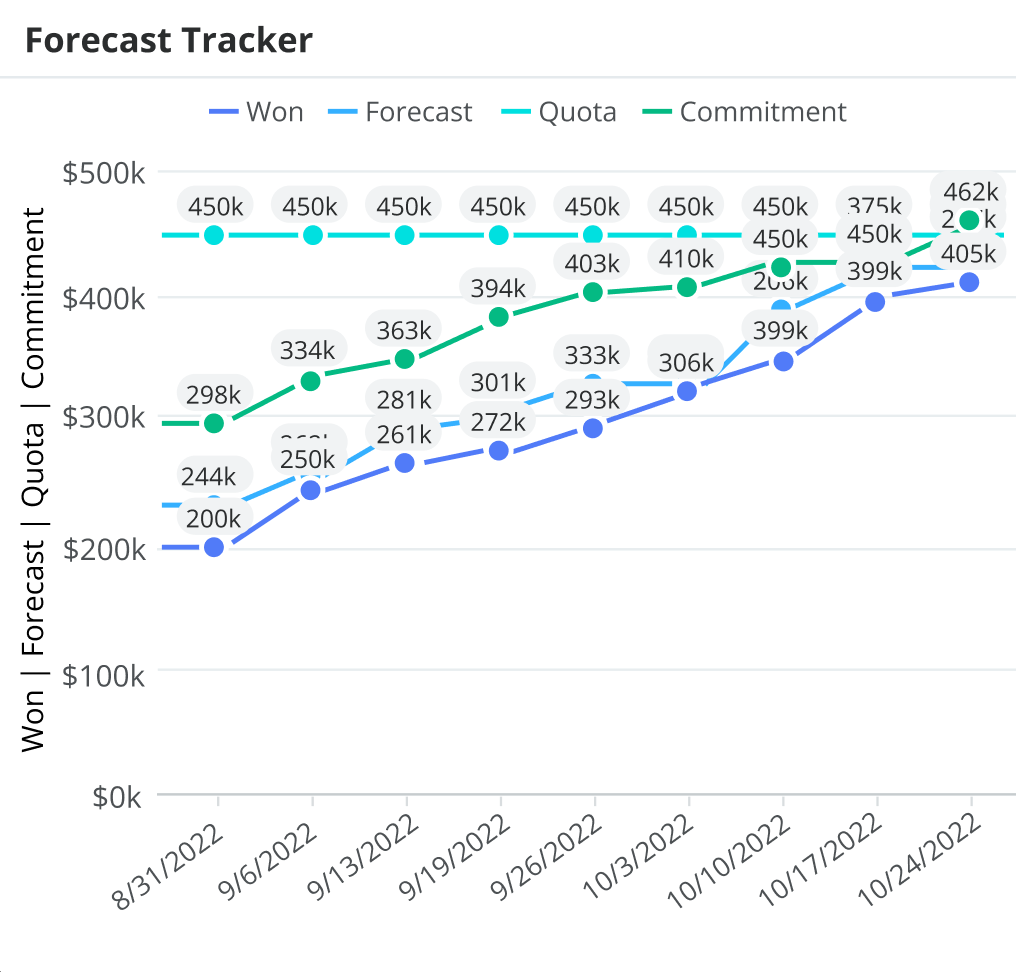
The Forecast Tracker report allows you to visually track how your forecast, commitment, and sales won evolve throughout the time period in relation to your quota. Seeing these metrics on one chart helps you understand how close you are to reaching your quota and whether you have enough opportunities in your forecast to achieve it. In the example above, 8/31/2022 is the first day of the time period you are forecasting on and 10/24/2022 is today's date.
Examples of insights that can be gained from this report include:
- How close am I to reaching my quota for the quarter?
- Do I have enough opportunities in my forecast to be able to reach my commitment and quota?
- How have my sales won changed over time?
Forecast Changes Since Last Week Report in Forecasts Module
If you have the Current Quarter Forecast Changes Since Last Week report present on the Forecasts module dashboard, you can filter the forecast by using the team or person selector or the time period selector at the top of the Forecasts module. When you change the quarter, note that you are not changing the start and end date of the visualization. The start and end dates remain the same and you will see what happened between those dates to the opportunities with an expected close date in the selected time period. The following table provides an example using the time frame February 7, 2022 - February 14, 2022:
| Time Period Selector | Visualization | Explanation |
| Current (Q1 2022) | 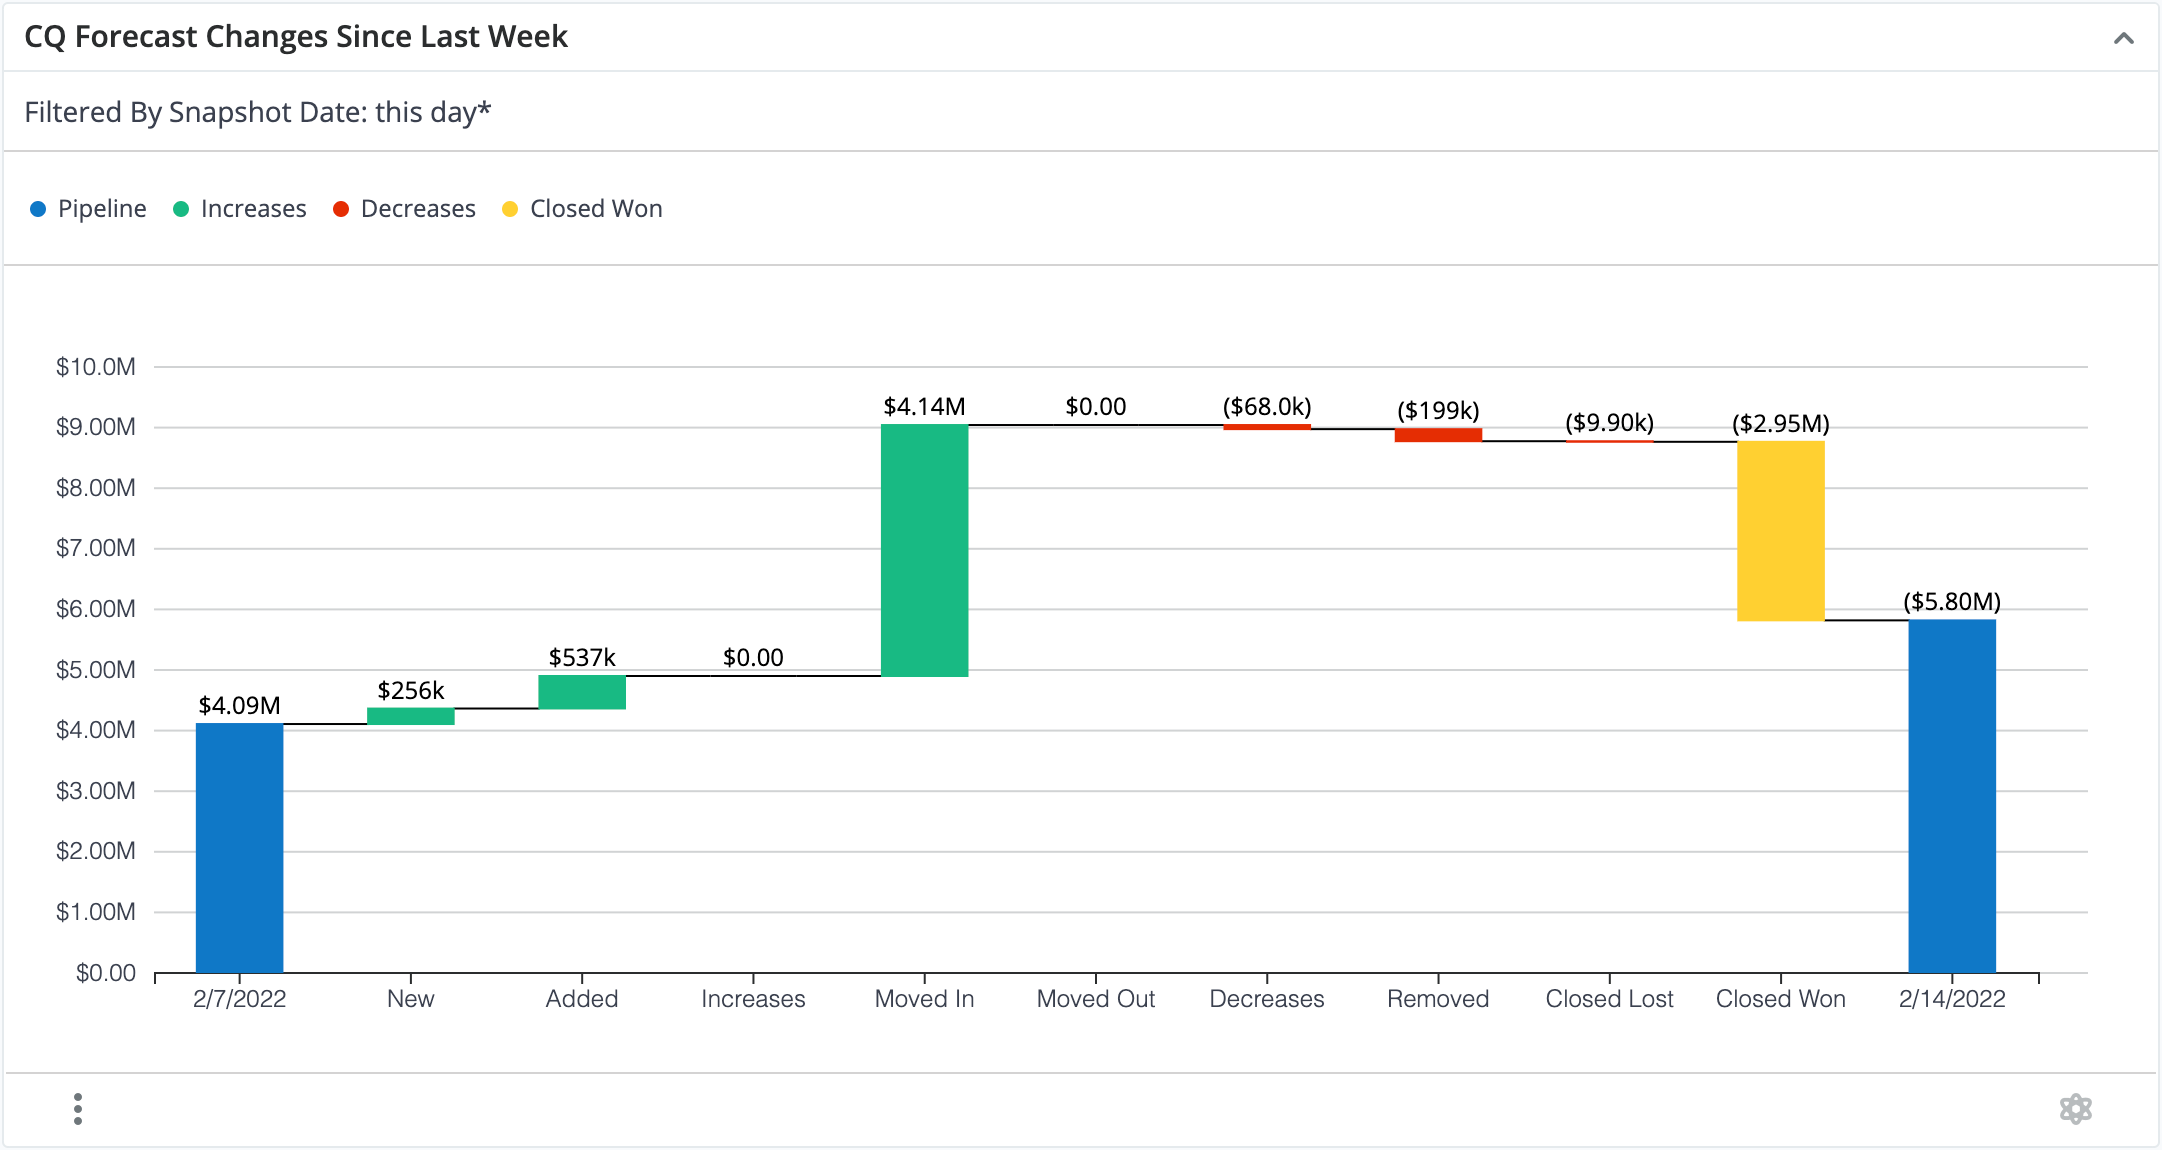 |
On 2/7/2022 there was $4.09M of open pipeline in the current (Q1 2022) quarter. Between 2/7/2022 and 2/14/2022, $256K worth of opportunities were created and included in the forecast for the current quarter (i.e., "New" bar). |
| Q2 2022 | 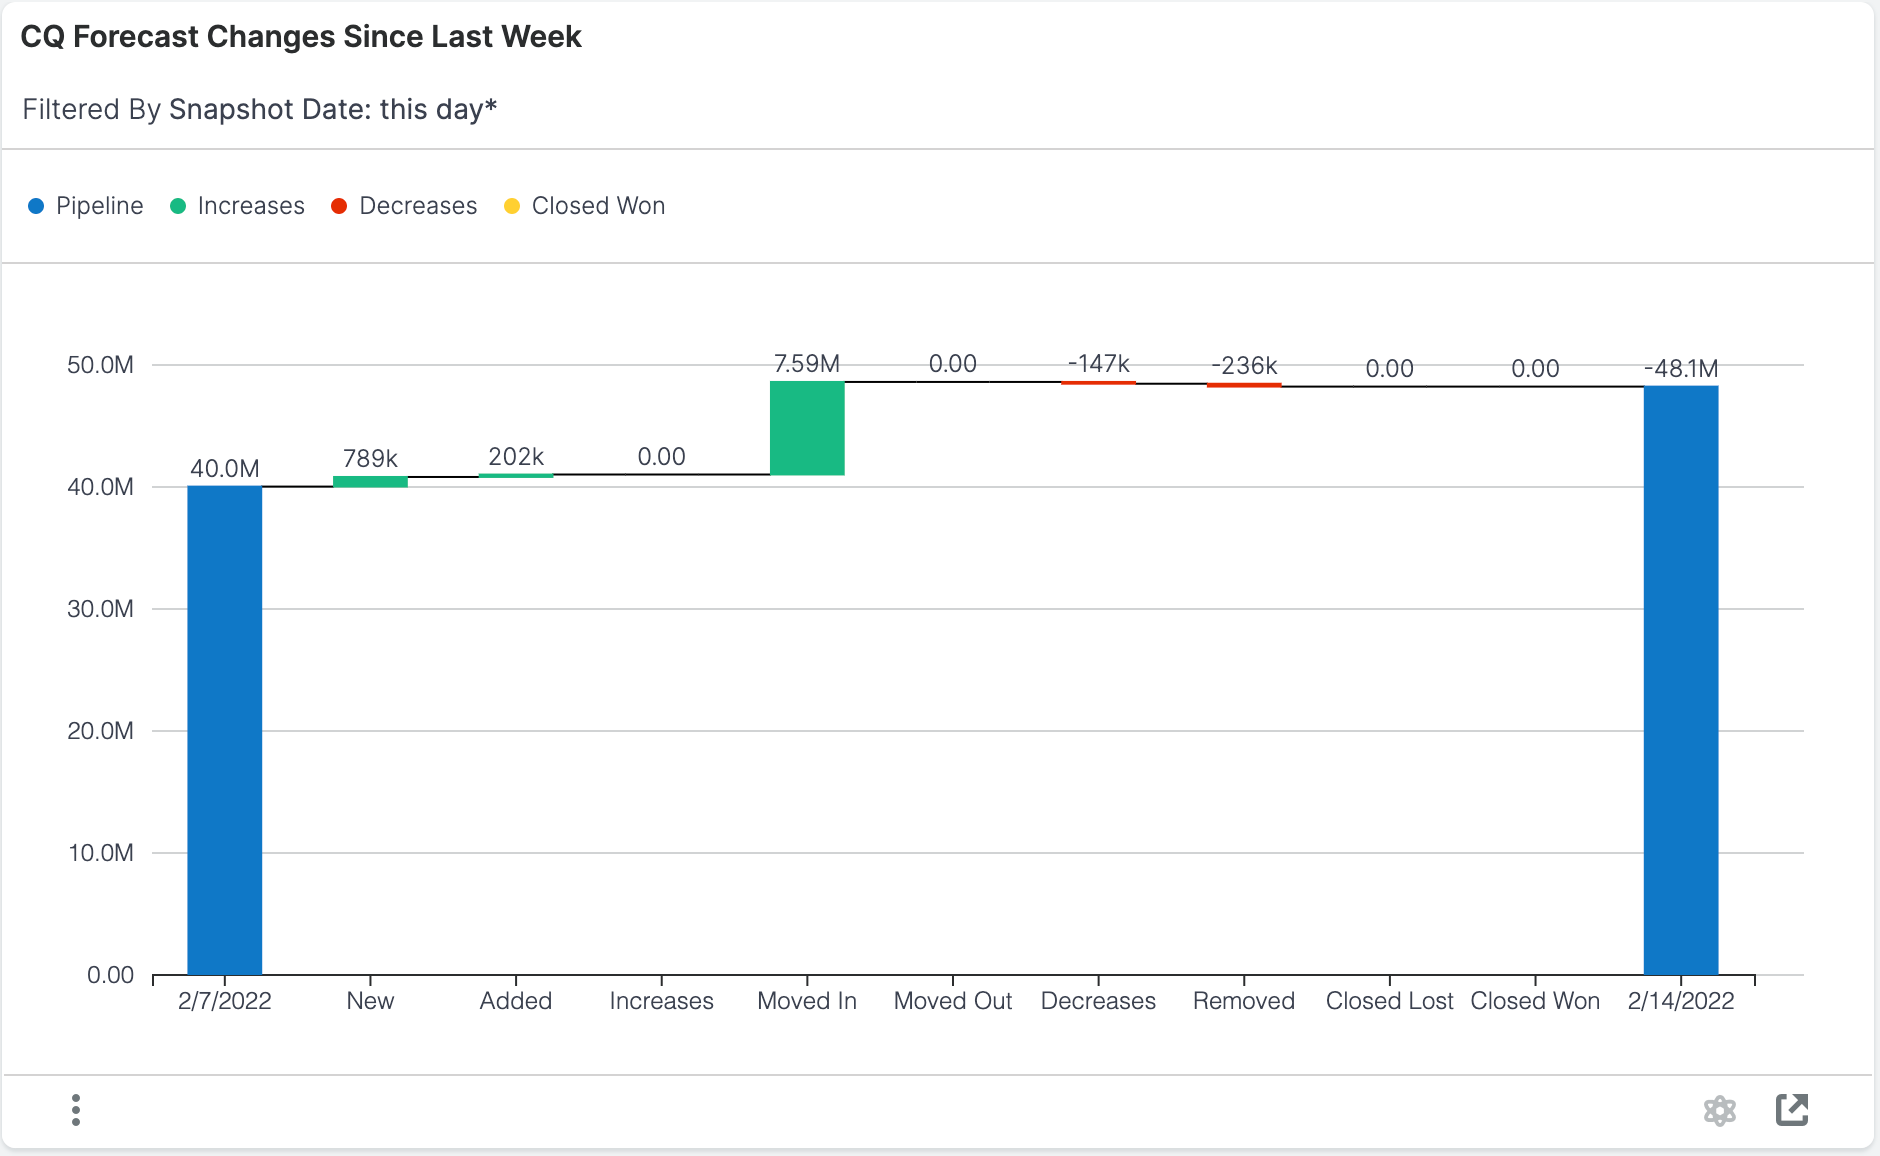 |
On 2/7/2022 there was $40.0M of open pipeline in Q2 2022. Between 2/7/2022 and 2/14/2022, $789K worth of opportunities were created and included in the forecast for Q2 2022 (i.e., "New" bar). |
You can click on the bars in the visualization to drill into the report and see more details.