Forecasts
Overview
Sugar's Forecasts module incorporates opportunity records to build forecasting worksheets and predict sales. Users can work towards sales quotas at the individual, team, and sales organization levels.
Sales representatives use the Forecasts module to work with their assigned opportunities as the current time period progresses. These users will commit total predictions for their personal sales based on the deals they expect to close. Sales managers work with their own records similarly to other sales representatives. In addition, they aggregate their reportees' committed forecast amounts to predict their total team's sales and work towards the team's quota for each time period.
It is important to note that in order for a user to have a designated manager that aggregates their forecast amounts, they must have the manager selected in the Reports To field on their user record. This field specifies a user's manager and conversely, who a sales manager's team members are. Note that only administrators can edit the Reports To field. For more information on the field and how to use it, refer to the User Management page.
Before users can begin building forecasting worksheets, a user with administrator access must configure the Forecasts module with the organization's desired time periods, ranges, and scenarios. For more information on setting up the Forecasts module, please refer to the Forecast Configuration documentation.
This documentation will cover information and actions specific to the Forecasts module but note that some instances can be configured to use just opportunities or opportunities with revenue line items. In general, the two models can be considered interchangeable when working with forecasting worksheets. For more information about changing your opportunities model via Admin > Opportunities, please see the Opportunities Configuration page.
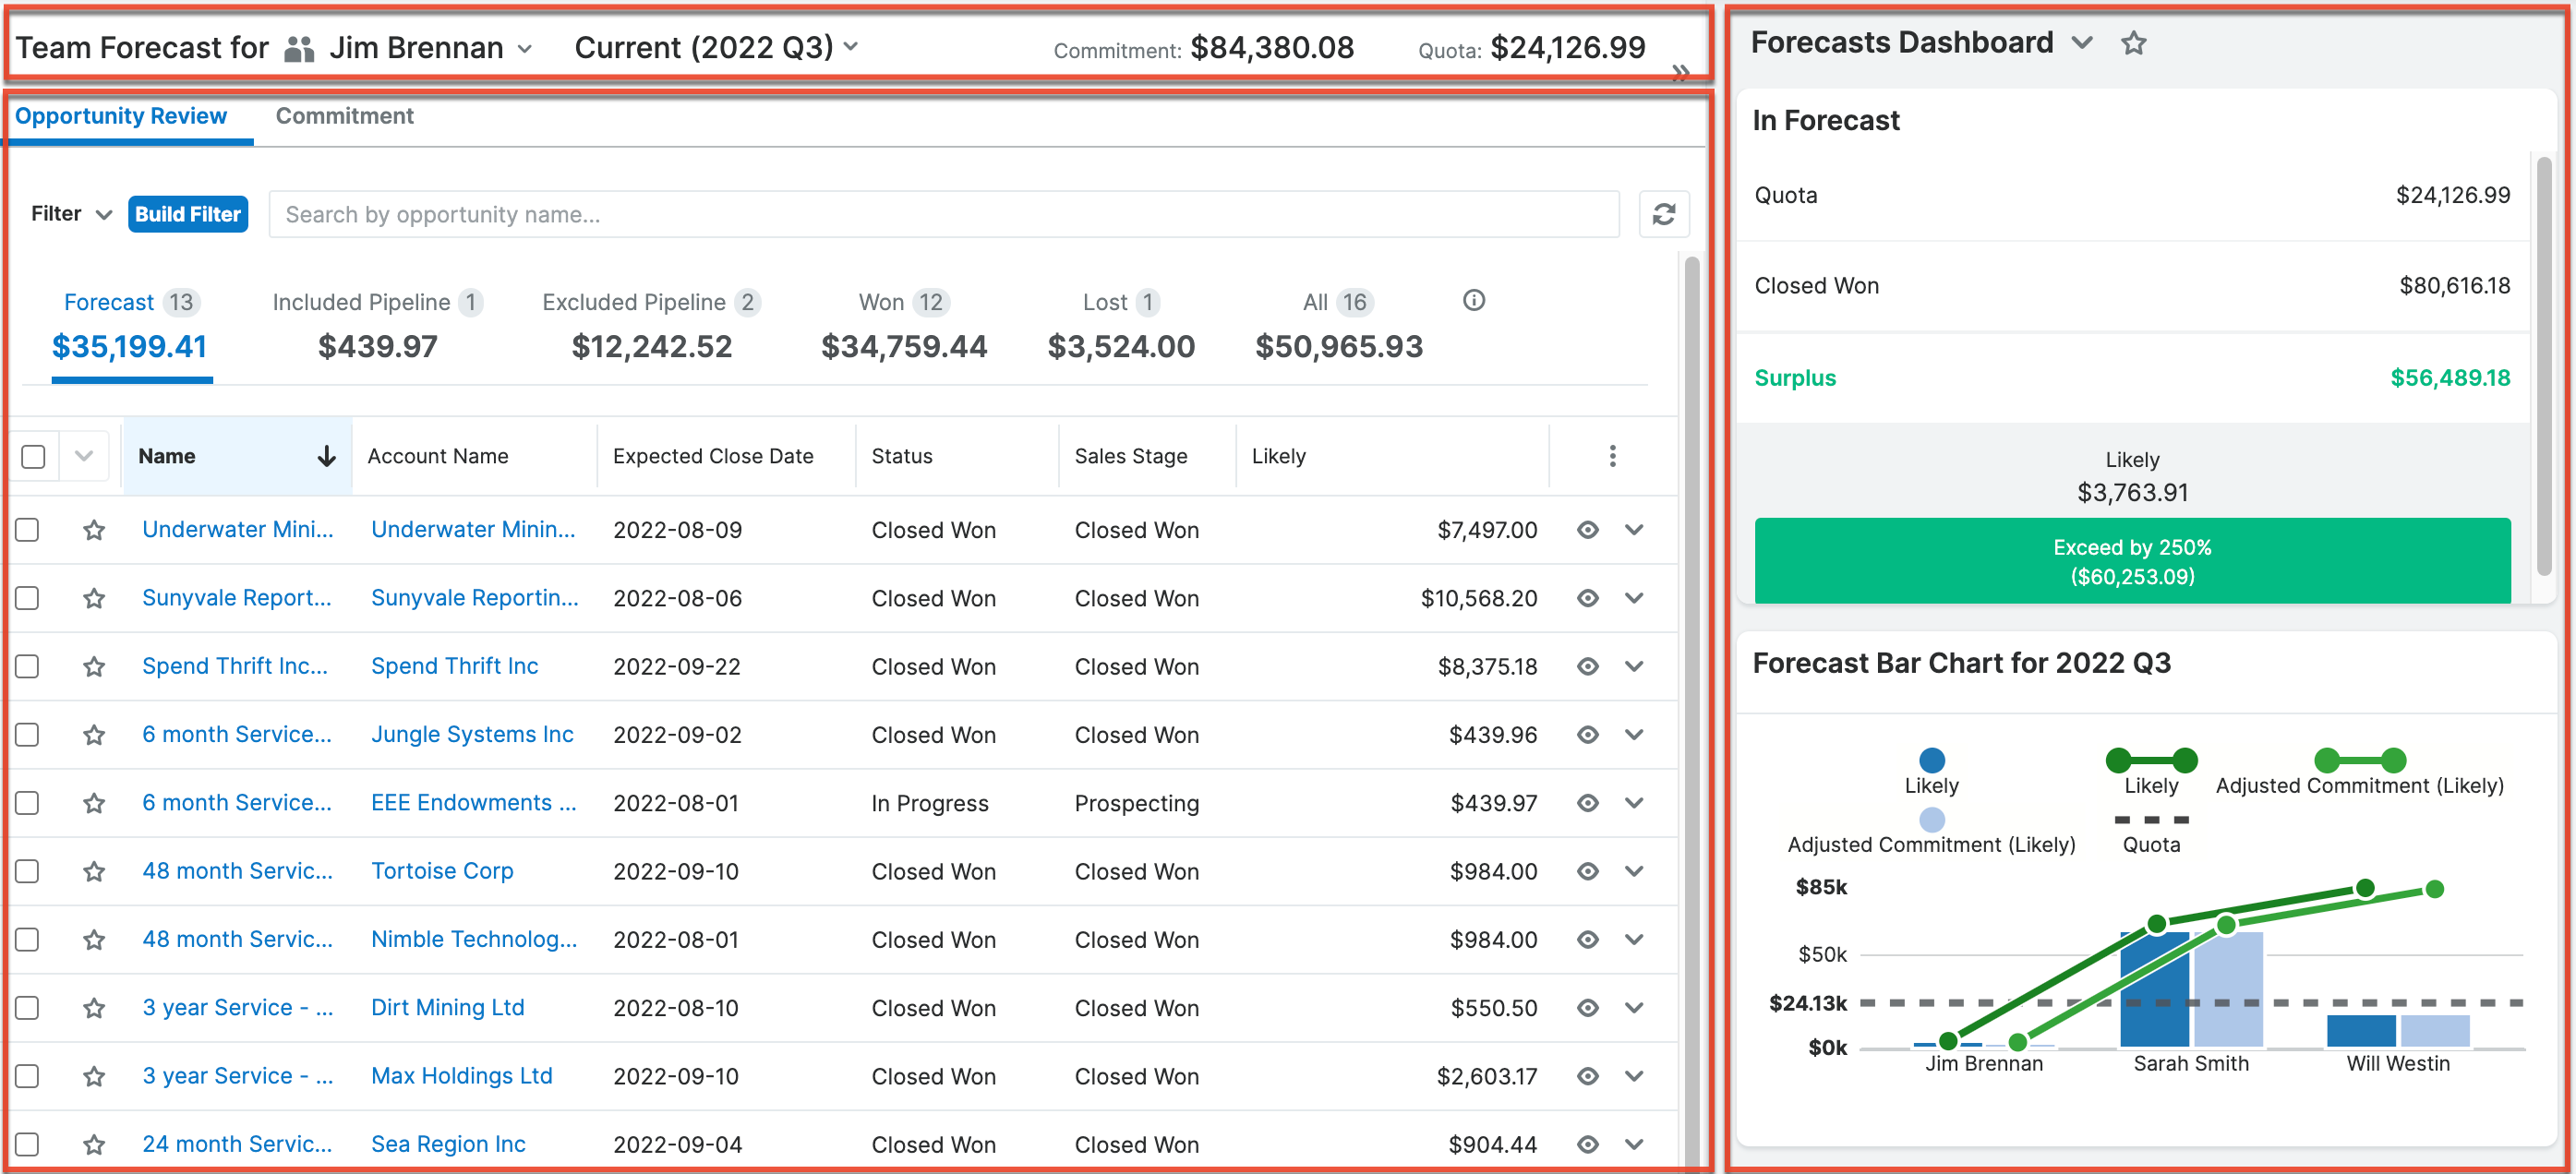
The forecasting worksheet presented in the Forecasts module can be divided up into the following four components:
- Worksheet header: Contains the team or person selector, time period selector, commitment value, and quota.
- Opportunity Review tab: Displays a list of opportunities, organized into categories such as "Forecast" or "Included Pipeline", which can be further filtered and sorted.
- Commitment tab: Allows you to update your team or personal commitment and for managers to review and update their team members' quotas and adjusted commitments.
- Intelligence pane: Contains an out-of-the-box dashlet that helps you analyze the current forecast.
When navigating away from the Forecasts module and then back again, the state of the worksheet as you last viewed it is preserved. In particular, your selections in the team or person selector and time period selector are maintained; the worksheet tab you have open is preserved; your selected metric box and any list view filters are preserved, and the state of your dashboard in the intelligence pane is maintained.
Note that certain aspects of the worksheet appear or function differently for individual sellers versus sales managers. Much of the worksheet is the same, but when differences exist, they are called out in the documentation below.
Worksheet Header
The worksheet header indicates which worksheet you are viewing and what its commitment and quota values are. The team or person selector indicates whose worksheet you are viewing by showing a person's name and either an individual or group icon next to their name to indicate if it is a seller worksheet or a team worksheet. Next to this, you can see which time period is currently displayed in the time period selector. Lastly, the values of the Commitment and Quota fields are displayed to give you a high-level overview, whether you have the Opportunity Review or Commitment tab open.
Note that sales managers can change the team or person selector to view different worksheets within their team. For example, they can view their team worksheet to view the pipeline and commitments of everyone that reports to them, or they can open the seller worksheet belonging to themselves or a team member to view that individual's worksheet.
Team or Person Selector
The team or person selector is displayed next to the time period selector in the worksheet header. For sellers, this shows their own name because they can only view their own worksheet. For sales managers, the selector can be used to change which worksheet they are viewing so they can switch between their team worksheet and the seller worksheets for individuals on their team. If they have managers below them in the hierarchy as specified by the Reports To field, they can also view those team worksheets as well as the seller worksheets for the team members below that person. This can continue recursively as long as the reporting hierarchy continues. When a manager is viewing someone else's seller or team worksheet, it is read-only and they cannot make any direct updates to it.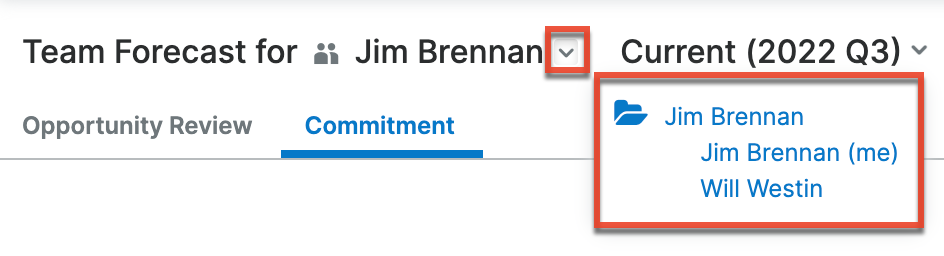
When viewing a team worksheet, the icon next to the name appears as multiple people to indicate that you are viewing a team. When viewing a seller worksheet, the icon appears as a single person to indicate that you are viewing an individual.
Note that managers' names appear twice in the list: once for their team worksheet and once for their seller worksheet. To view the manager's team, select the higher-level name. To view the individual's seller worksheet to see their personal commitment and quota, select the lower-level name. When looking at your own name, the seller worksheet will have "(me)" after it in the selector.
Time Period Selector
The time period selector is displayed next to the team or person selector and shows the time period currently being viewed in the forecasting worksheet. The length and the start date depend on the Time Periods configuration set up by your administrator. Click the arrow to the right of the current time period to choose a future or past time period, the availability of which is also determined by the administrator's configuration. The current time period always has the word "Current" displayed in front of it to help you find your place in the list.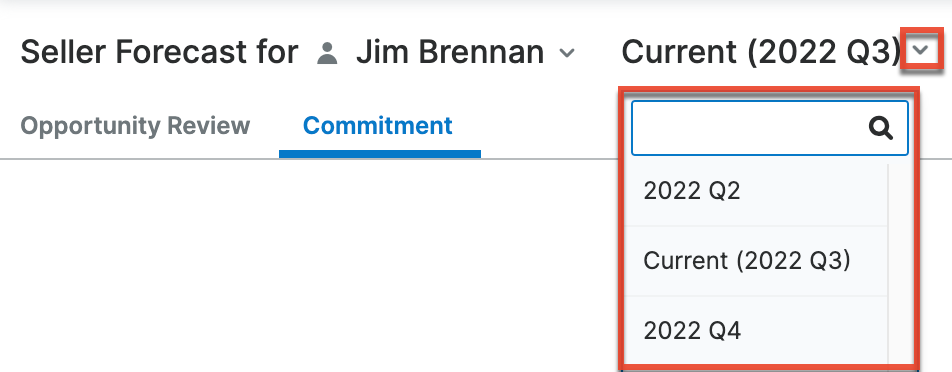
Opportunity Review Tab
The Opportunity Review tab contains a list view of your assigned opportunities for the currently selected time period where you can use the metric tabs across the top to view different subsets, such as just the opportunities that are included in the forecast or just those that have already been won. In addition, standard list view filters can be applied in the same way they are used in the Opportunities module. The refresh button next to the search bar updates both the returned results and the counts and sums in the metric tabs, although saving an inline edit to an opportunity refreshes the metric tabs but not the list results. In this tab, sales managers will see their own opportunities in addition to all opportunities belonging to the members of their teams.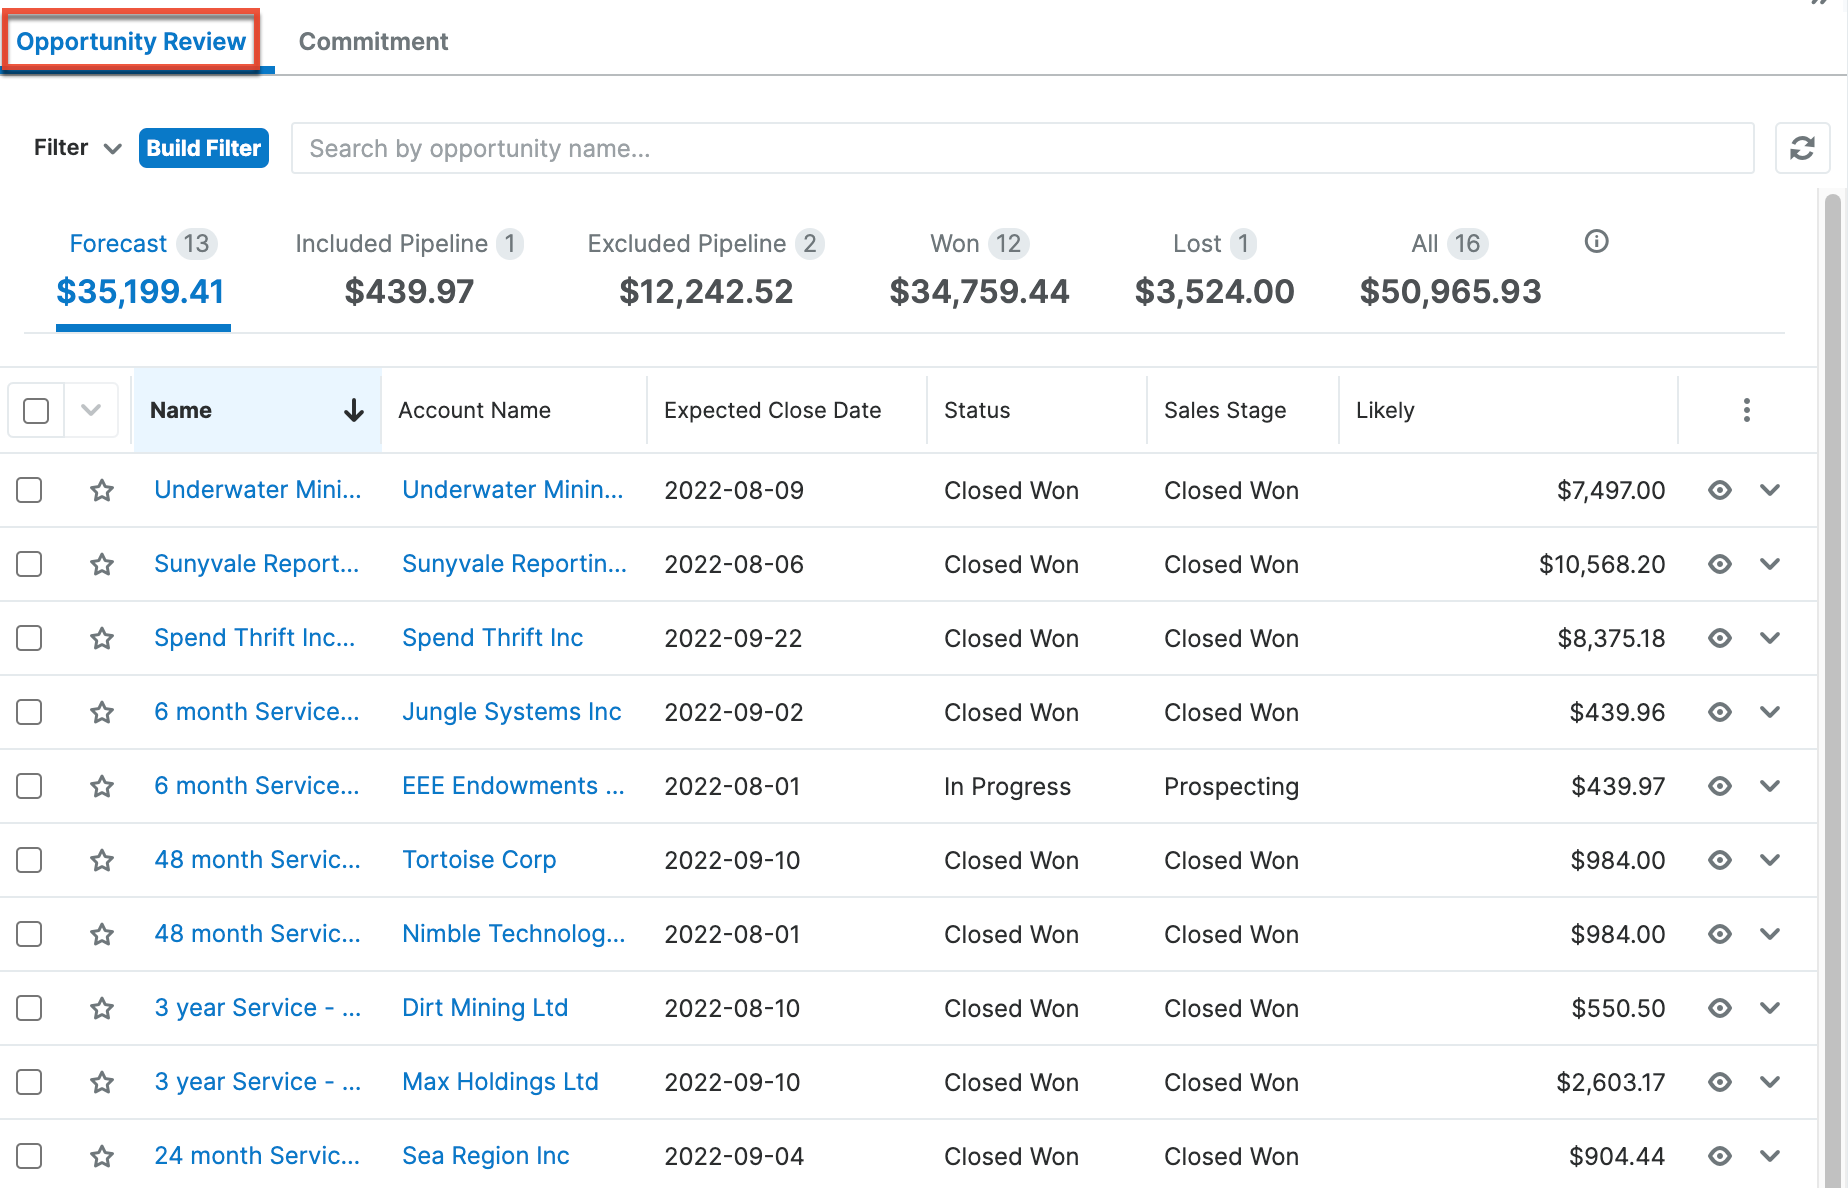
Sellers and managers can configure their Opportunities list view in the Opportunities or Forecasts module to hide or show their desired columns based on those available to be displayed; admins can further configure the list of available fields in Studio. See the User Interface page for details on setting up your list view and the Layouts page for details on the list view configuration available to admins. Note that layout changes applied within the Opportunities module will take effect in the Forecasts module's Opportunity Review tab and vice versa.
To update values for specific opportunities, simply double-click to inline edit the opportunity or click the focus icon to open its focus drawer to edit and view more details about the record. This allows you to update things like its inclusion in the forecast or its sales stage without having to navigate to the Opportunities module. See the Opportunities page for a summary of the fields in the Opportunities module. For an overview of working with list views, including the Record Actions and Mass Actions menus, inline editing, and focus drawers, see the User Interface page.
Metric Tabs
In addition to the standard list view filters available in the Opportunity Review tab, there are also a set of named tabs with pre-configured filters applied to give you a quick understanding of the state of your pipeline and let you review different subsets in more detail.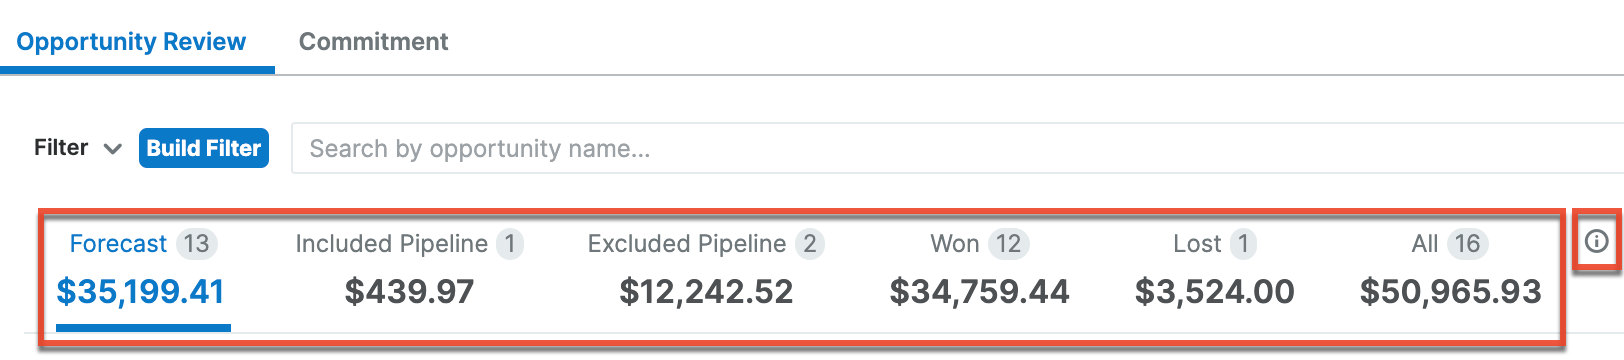
Each tab shows the count of records that meet that filter's criteria in parentheses after the tab name. Below the name, the sum of the opportunities' Likely values is displayed. Click the Help icon next to the tabs for a description of the filter applied to each one: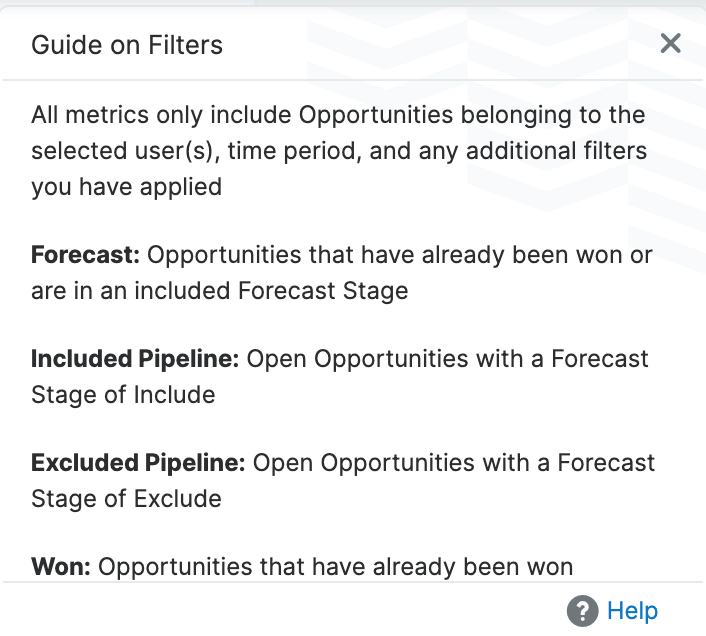
Note that the tabs can be slightly different in certain range configurations and will show a list view of opportunities where the Expected Close date falls in the selected time period. Below is a brief description of what each of the possible metric tabs contains:
- Forecast: The Forecast tab shows a list view of opportunities that have already been won or are in an included Forecast Stage. The total value is a summation of the opportunities' Forecasted Likely values.
- Included Pipeline: The Included Pipeline tab shows a list view of opportunities that are still in an open Sales Stage and an included Forecast Stage. The total value is a summation of the opportunities' Forecasted Likely values.
- Upside Pipeline: The Upside Pipeline tab shows a list view of opportunities that are still in an open Sales Stage and an upside Forecast Stage. The total value is a summation of the opportunities' Likely values.
- Excluded Pipeline: The Excluded Pipeline tab shows a list view of opportunities that are still in an open Sales Stage and an excluded Forecast Stage. The total value is a summation of the opportunities' Likely values.
- Won: The Won tab shows a list view of opportunities that have already been won. The total value is a summation of the opportunities' Likely values.
- Lost: The Lost tab shows a list view of opportunities that have already been lost. The total value is a summation of the opportunities' Lost values.
- All: The All tab shows a list view of all opportunities where the Expected Close Date is in the selected time period. The total value is a summation of the opportunities' Likely and Lost values.
The Upside tab is only displayed when using three forecasting ranges. In addition, if using custom ranges, Included Pipeline and Excluded Pipeline are defined more broadly as open opportunities in an included or excluded Forecast Stage, since there can be multiple stages that are included or excluded. The specific forecasting ranges your organization is using are configured by an admin in the Forecast Settings page.
If your preferred currency is different from the system currency and you have configured your profile to use your preferred currency, the converted values of the metric tab sums are displayed in a grey box within the tab header. Likewise, list view columns display in your preferred currency as they do elsewhere in Sugar.
Commitment Tab
The Commitment tab allows sellers to update their commitment and view their commitment history for the current time period. Sales managers can view or update their team commitment and change their team members' quotas. They can also use the adjusted commitments in their team's worksheet to fine-tune the numbers and decide on their final team commitment. This tab looks quite different when viewing a seller worksheet versus a team worksheet; please refer to the Seller Worksheet View and Team Worksheet View sections below for an overview of each.
Seller Worksheet View
The seller worksheet variation of the Commitment tab can be viewed both by sellers and managers. Sellers can use it to update their commitment to reflect what they feel is most accurate for themselves; in particular, they can commit to a revenue amount without it needing to correspond to specific deals. In this tab, they can also view their commitment history and forecast. The Commitment field displays the currently committed value for the time period, if one has been chosen. If one has not yet been set for the time period, it displays the previous commitment value, or, if no values have previously been committed, it displays the calculated sum of the opportunities for the time period. When viewing a team member's worksheet, sales managers see the same thing as the seller but cannot make any direct changes themselves.
Depending on the scenario configuration set up by an admin, you may see the Best, Likely, and Worst values, or only a subset of them. The Likely scenario will always be displayed at a minimum, however.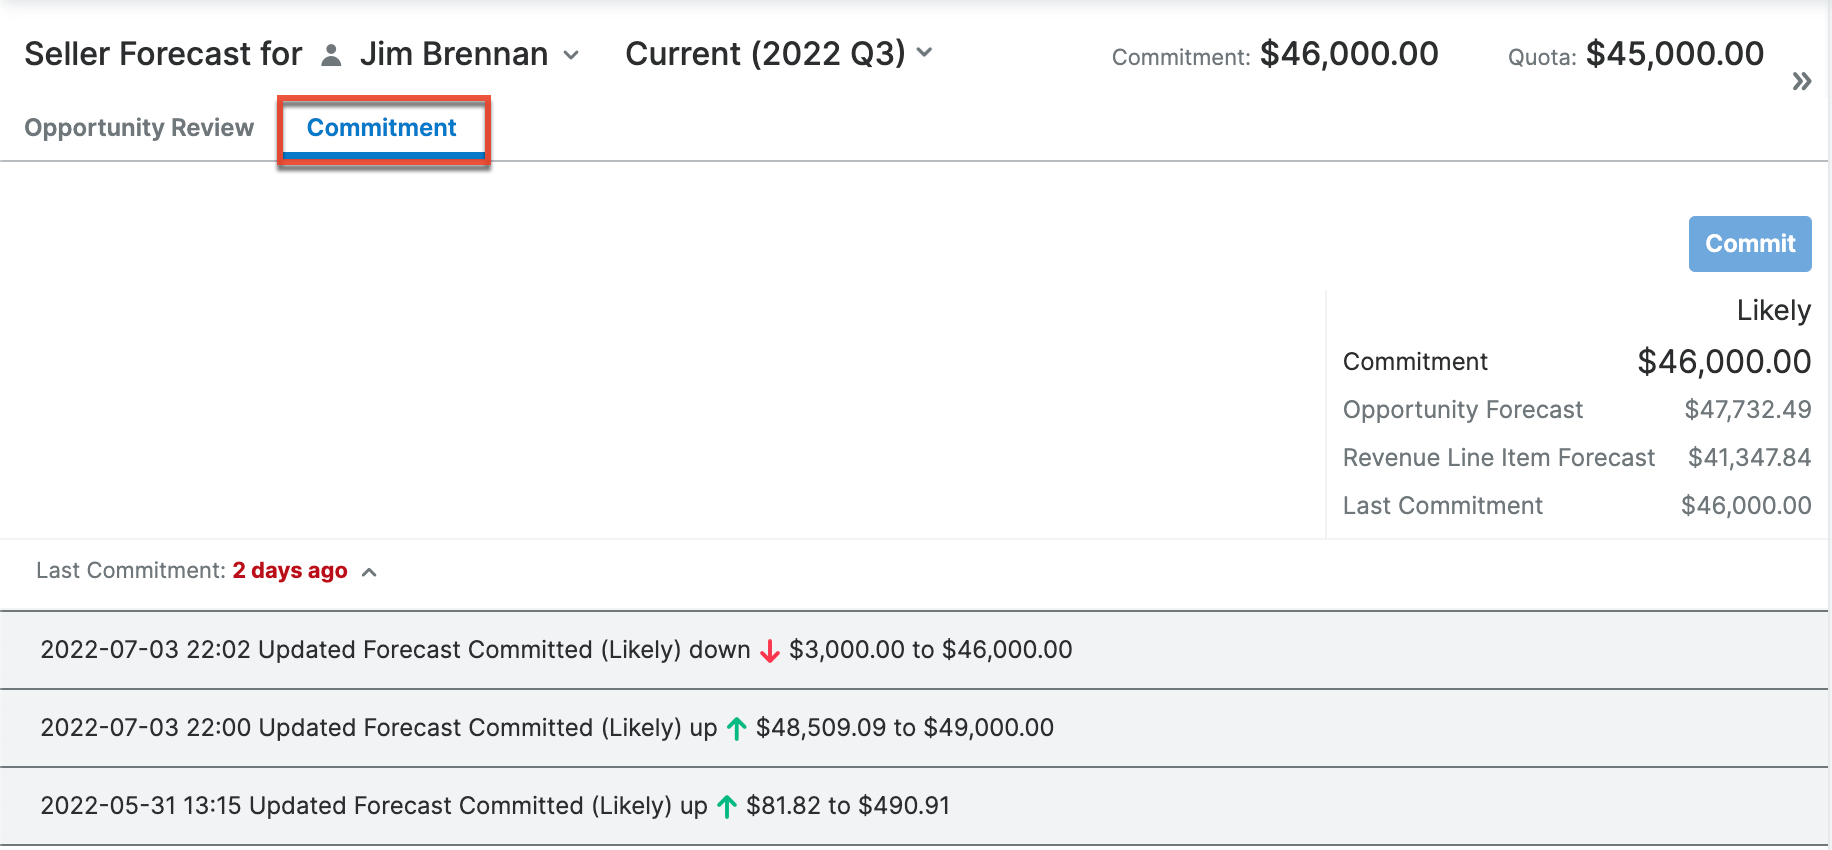
The fields shown in the Commitment tab on seller worksheets are as follows:
- Commitment: Your own personal call able to be modified by you. This value is what will be sent to your manager as the Commitment upon clicking "Commit". Before the first "Commit" action is taken by you, the value displayed defaults to the Opportunity Forecast value or the Revenue Line Item Forecast value, depending on your instance's configuration. After your first commitment, you can update the value at any point and click "Commit" again to send an updated value to your manager.
- Opportunity Forecast: The sum of the opportunities' Forecasted Likely field for those opportunities that are classified as included in the forecast for this time period. For the Best and Worst scenarios, this is the sum of the opportunities' Best or Worst field for those opportunities that are classified as included in the forecast for this time period.
- Revenue Line Item Forecast: The sum of the revenue line items' Likely, Best, or Worst field for those revenue line items that are classified as included in the forecast for this time period.
- Last Commitment: The value that was previously committed. This will be the same as the Commitment value unless a change has been made to the Commitment field but you have not yet clicked "Commit".
To update your commitment, click the Commitment field and enter in the new value. When you click out of the field, an arrow icon appears above the field indicating if the new value is higher or lower than the previous number. Please note, changes made to these values will not be preserved if you navigate away from the page. In order to save the changes and make your personal commitment, you must click the Commit button to commit the new value so that your manager can see it.
Your commitment history is displayed in chronological order at the bottom of the screen. Each row within the history shows the date and time of the past commitment, the amount added or subtracted and the new value, and an arrow icon indicating if it was an increase or a decrease. Use the arrow button at the top of the panel to expand or collapse the history panel.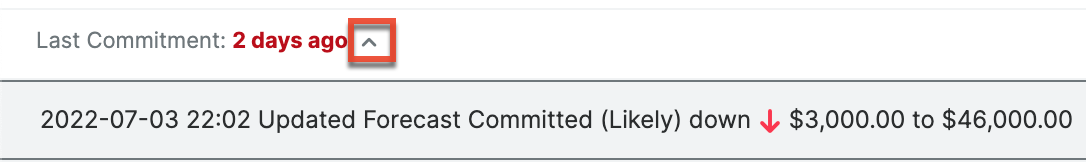
Team Worksheet View
The team worksheet variation of the Commitment tab can only be viewed by sales managers. Managers can use it to update their team commitment and each team member's quota or adjusted values. They can also view the adjusted totals and commitment history of their team. Depending on the scenario configuration set up by an admin, you may see the Best, Likely, and Worst values, or only a subset of them. The Likely scenario will always be displayed at a minimum, however.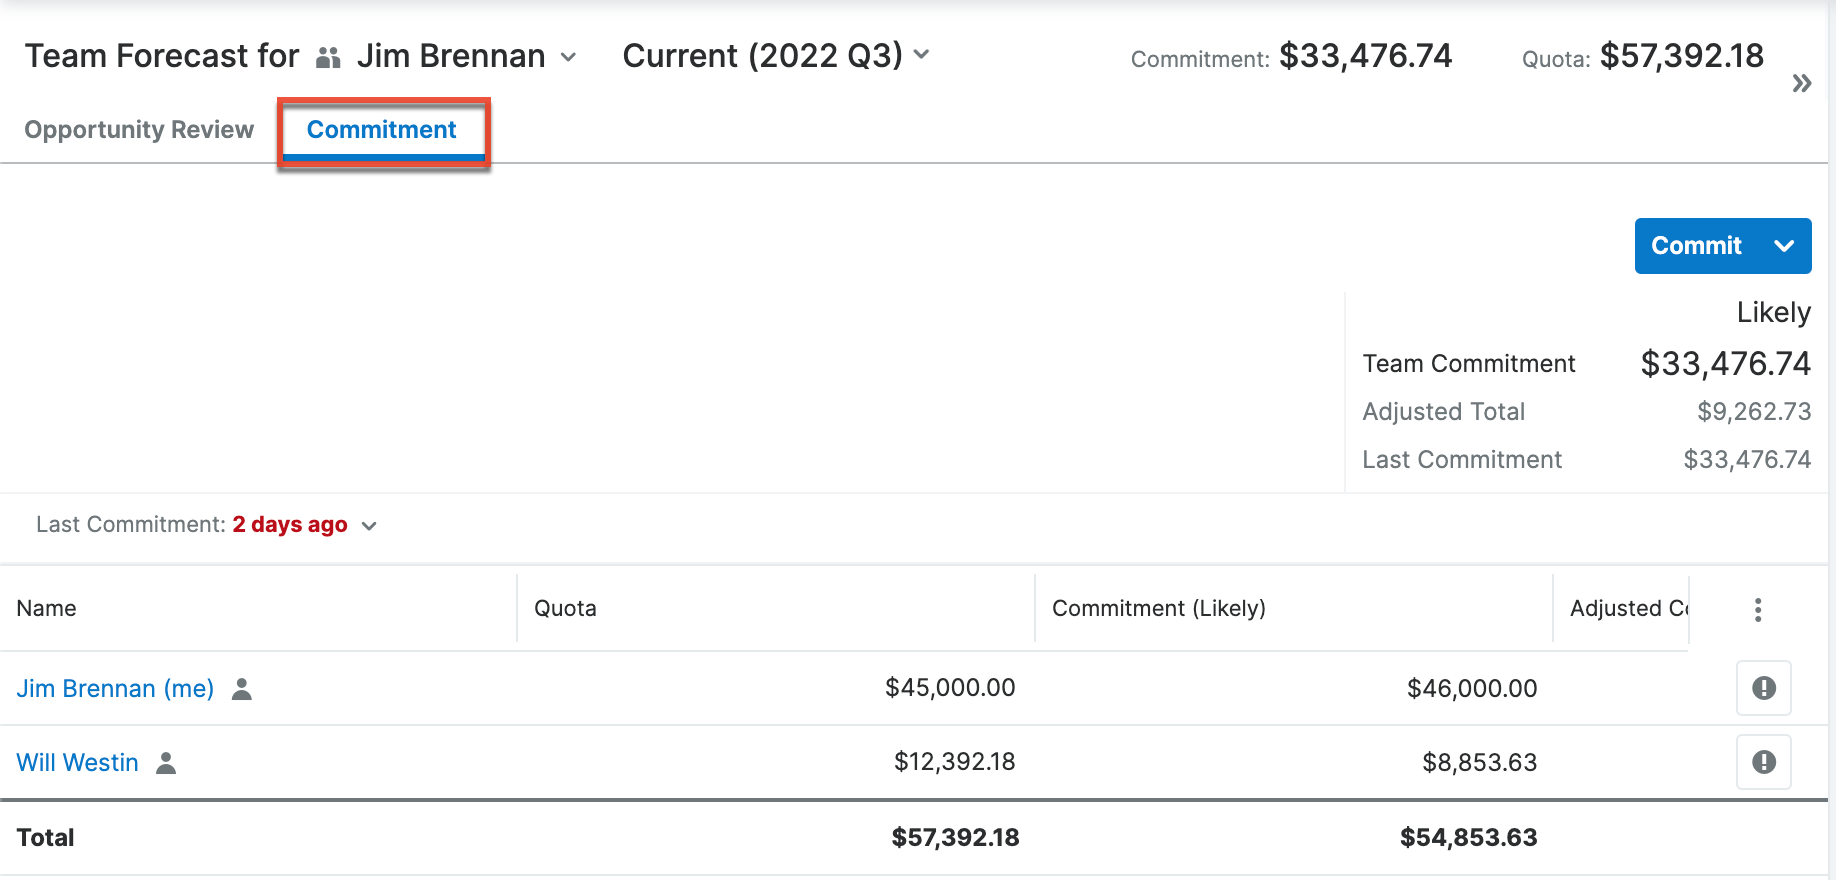
The fields shown in the top section of the Commitment tab on team worksheets are as follows:
- Team Commitment: The forecasted number you are committing to for your team, which you can modify. This value is what will be sent to your manager as the Commitment value upon clicking "Commit".
- Adjusted Total: The sum of the Adjusted Commitment values for your team members.
- Last Commitment: The value that was previously committed. This will be the same as the Team Commitment value unless a change has been made to the Team Commitment field but not yet committed.
Sales managers have the ability to enter the team commitment value to reflect what they feel is most accurate for their team, without it needing to correspond to specific sales agents. The Team Commitment field displays the currently committed value for the time period, if one has been chosen. If one has not yet been set for the time period, it displays the previous commitment value, or, if no values have previously been committed, it displays the calculated sum of the opportunities for the time period. When you click out of the field, an arrow icon appears above the field indicating if the new value is higher or lower than the previous number. Please note, changes made to these values will not be preserved if you navigate away from the page. In order to save the changes and make your team commitment, you must click the Commit button.
Whenever new information is added or changes are made to your current forecasting worksheet, the Commit button will become activated. Click this button to save your changes to the current worksheet and to submit these changes to your manager or to the team worksheet if you are a manager working on your personal worksheet.
Changes to your reportees' quotas will appear in their Forecasts module when you perform a commit or when using the Assign Quota option. Either action will also update your quota and your reportees' quotas in the In Forecasts dashlet.
Next, your commitment history shows changes to the team commitment value in chronological order. Each row within the history shows the date and time of the past commitment, the amount added or subtracted and the new value, and an arrow icon indicating if it was an increase or a decrease. Use the arrow button at the top of the panel to expand or collapse the history panel.
At the bottom of the page, you can see a summary of all members of your team and their current quotas and commitments. At the bottom of the list, the total of each column is displayed. An exclamation mark is displayed next to rows with newly committed changes; click this to show the most recent commitment history entry for that person.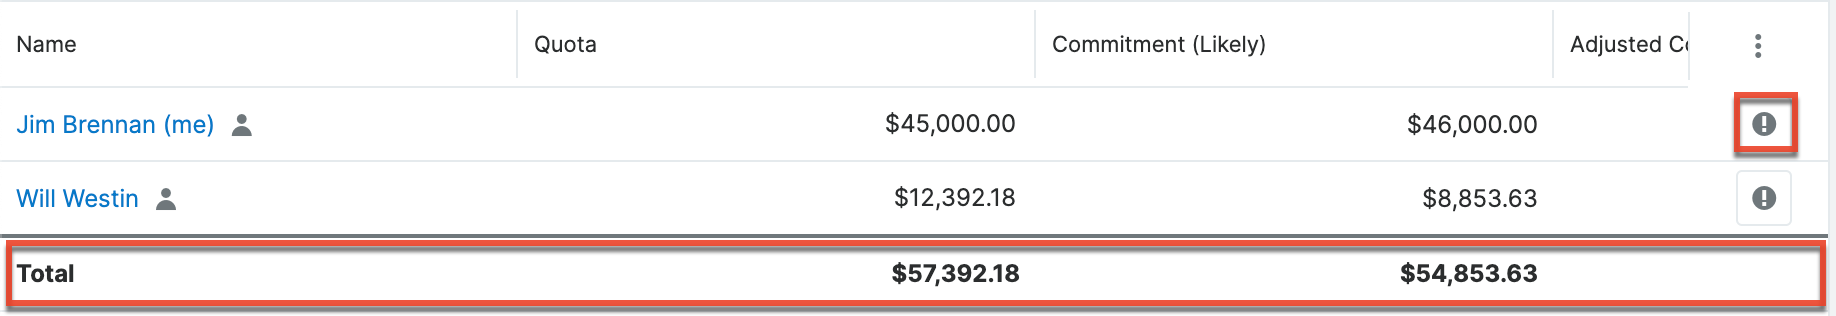
The columns shown in the list of team members at the bottom of the view are as follows:
- Name: The name of the team member. Next to your own name, the word "(me)" is displayed. You can open an individual's seller worksheet by clicking their name in the list.
- Quota: The individual's quota for the time period, as assigned by their manager. Note that this column is only displayed for top-level sales managers, not mid-level managers.
- Adjusted Quota: For mid-level managers, your team's quota with an optional, manual increase above your team's assigned quota. When assigning a quota to your reportees, this is the quota value they will receive. Note that this column is only displayed for mid-level managers and that top-level managers will see the Quota field instead.
- Commitment: The individual's commitment.
- Adjusted Commitment: The committed value with an optional, manual adjustment above or below your reportee's committed total and your own worksheet's total. This value is reported to your manager when committing your forecast.
In this list, you can edit each person's adjusted quota and commitment by clicking the value. Press Enter or click out of the field to preview what the change will look like, which will cause the Save Adjusted Values button to appear next to the Commit button. This provides an opportunity to work with your forecast data before pushing more finalized amounts up the management chain. When you have made all your desired changes to your team members' values, click this button to save the state of the worksheet as a draft or click "Cancel" to revert your changes.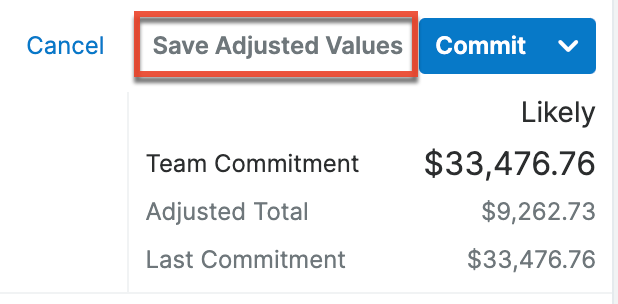
Once ready, click "Commit" to commit the new quota values, which pushes the quotas down to each of your team members. You can also use the Assign Quota option in the Actions menu to push any quota changes to your team members' worksheets. Either action will also cause changes to your quota and your reportees' quotas to be reflected in the In Forecasts dashlet. Note that any values you enter in the Adjusted Commitment columns are not propagated beyond your worksheet and are for your planning purposes only.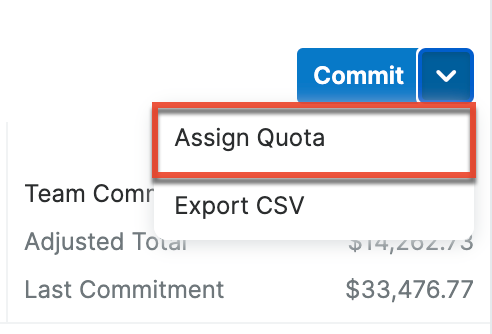
Note: Although it is possible for a manager to set or alter their own personal quota, it is recommended that intermediate managers not make changes to their personal quota. Rather, their top-level manager should set the quota for the entire team from their team worksheet.
Intelligence Pane
To the right of the forecasting worksheet, you will find an expandable intelligence pane that provides additional insights for planning and forecasting. The out-of-the-box default dashboard, "Forecasts Dashboard", contains the In Forecast dashlet, which helps provide additional insight into your forecasting worksheet. Sugar Sell Premier customers may also see another dashlet, the Forecast Changes dashlet, but it must be configured by a SugarCRM representative before it will appear. For more information on using dashboards, refer to the Dashboards and Dashlets documentation.
In Forecast Dashlet
The In Forecast dashlet appears at the top of the intelligence pane by default and gives a breakdown of how your deals or your team's deals match up to your quota.
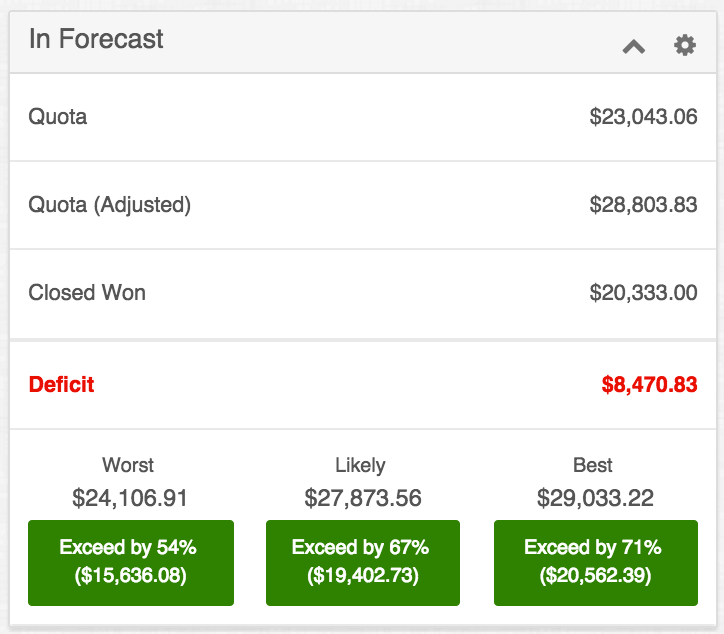
The values are calculated based on the most recent updates to the worksheet(s) even if the changes have not yet been committed and take all of the opportunities into account regardless of any filters currently being used in your worksheet. Keep in mind that your In Forecast dashlet may or may not include "Best" and "Worst" depending on your administrator's Scenarios configuration. The meanings of the displayed values are as follows:
| Field | Description |
| Quota | If viewing a seller worksheet, this shows the individual's personal quota for this sales time period as assigned by their manager. If viewing a team worksheet, it shows your team's quota. |
| Quota (Adjusted) | The adjusted quota is only displayed on team worksheets. It represents your team's quota with an optional, manual increase above your team's assigned quota. When assigning a quota to your team members, this is the quota value they will receive. |
| Closed Won | The total amount of your Closed Won opportunities or, if viewing a team worksheet, those belonging to your team. |
| Deficit | The difference between your quota and the total amount of your Closed Won opportunities. In other words, the additional revenue needed to be won in order to meet your quota. For sales managers, this takes into account your entire team's values. |
| Likely | The total of the Likely amounts for the included opportunities that are not yet Closed Won. |
| (Likely Colored Box) | When summing the Closed Won amounts and the Likely amounts for included opportunities, this is the remaining quota shortage and percentage of quota still outstanding, displayed in red. Or, if you or your team has exceeded the quota, this is the quota overage and percentage exceeded above quota, displayed in green. |
| Best | (Optional) The total of the Best amounts for the included opportunities that are not yet Closed Won. |
| (Best Colored Box) | (Optional) When summing the Closed Won amounts and the Best amounts for included opportunities, this is the remaining quota shortage and percentage of quota still outstanding, displayed in red. Or, if you or your team has exceeded the quota, this is the quota overage and percentage exceeded above quota, displayed in green. |
| Worst | (Optional) The total of the Worst amounts for the included opportunities that are not yet Closed Won. |
| (Worst Colored Box) | (Optional) When summing the Closed Won amounts and the Worst amounts for included opportunities, this is the remaining quota shortage and percentage of quota still outstanding, displayed in red. Or, if you or your team has exceeded the quota, this is the quota overage and percentage exceeded above quota, displayed in green. |
When a manager is drilled into their own or a team member's forecasting worksheet, the Quota (Adjusted) row will not be displayed and the dashlet will function as it does for sales representatives without reportees.
Forecast Bar Chart Dashlet
The Forecast Bar Chart dashlet can be added to your Forecasts Dashboard. This dashlet provides a configurable chart showing different cuts of your forecasting data over the course of the selected time period. The dashlet is different when viewing a seller worksheet versus a team worksheet. Refer to the Seller Worksheet View and Team Worksheet View sections below to understand each variation of the dashlet. Refer to the Dashboards and Dashlets documentation for information on how to add a dashlet to the dashboard.
Seller Worksheet View
In the seller worksheet variation of the dashlet, each opportunity's Expected Close Date field determines in which sub-period it appears. Only the records currently appearing on your worksheet will appear in your chart, meaning that the chart respects your current filters. The dashlet's values are calculated based on the most recent updates to your worksheet even if the changes have not yet been committed. The dotted black line represents the quota for the given time period and you can hover over it to view the quota amount.
Use the two dropdown menus to control what is displayed in the chart: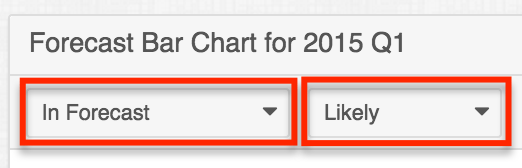
When "Likely" is chosen, each green point represents the total Likely amounts for all opportunities currently appearing in your filtered worksheet for that sub-period and any previous sub-periods falling within the selected time period. Choosing "Best" or "Worst" shows the same points using the opportunities' Best or Worst amounts instead. A green line connects these points showing the change in your possible cumulative amounts.
Each sub-period also displays bars that represent the Likely, Best, or Worst amounts (depending on the chosen dropdown option) for the opportunities currently appearing in your filtered worksheet. Choosing "In Forecast" will color-code segments of these bars according to each record's Forecast Stage field (i.e., "Include", "Exclude", etc.). Choosing "Sales Stage" will color-code the bars according to the Sales Stage field of each opportunity. Choosing "Probability" will color-code the bars according to the Probability value of each opportunity. 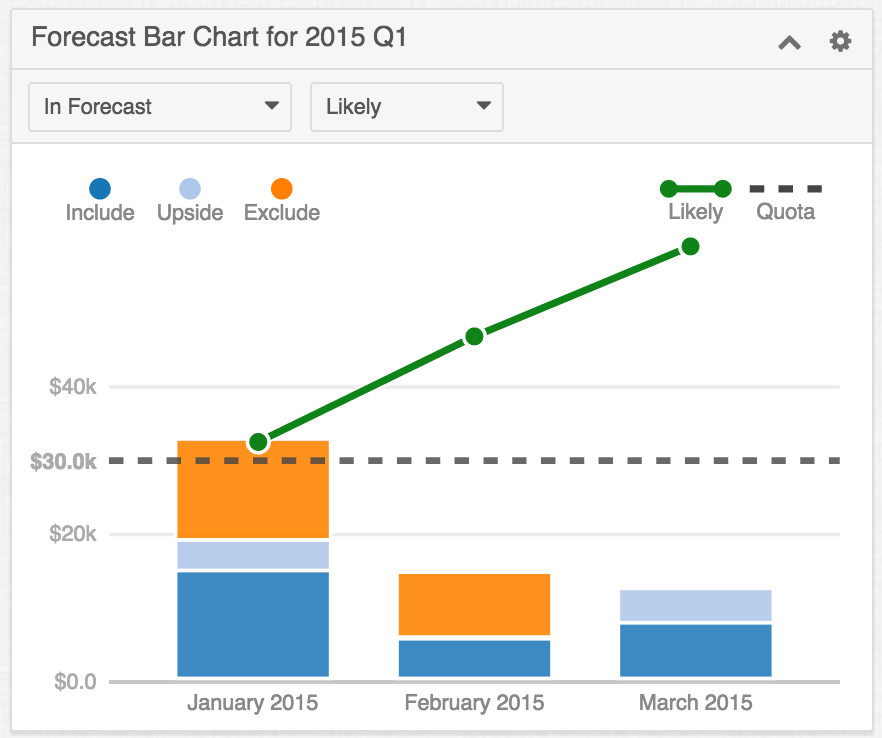
Team Worksheet View
In the team worksheet variation of the dashlet, the chart displays the current worksheet's totals in bars grouped by user. The dotted black line represents the worksheet's adjusted quota for the given time period and you can hover over it to view the quota amount.
Use the dropdown menu to configure what is displayed in the chart: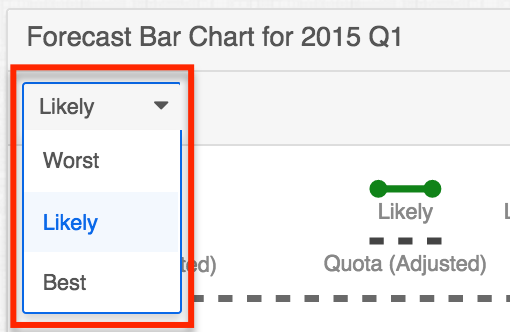
When "Likely" is chosen, each dark blue bar represents the total committed Likely amount for each user within the current team worksheet. Each light blue bar represents the total adjusted Likely amounts for each user. The dark green dots show the cumulative Likely total of the team built user-by-user from left to right with the rightmost point representing the total Likely amount for the entire team. The light green dots and line do the same using the adjusted Likely team total.
Choosing "Best" or "Worst" shows similar chart elements except that the Best/Worst and adjusted Best/Worst amounts are used.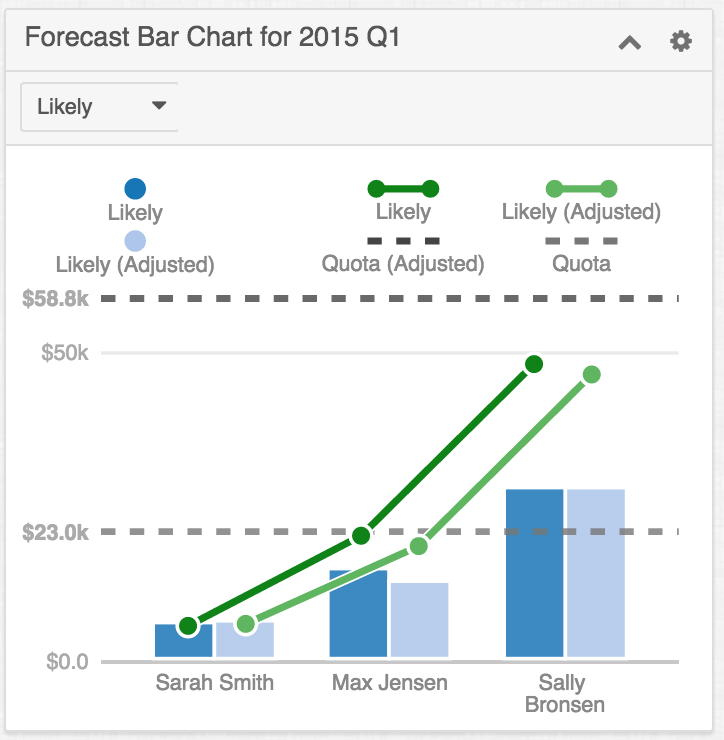
Note: You may or may not see "Best" and "Worst" as options in the second dropdown depending on your administrator's Scenarios configuration.
Forecast Changes Dashlet
The Forecast Changes dashlet, available only in Sugar Sell Premier, is a dynamic dashlet that shows you forecast changes since the last reported date. When you change the worksheet view to a different team or person or a different time period, the dashlet's chart updates to reflect the new data. You can then click on a segment of the chart to open further details about that segment in the Sugar Discover interface. See the Enhanced Forecasting Dashlets page for more details on this dashlet.
Note: The Forecast Changes dashlet is not immediately available in the Forecasts module of Sell Premier instances because it requires implementation by a SugarCRM representative or partner. Contact your representative to enable this dashlet in your instance.
Working with Forecast Worksheets
Both sales agents and managers can access the forecasting worksheets with some common actions available to each role. The sections below describe common actions and abilities across the Forecasts module.
Forecasts Module Tab
Click the Forecasts module tab in the navigation bar to access the Forecasts list view. Note that a user with administrator access must first configure the Forecasts module before it can be accessed and used.
For more information on module tab menus including reasons a module may not be included in the menu, see the User Interface documentation.
Forecast Actions
Forecast actions are available at the top of the Commitment tab and allow users to perform the following operations:
| Menu Item | Description |
| Assign Quota | For sales managers, this pushes any changes they have made to their team members' quotas to those individuals' worksheets. |
| Export CSV | Exports the rows of the current forecasting worksheet. This option is only available when viewing a team worksheet. Instead, seller worksheets can be exported using the Mass Actions menu in the list view within the Opportunity Review tab. |
Exporting Forecasts
The Export CSV option is available in the Actions menu on team worksheets and exports every line of the current worksheet. The resulting CSV file can be used in other programs such as Microsoft Excel to view and manipulate your forecasting data. To export a team worksheet, click "Export CSV" in the Actions menu.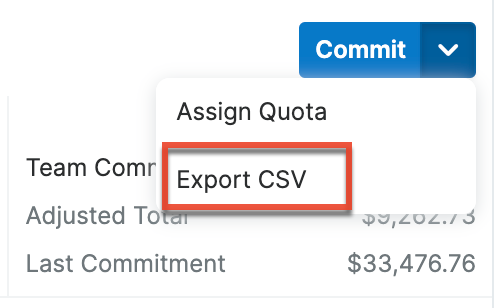
To export a seller worksheet, simply use the Mass Actions menu in the list view within the Opportunity Review tab to export the desired records. See the User Interface page for more information on exporting from list view.
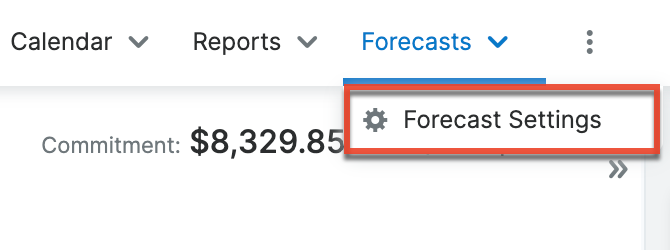
Configuring Forecasts
Users with administrator access will have a Forecast Settings option available in the Forecasts module tab menu. Choosing "Forecast Settings" will open the Forecast Configuration wizard, which is also available by navigating to Admin > Forecasts. For more information on configuring the Forecasts module, please refer to the Forecast Configuration documentation in the Administration Guide.