Forecast Configuration
Overview
Sugar's Forecasts module incorporates opportunity records to build forecasting worksheets and predict sales. Users can work towards sales quotas at the individual, team, and sales organization level. Before users may access the Forecasts module to begin building forecasting worksheets, a user with administrator access must configure the Forecasts module with the organization's desired Time Periods, Ranges, and Scenarios.
Configuring Forecasts
Administrator users can access the Forecast configuration settings by navigating to the Administration page and clicking the Forecasts link. 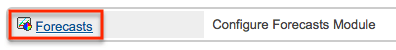
As an alternative, administrators can also access the Forecast configuration settings by navigating to the Forecasts module. Clicking the Forecasts module tab before the module has been configured will automatically redirect administrators to the configuration wizard. After the module has been configured, choose "Forecast Settings" from the module tab menu to review the configuration selections and potentially make changes. For more information on making changes to the configuration, please refer to the Editing Forecast Configurations section of this page. 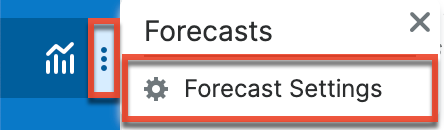
The Forecasts Setup wizard will guide you through the various configuration items.
Note: The Forecast Time Periods cannot be changed after initial setup without losing all existing forecast data. The Forecast Ranges cannot be changed after the first Save Draft or Commit action in the Forecasts module. In order to make changes to these selections, please refer to the Editing Forecast Configurations section of this documentation.
Time Periods
The Time Periods panel allows you to match the Forecasts module's fiscal year and frequency of quota cycles to your organization's practices. These settings will control the beginning and duration of your forecasting time periods as well as control the number of past and future time periods users may access.
Use the following steps to configure Forecast Time Periods:
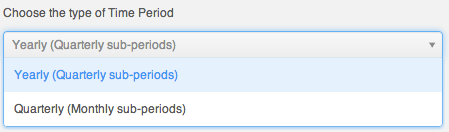
- Select the Time Period type which matches your sales organization's practices. Choose "Yearly" if your sales organization has quarterly quotas which build up to a yearly goal. Choose "Quarterly" if you operate with monthly goals building to quarterly goals instead.
- Click the calendar icon to select the start day and month of your organization's fiscal year from the date picker.
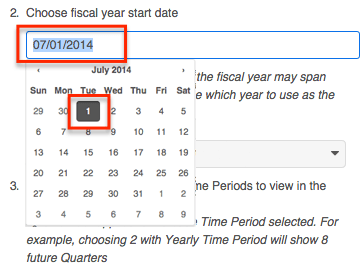
If the start date of your organization's fiscal year is a date other than January 1, the fiscal year will span two years. You must specify which of those two years the start date applies to. In these cases, a dropdown will appear prompting you to select the appropriate fiscal year. For example, if the start date of the fiscal year is 07/01/2014, the end date will be 06/30/2015. The forecast wizard will therefore ask you if the time period 07/01/2014 -06/30/2015 should be considered fiscal year 2014 or fiscal year 2015.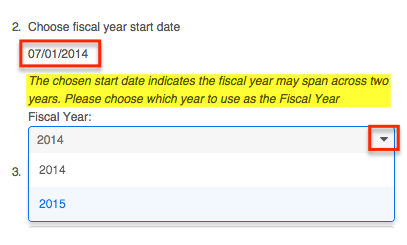
Note: It is not recommended to choose February 29th for the fiscal year start date, though this is possible to do during a leap year. If this date is chosen, non-leap years will have fiscal year start date of March 1st. - Select how many future time periods users will be able to view in their forecast worksheets. This is the number of base Time Periods (years or quarters) as opposed to the sub-periods (quarters or months).
- Select how many past time periods users will be able to view in their forecast worksheets. This is the number of base Time Periods (years or quarters) as opposed to sub-periods (quarters or months).
- Click "Next".
Note: The Forecast Time Periods cannot be changed after initial setup without losing all existing forecast data. In order to make changes after initial setup, please refer to the Editing Forecast Configurations section of this documentation.
Ranges
Forecast Ranges are a method of predefining which opportunity records should likely be included in forecasts and which should not. As the administrator, you will specify the sale probabilities that will cause opportunities to be initially included in a user's forecast. Each user, however, can then manually choose to include or exclude their opportunities no matter how the probabilities line up with these ranges.
In addition to initially including opportunities, these ranges will also be available to users in the Forecasts module as categories for filtering or for grouping in charts. Ranges that are not associated with probabilities and are used strictly for categorical purposes may be added under the Custom Ranges option.
Two Ranges
Choose the Two Ranges radio button for a simple include or exclude model. You will then drag the left slider to specify the minimum probabilities that qualify an opportunity to be initially included in forecasts. In this two-range model, all opportunities with probabilities falling below the defined range will be initially excluded from forecasts. Choosing "Two Ranges" will cause the categories "Include" and "Exclude" to be available for users in the Forecasts module for filtering or grouping opportunities in charts. 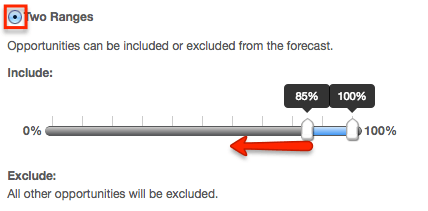
Three Ranges
Choose the Three Ranges radio button to enable an intermediate range. Drag the left Include slider to specify the minimum probabilities that qualify an opportunity to be predefined as included on forecasts. Then use the Upside sliders to define the range of probabilities that will be initially excluded from forecasts but that can be viewed independently for consideration for inclusion by the user. All opportunities with probabilities falling outside these two ranges will also be predefined as excluded from forecasts. Choosing "Three Ranges" will cause the categories "Include", "Upside", and "Exclude" to be available for users in the Forecasts module for filtering opportunities in charts. 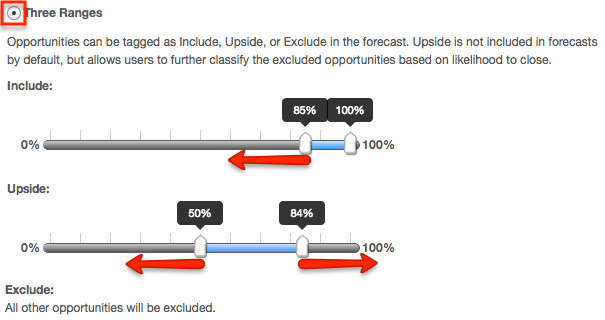
Custom Ranges
Choose the Custom Ranges radio button if you would like to create additional, more customized ranges. Custom ranges based on probabilities will be used to initially determine whether or not an opportunity is included or excluded in forecasts.
- The Include and Exclude ranges are required, though you may change their names if desired.
- Use the plus button to add additional ranges.
- Use the minus button to remove unwanted ranges.
- Use the text box to specify the desired name for each range.
- Mark the check box of every range which should be included on forecasting worksheets.
- Use each range's sliders to determine the minimum and maximum probabilities that will correlate with each range.
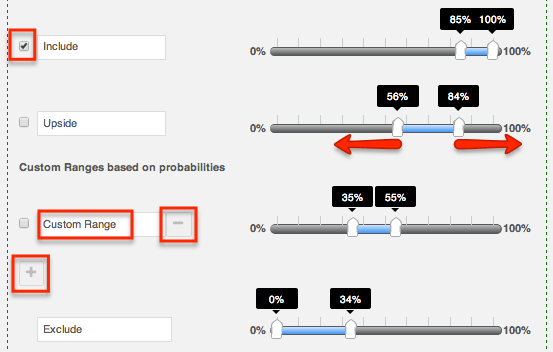
You may also add custom ranges not based on probability at the bottom of the ranges panel. These values do not correlate with any probabilities, and opportunities marked with these range options will not be included in forecasting worksheets. Ranges created in this section may be used as tags on the opportunity record.
Note: The Forecast Ranges cannot be changed after the first Commit action in the Forecasts module without losing all existing forecast data. In order to make changes after initial setup, please refer to the Editing Forecast Configurations section of this documentation.
Scenarios
The Scenarios panel allows you to specify if you wish to have opportunity records' Best Case and/or Worst Case fields available on the forecast worksheets. The "Likely" scenario is included automatically because it matches the opportunity record's required amount field. When "Best" and "Worst" are also enabled, users will have the ability to view and modify these additional values based on their opinion of what values may come about in the sale. This provides a broader range of possible sales information when working to make forecasts as predictive as possible.
Note: The "Best" and "Worst" fields are disabled by default and must be enabled manually.
To add the Best or Worst scenario, click in the text box and select from the dropdown list which appears. Unwanted scenarios may be removed by clicking the "x". 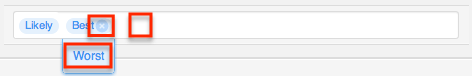
Note: The Forecast Scenarios configurations may be changed at any time following initial setup by returning to the Admin > Forecasts page.
Forecasts and Opportunities
Upon completion of the Forecast Configurations in the Time Periods and Ranges sections, clicking "Save" at the top of the page prompts Sugar to perform a recalculate and resave of all existing opportunity and, if applicable, revenue line item records. This is necessary as these records contain the information required to determine whether or not they are initially available in the Forecasts module. The default value of the Forecast Stage fields in the opportunity and revenue line item records is determined by the probability assigned to each Sales Stage field value. Therefore, the records must be recalculated and resaved by Sugar to determine the appropriate forecast stage.
Editing Forecast Configurations
Once the Forecast Configurations have been completed, Sugar will apply the selected options and do an initial load of opportunities to the Forecasts module. The selected Time Periods are locked at the completion of the Forecast Configuration wizard, and the Ranges are locked once the first Save Draft or Commit action is performed within the Forecasts module. If, at a later time, the selections you made for Time Periods and Ranges need to be changed, the only way this can be accomplished is at the expense of any existing forecasting data.
Should you choose to lose all forecasting worksheets for the current, past, and future time periods, a user with administrator access can navigate to https://yourinstancename.com/#bwc/index.php?module=Forecasts&action=ResetSettings (where "https://yourinstancename.com" represents the URL you use to navigate to your Sugar instance) to instantly reset the Forecasts module. Please note that you cannot undo this action, and you will not be prompted to confirm this decision before it takes effect. Be sure to let the action complete before closing or refreshing the browser window.Your instance's opportunity records will not be affected by the reset action using the URL, unlike when clicking "Save" on the Forecast Configurations screen.
Please take caution: Navigating to the URL above will reset your Forecasts module to a state as if it had never been used before, enabling you to make fresh selections for all elements within the Forecasts Configuration by navigating to Admin > Forecasts. After making the desired changes and clicking "Save", all existing opportunity and, if applicable, revenue line item records will be re-saved as described in the Forecasts and Opportunities section.