Integrating Sugar With New Relic APM for Performance Management
Overview
Sugar® 7 includes support for New Relic APM™, a third-party Application Performance Management (APM) tool that can facilitate deep insight into your Sugar instance in order to troubleshoot sluggish response times. This article explains how to set up and use New Relic in conjunction with Sugar for powerful performance management capabilities.
Note: This article pertains to on-site installations of Sugar only. SugarCloud customers who are experiencing performance-related issues should contact the Sugar Support team for assistance.
Prerequisites
- To install and configure New Relic for use with your Sugar instance, you must have Sugar hosted on-site and have access to the root directory.
- You must be a New Relic account holder. To sign up for New Relic, please visit newrelic.com to find the subscription level best suited for your needs.
Steps to Complete
New Relic can provide useful information outside of the Sugar integration, but the feedback it provides will be limited to the instance's PHP file structure, which could make troubleshooting your instance a challenge. Follow these instructions to set up and use New Relic for PHP with your Sugar instance.
Installing the New Relic for PHP Agent
First, install the New Relic for PHP agent. For the most current installation steps, please refer to the Getting Started Guide on the documentation site for New Relic for PHP.
Configuring Sugar to Work With New Relic for PHP
Enable the Sugar integration with New Relic by editing the ./config_override.php file. Add the following lines to the end of the file contents (explanation follows):
  $sugar_config['metrics_enabled'] = 1;
$sugar_config['metric_providers']['SugarMetric_Provider_Newrelic'] = 'include/SugarMetric/Provider/Newrelic.php';
$sugar_config['metric_settings']['SugarMetric_Provider_Newrelic']['applicationname'] = "SugarCRM New Relic";
- The first line of the configuration enables metrics collection for your Sugar instance.
- The second line specifies the path where the New Relic provider files can be found.
Note: When overwriting the New Relic provider, this path must be changed to the location where the files are located in the./custom/directory. - The last line allows you to configure a custom application name so that you may make a distinction between production, staging and development environments. This name will be displayed in your New Relic application list. Simply replace the text inside the double quotes with your desired application name. In the example above, we name the application, "SugarCRM New Relic".
Using New Relic for PHP
New Relic integrated with Sugar enables you to view the exact functions that cause unusual performance behavior in your instance, such as unexpected triggering of logic hooks, database queries that should be optimized, or customizations that are responding slower than expected.
Shortly after completing the configuration steps above, a new application will appear in the New Relic APM interface's application list. Click on the appropriate application's name to view the overview dashboard.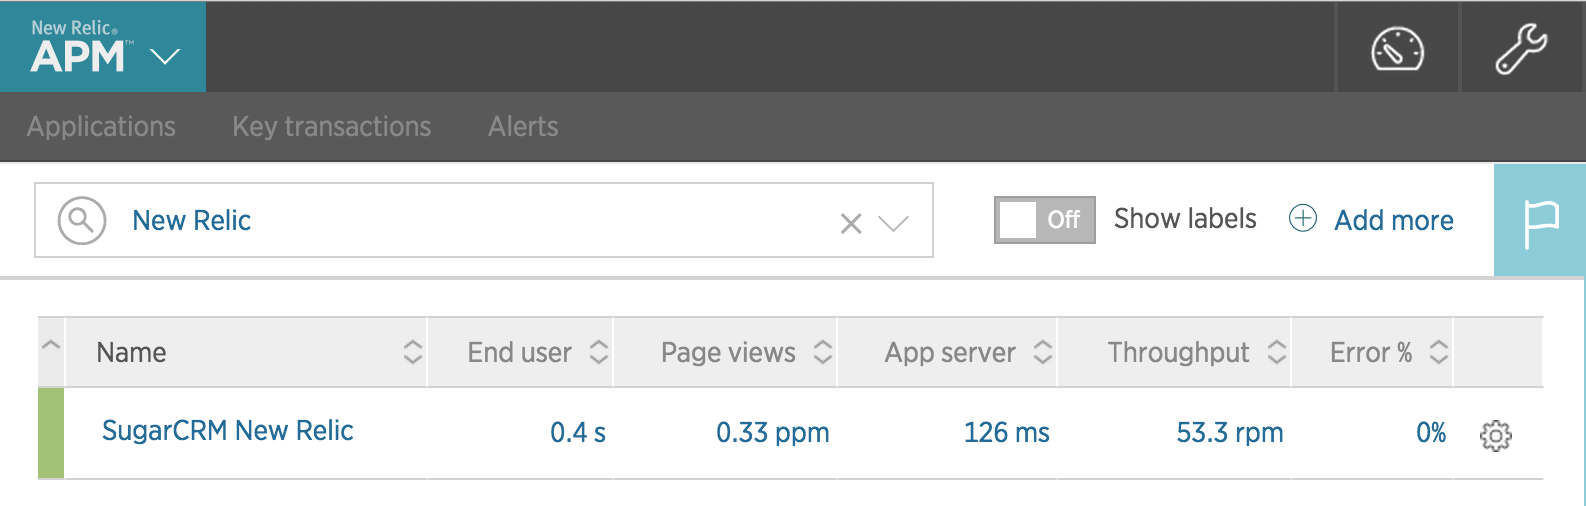
Overview Dashboard
The dashboard gives you a quick overview of server response times over a selected period. By default, it will show data collected within the last 30 minutes. To the right of this chart is the Apdex (short for application performance index) chart. Apdex provides an easy way to measure whether performance meets user expectations.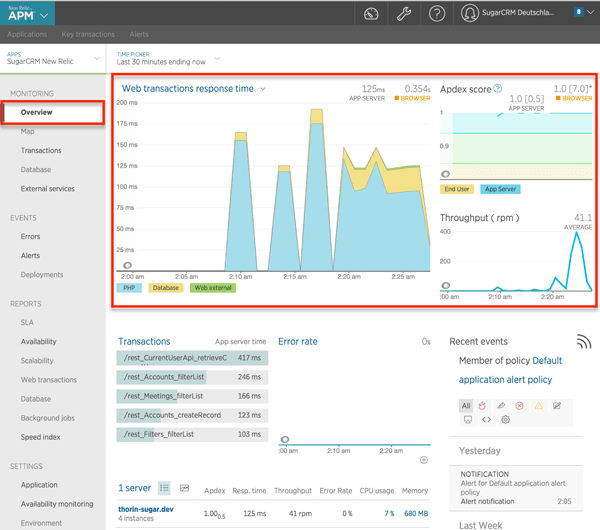
In this instance, the Apdex threshold, or T-value, is configured to 0.5 seconds. This means that an app server response time of 0.5 seconds or less is satisfactory for the users, a response time between 0.5 seconds and 2.0 seconds is tolerable, and any value higher than 2.0 seconds becomes frustrating. 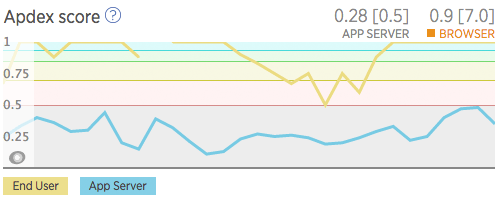
The default Apdex T-value for New Relic is 0.5 seconds but it can be configured to match your current environment and user expectations. For information on changing the Apdex T-value, please refer to the Change Your Apdex Settings article in the New Relic documentation.
Transactions
The Transactions listing is one of the most powerful tools available in New Relic. It will reveal the specific calls or actions that are taking the most time and resources from the server, and speculate as to why. Select "Transactions" in the menu on the left to see a full overview of all the calls done in sugar, sorted by the most time consuming.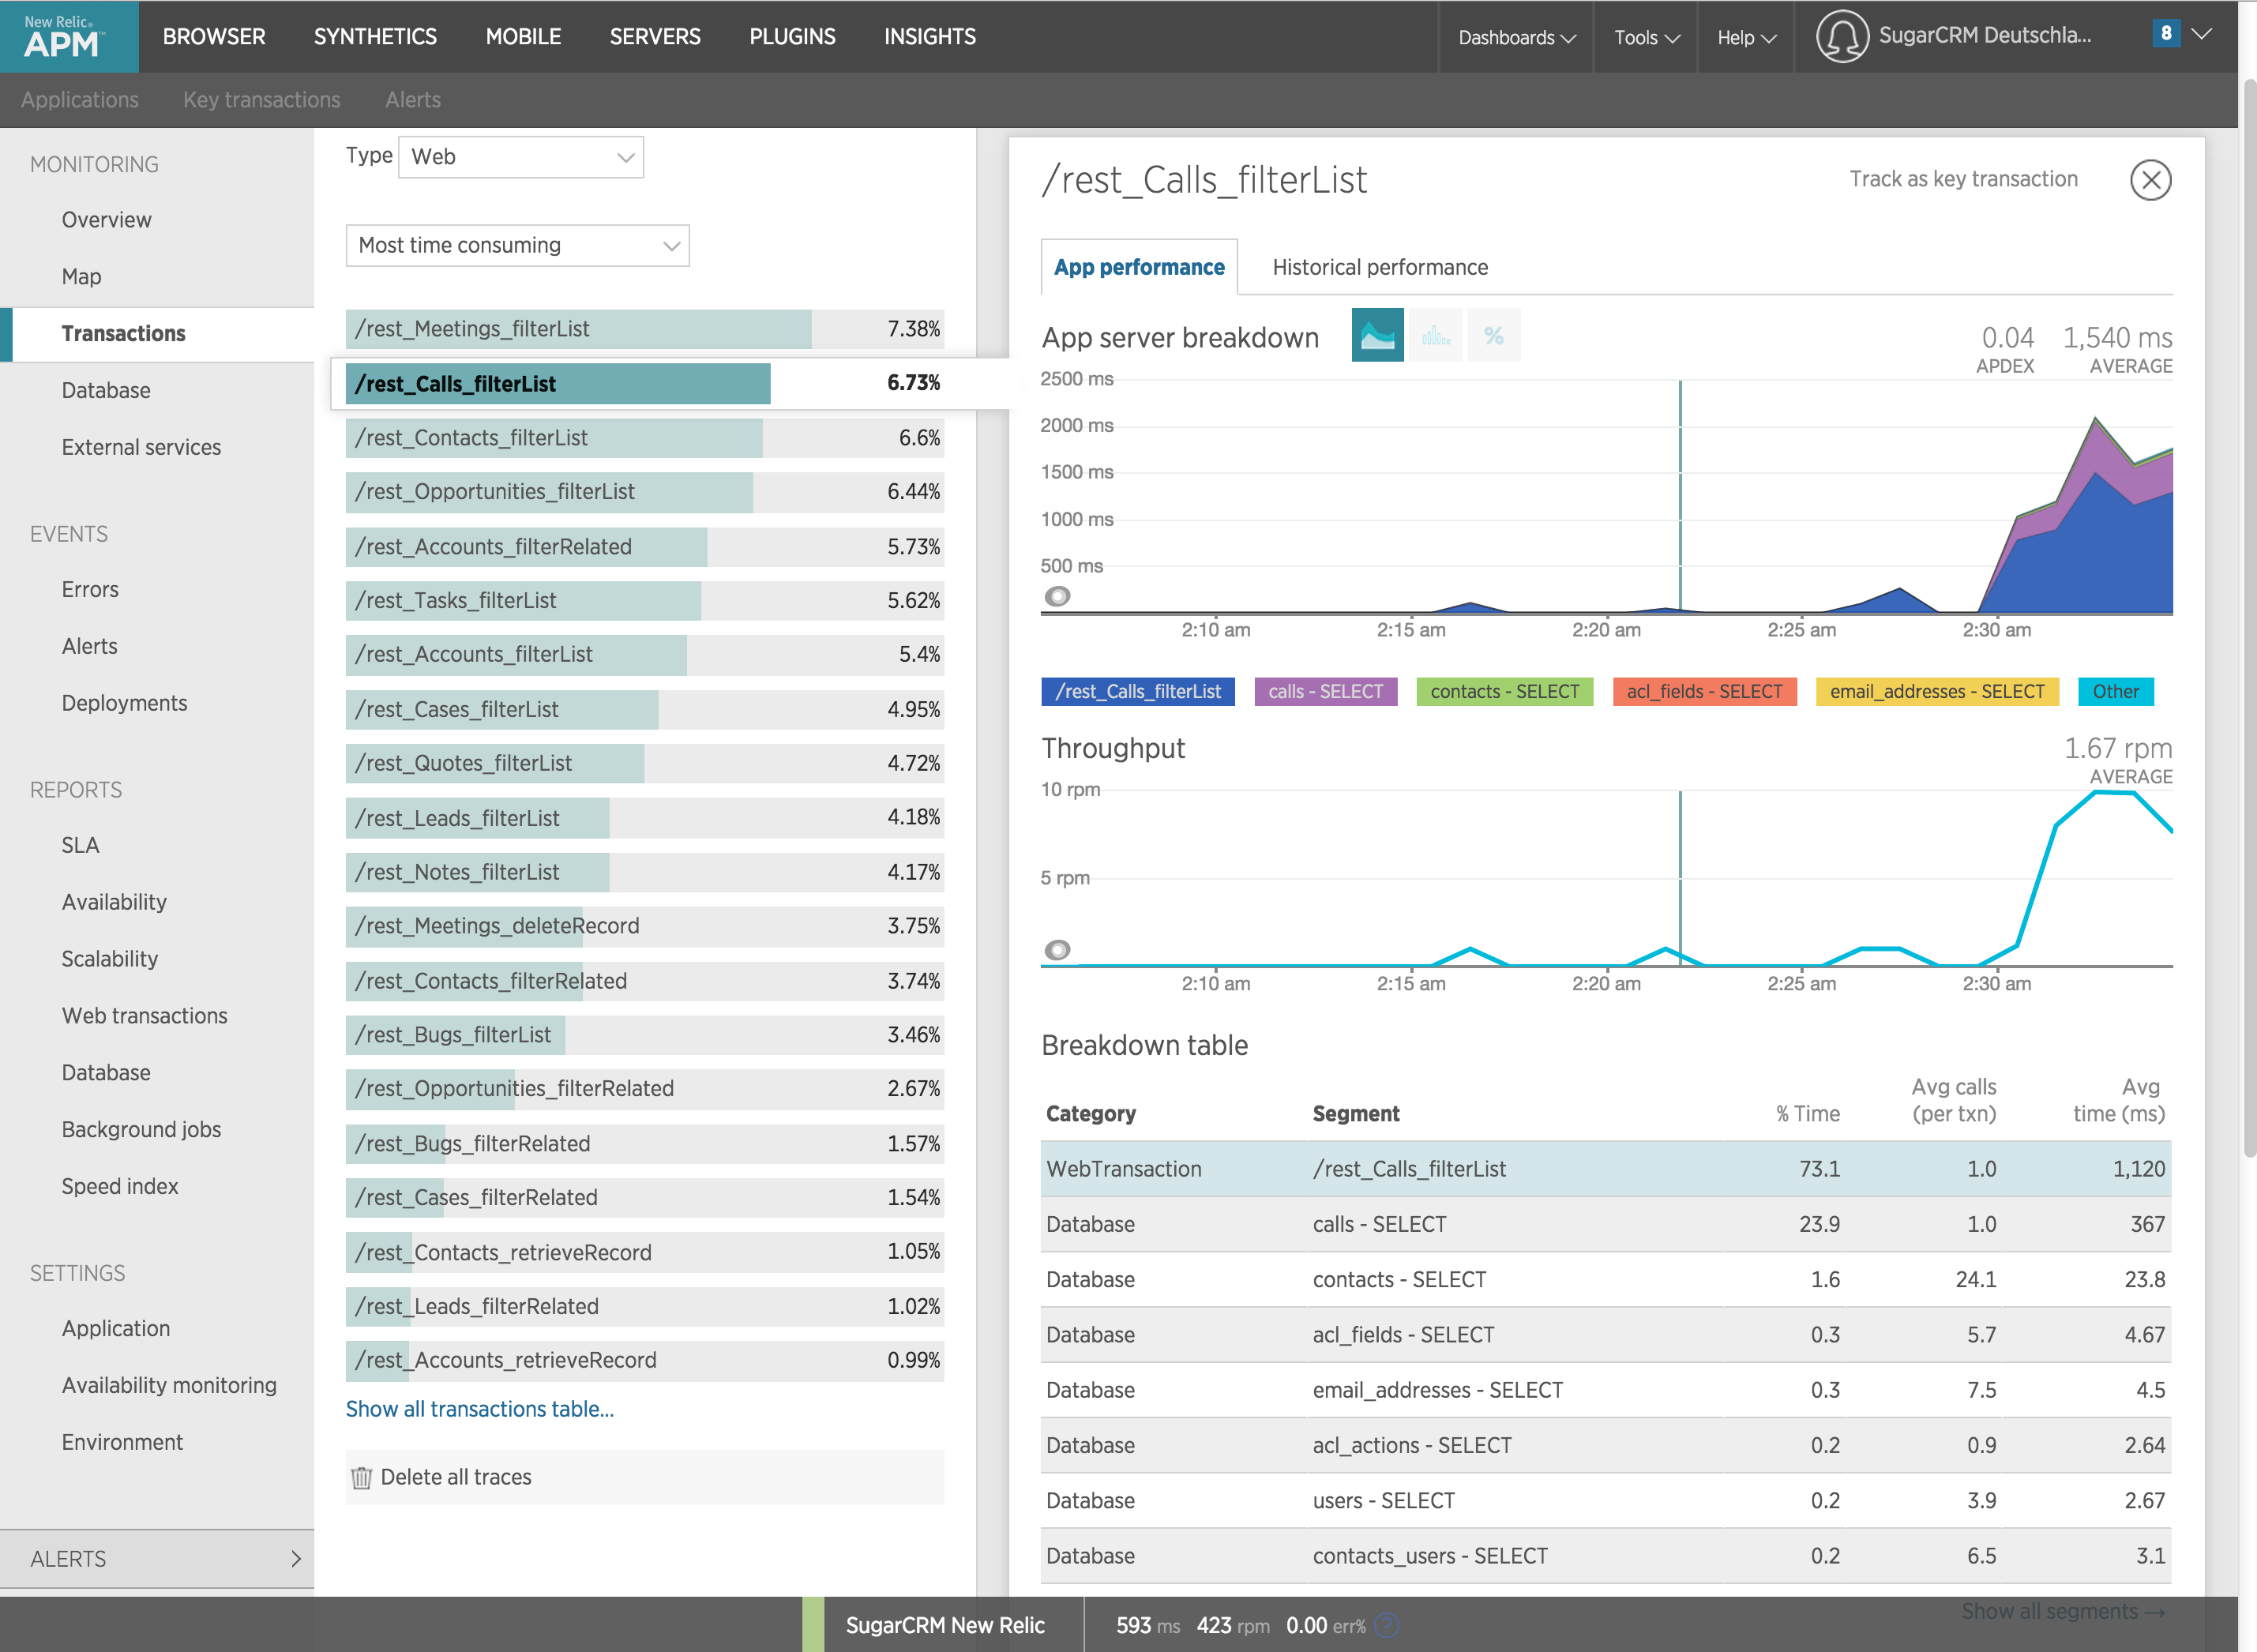
In this case, rest_Calls_filterList is selected, which monitors the length of time that it takes to call the Calls module's list view. The performance data for this transaction is displayed on the right. As you can see at the top of the chart, calling the Calls listview has an average response time of 1.5 seconds.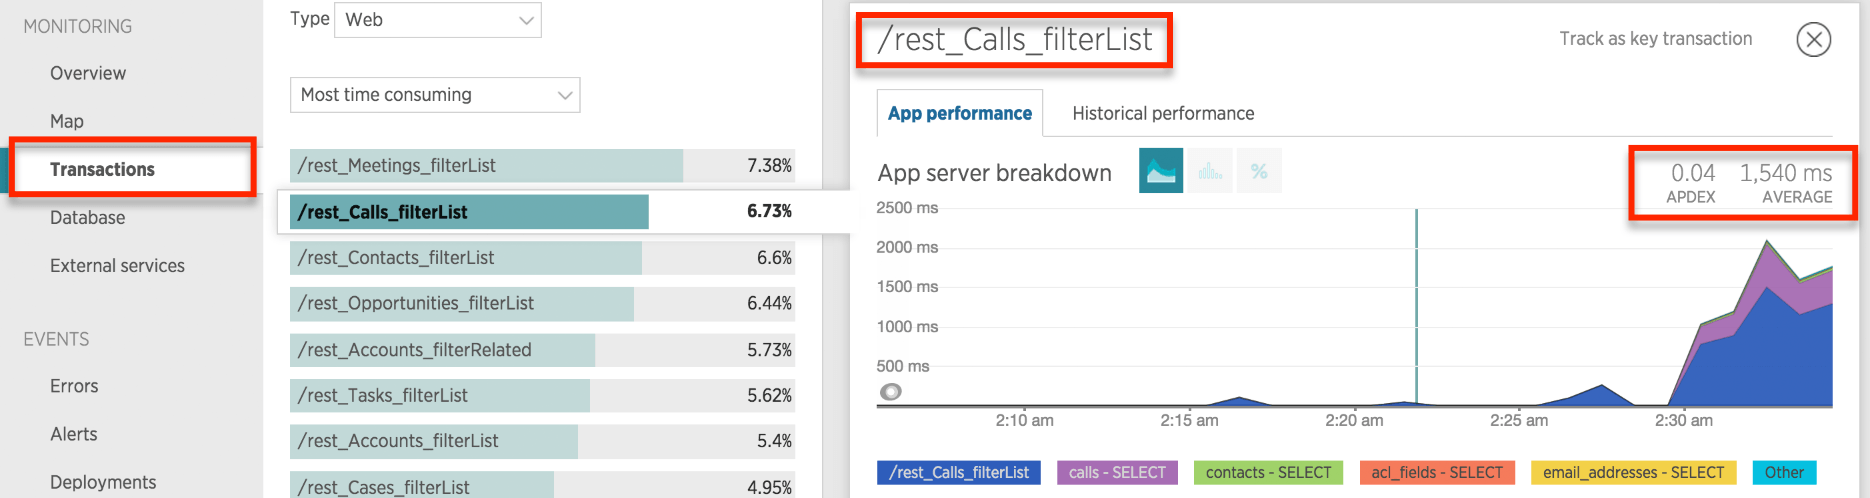
Refer to the breakdown table in the lower part of the screen to see which part of the call is taking the most time, with a representation of the performed actions on the database per segment.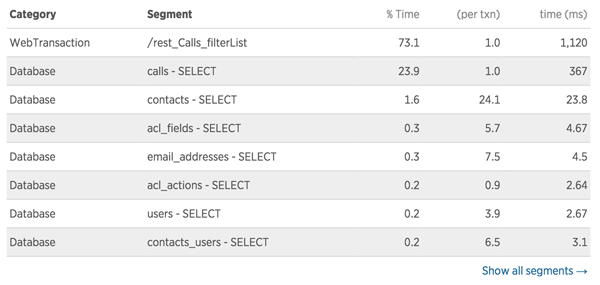
Below the breakdown table is a list of transaction traces. New Relic will automatically generate a transaction trace when a response time is in the frustrating zone of the Apdex or slower. Click on the transaction trace to learn what is having the negative impact on the performance for this activity. 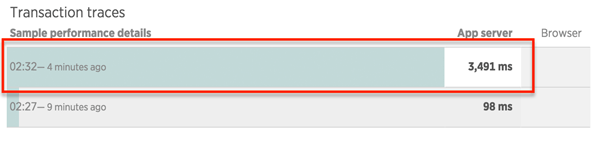
The transaction trace shows how long various components took to load. In this case, the SELECT query on the Calls table took a significant amount of time.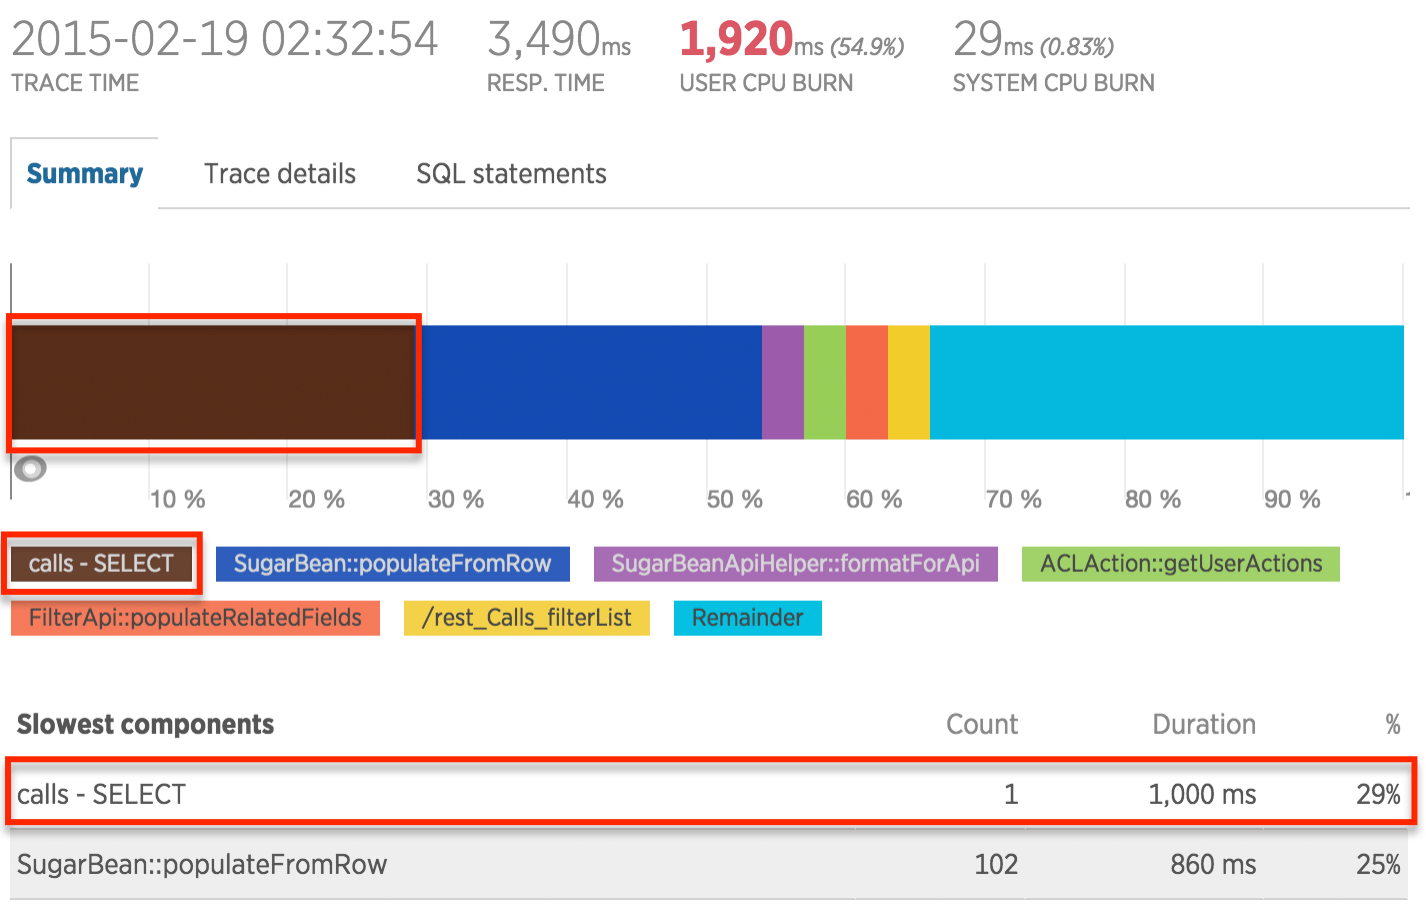
Click on the Trace Details tab above the chart to investigate further. The details page displays specific functions that are being called and how long they took to execute. By drilling down in the tree to the child functions, it is possible to find the root cause of the impaired performance.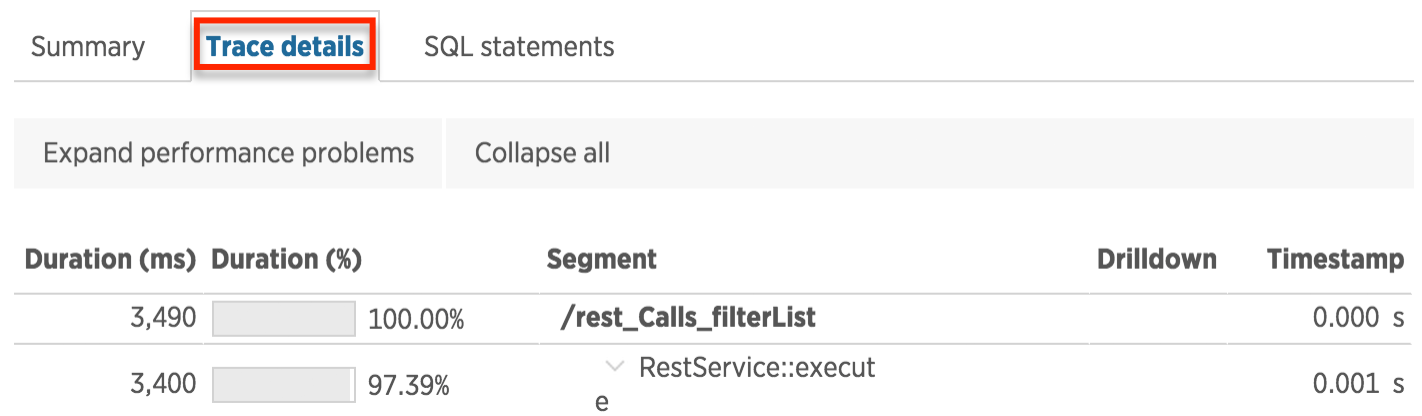
Scroll down to find the SELECT query on calls took 1 second to load. 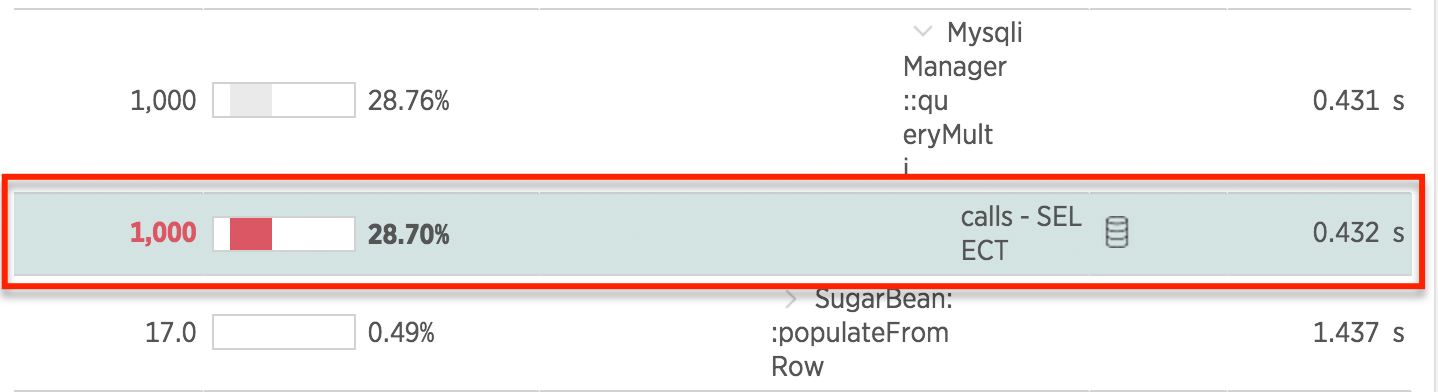
Click on the database icon next to the action to reveal the SQL query called by Sugar.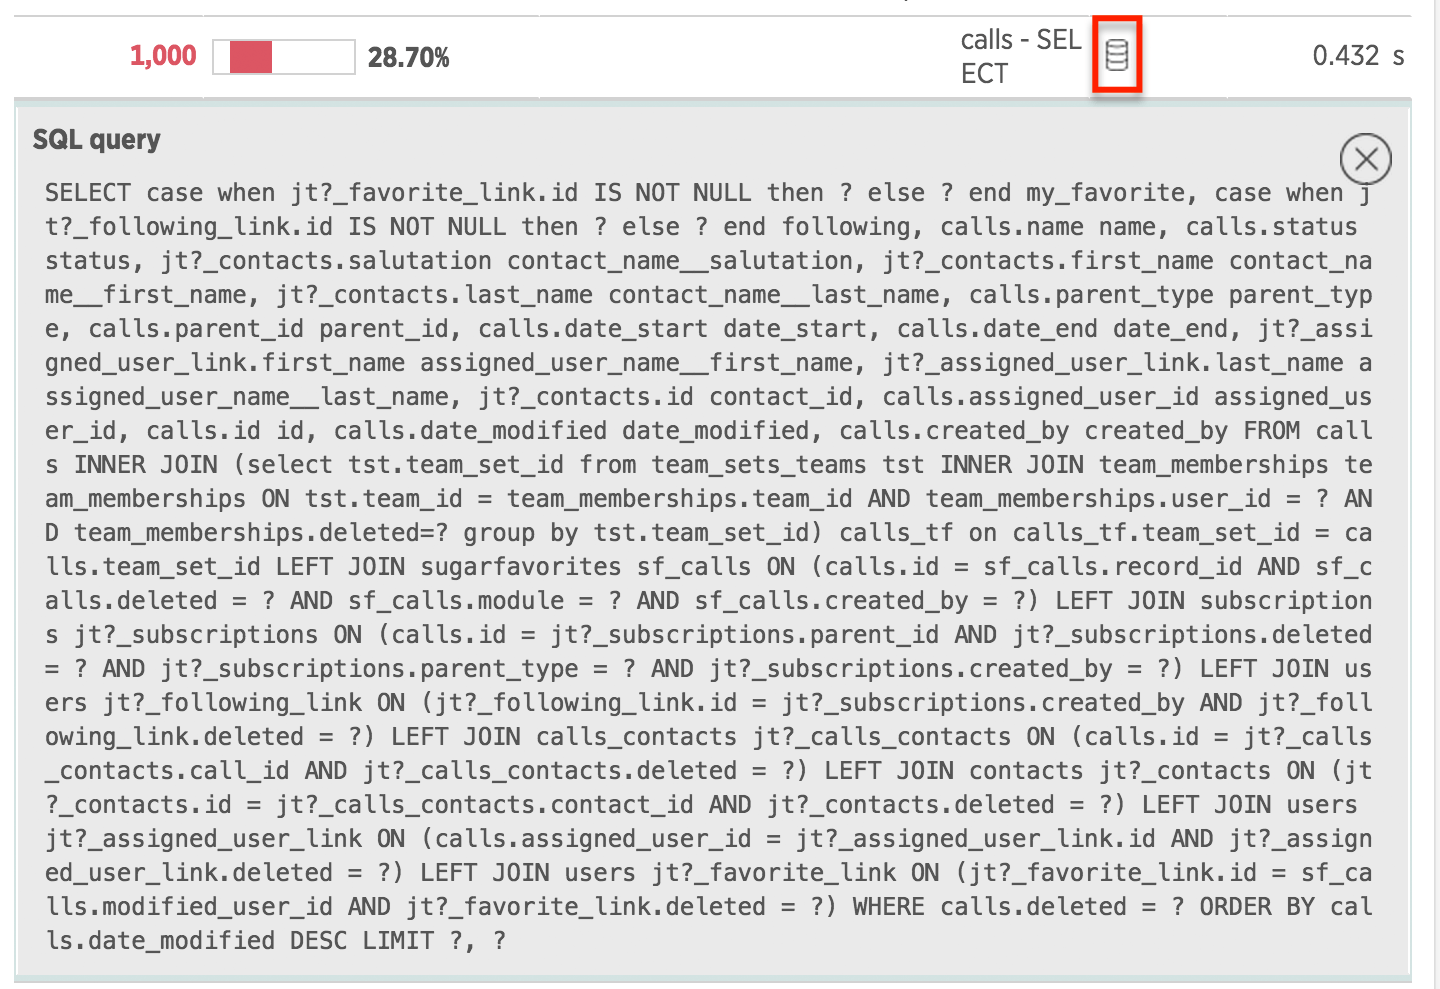
To view all SQL queries at once, click on the SQL Statements tab.
Summary
For critical business applications like CRM, an APM tool can you help keep your system running fast so end users stay productive and your organization sees a maximum return on investment. An integrated APM will monitor, analyze, and visualize the response times of your application to identify bottlenecks so that your team can proactively address them.
To learn more about using New Relic for PHP, please visit the New Relic documentation website.