User Interface
Overview
This documentation covers the basics of sales-i user interface.
Home Dashboard
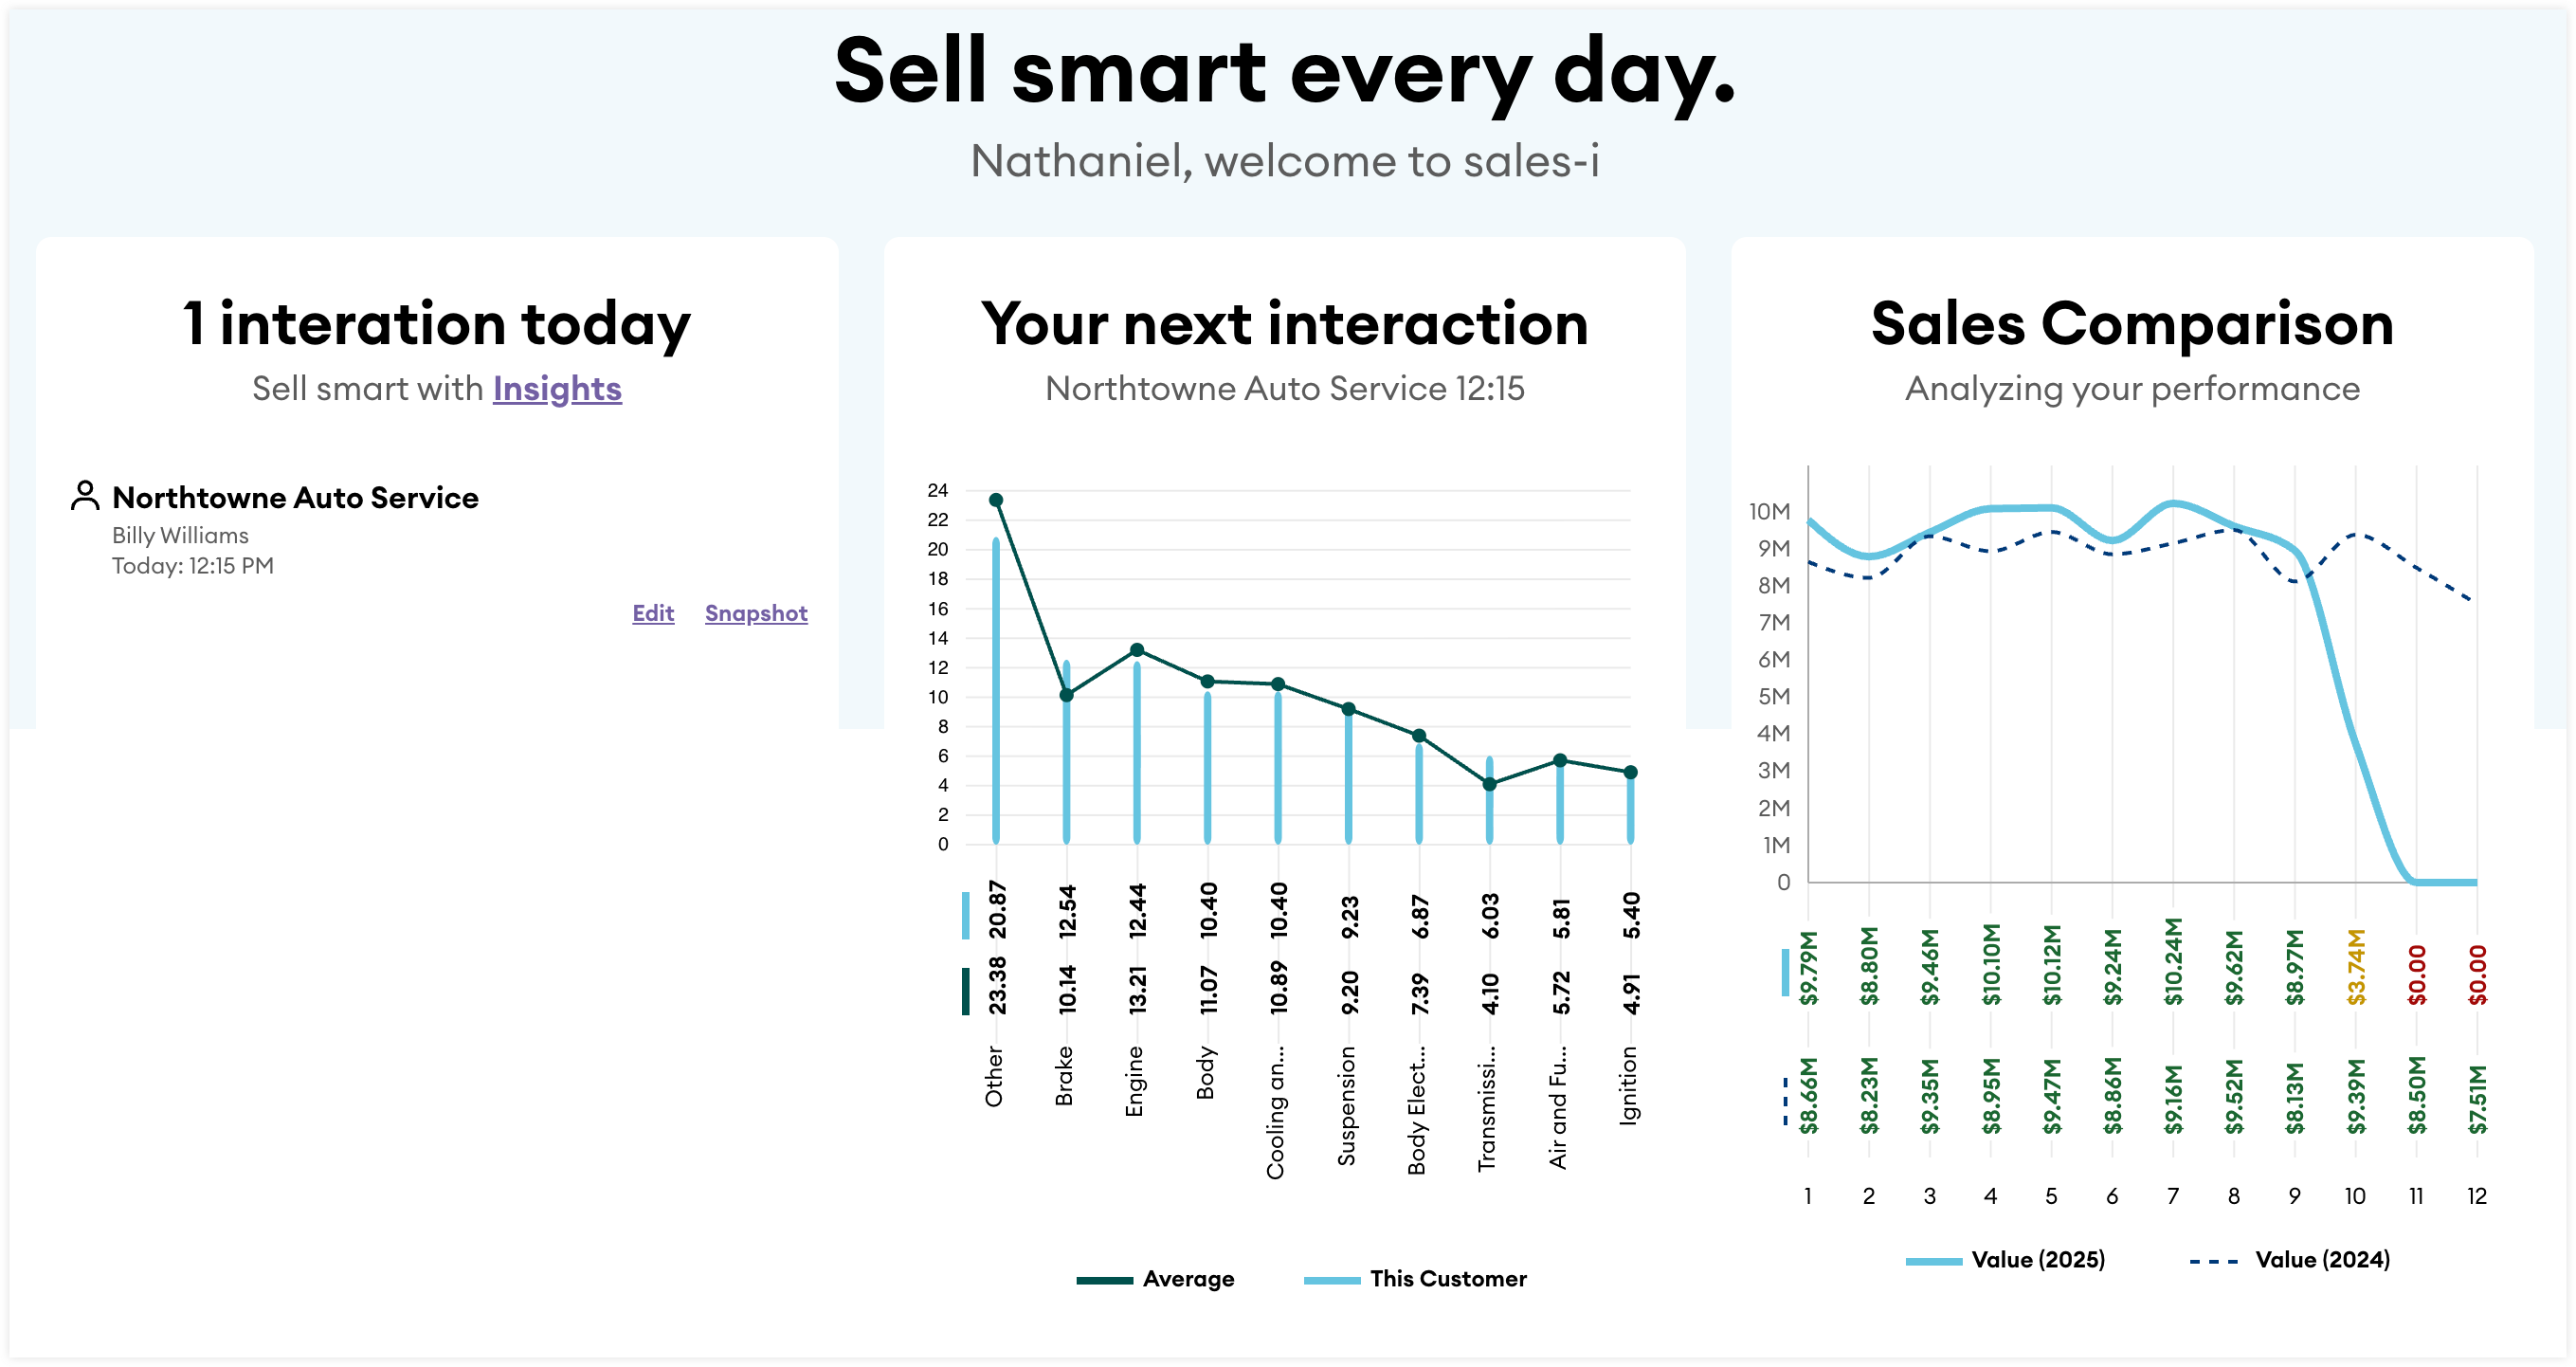
When you log in to sales-i, the first thing you’ll see is your home dashboard. At the top, you can review all your interactions scheduled for the day, get insights on your next interaction, and track your year-to-date sales performance compared to last year.
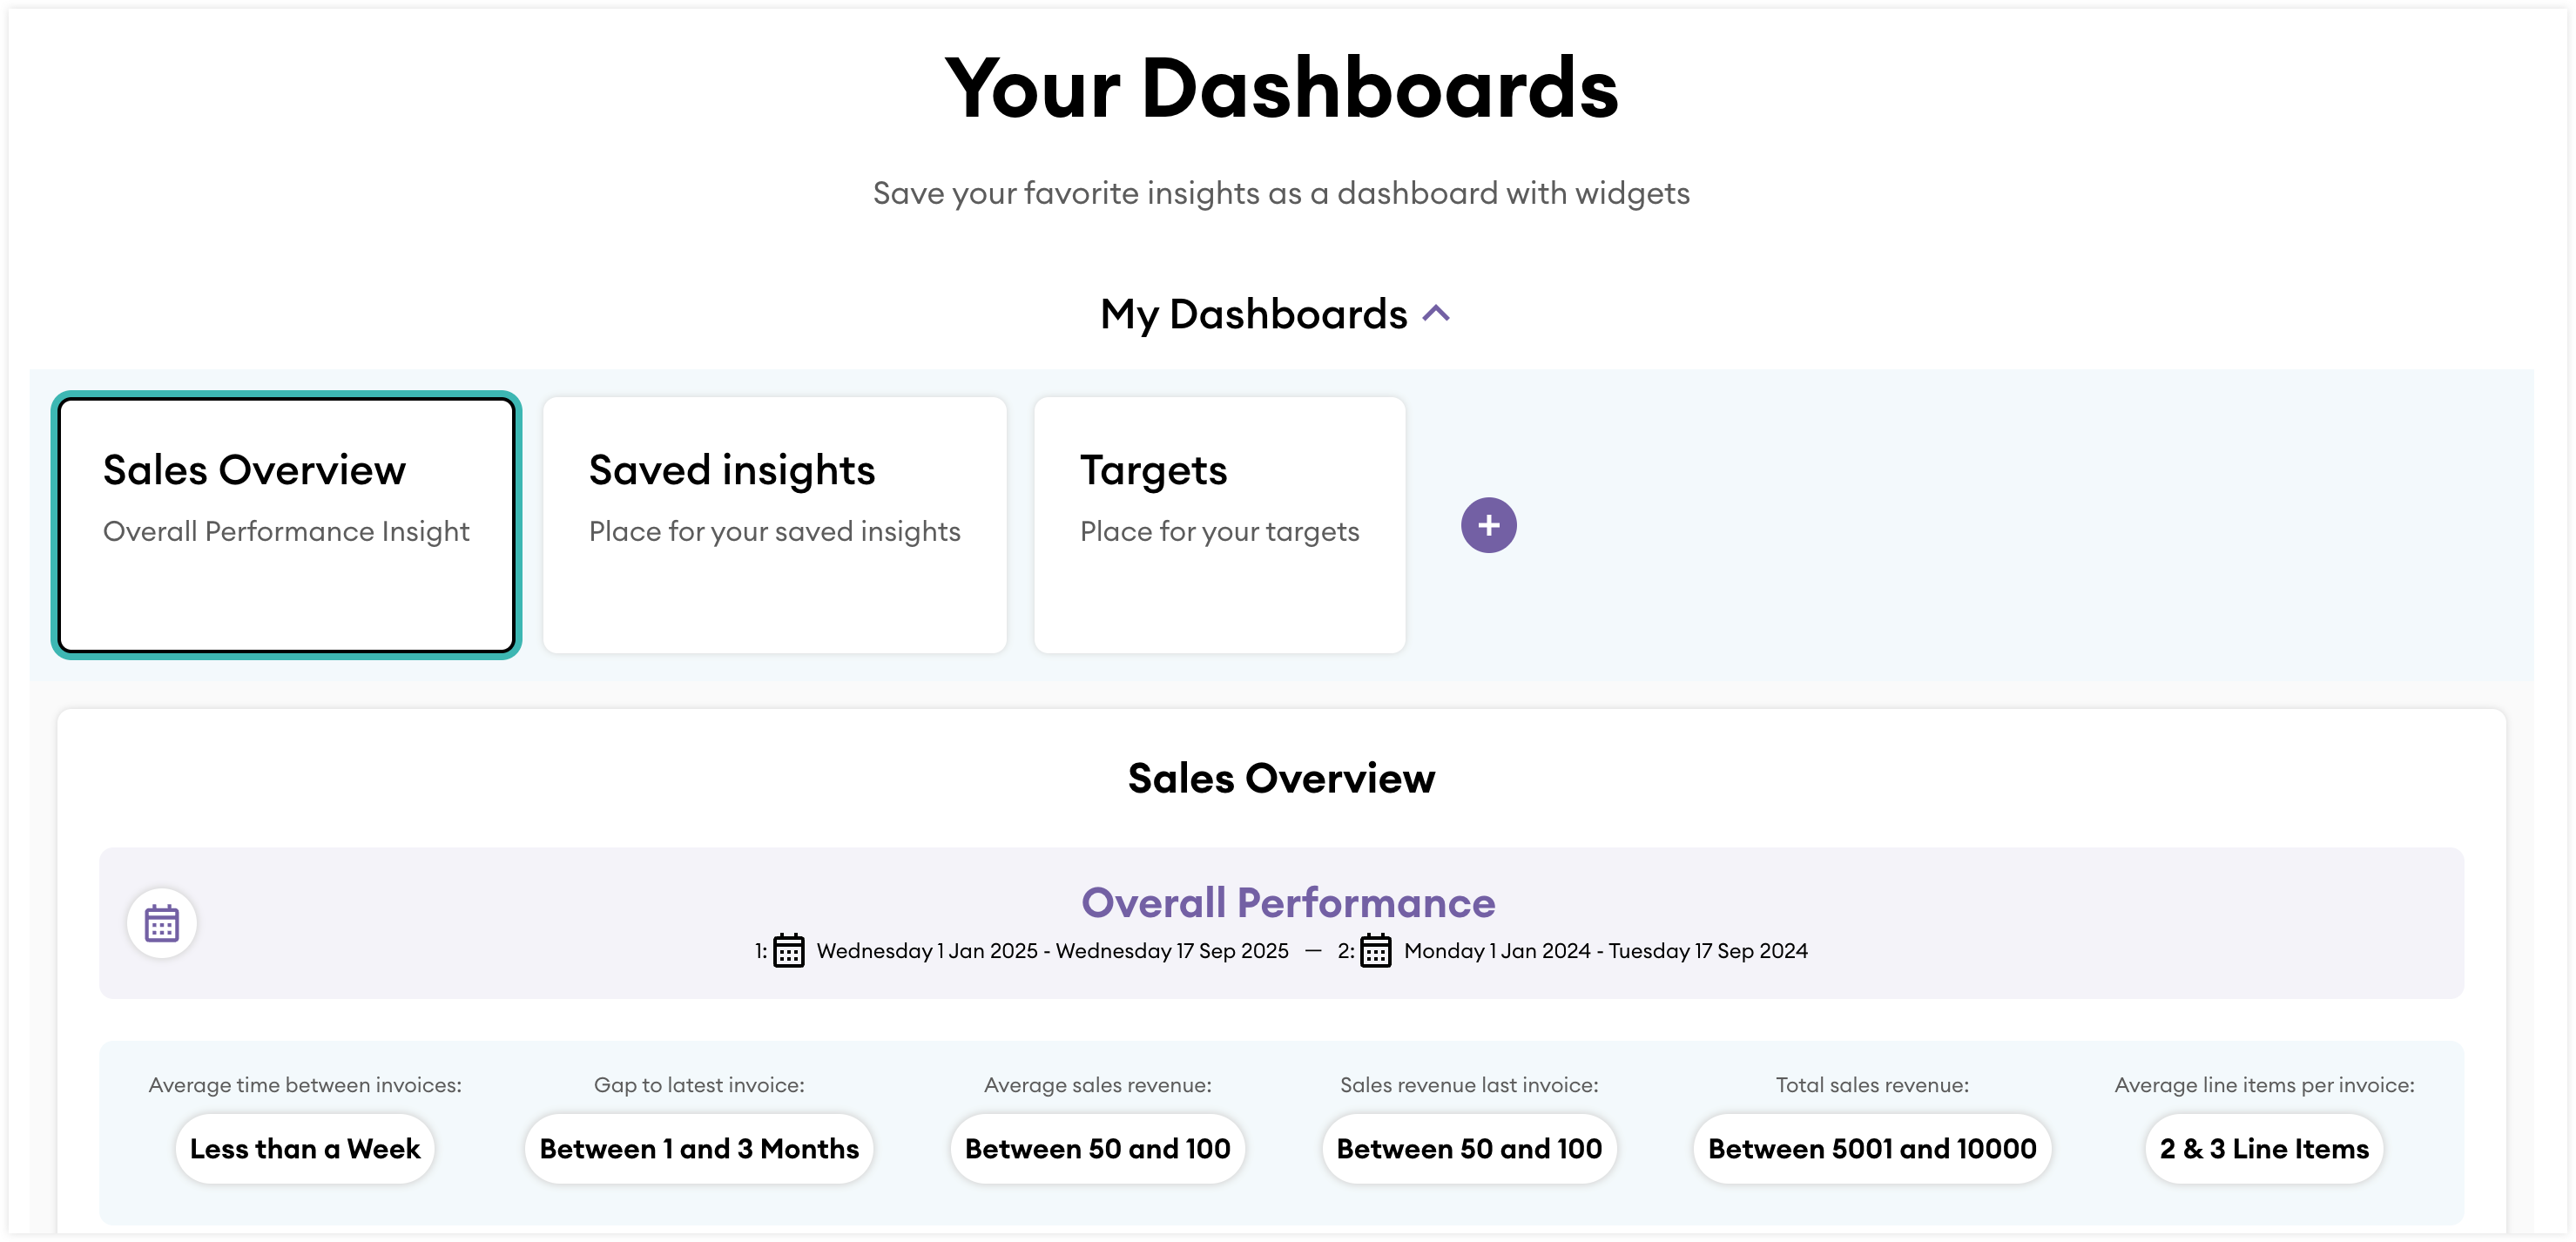
Further down, Your Dashboards section lets you drill into your sales performance, monitor progress toward your targets, and add Inquiries and Insight reports to customize your dashboard to your needs.
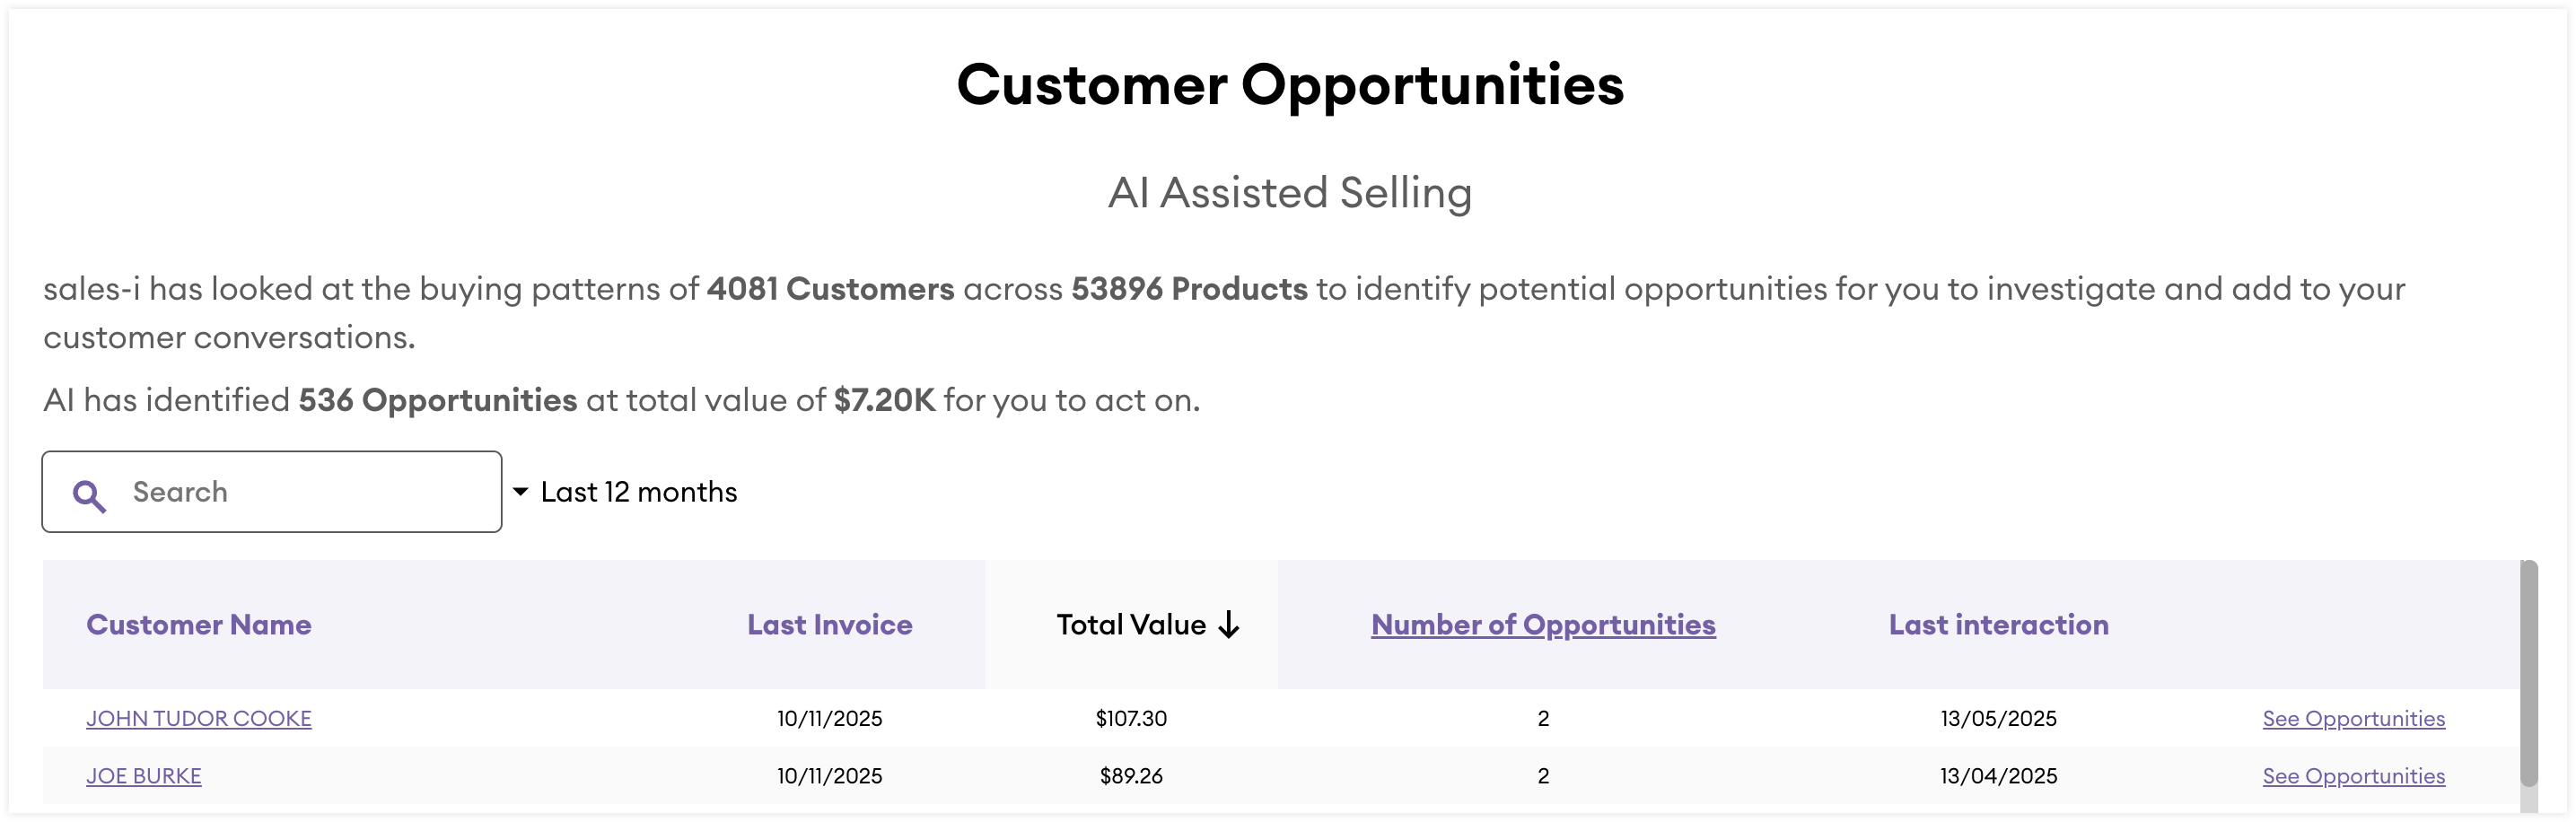
The Customer Opportunities section displays AI-generated opportunities, helping you identify potential cross-sell and upsell opportunties for your existing customers.
Navigation
At the top of sales-i is the navigation bar. The options available may vary based on your user permissions.

| Icon | Name | Description |
 |
Logo | Returns you to your home dashboard |
| Inquiries | Opens a dropdown to navigate to a specific Inquiry type | |
| Insights | Opens a dropdown to navigate to a specific set of Insight reports | |
| Alerts | Opens the Alert Builder | |
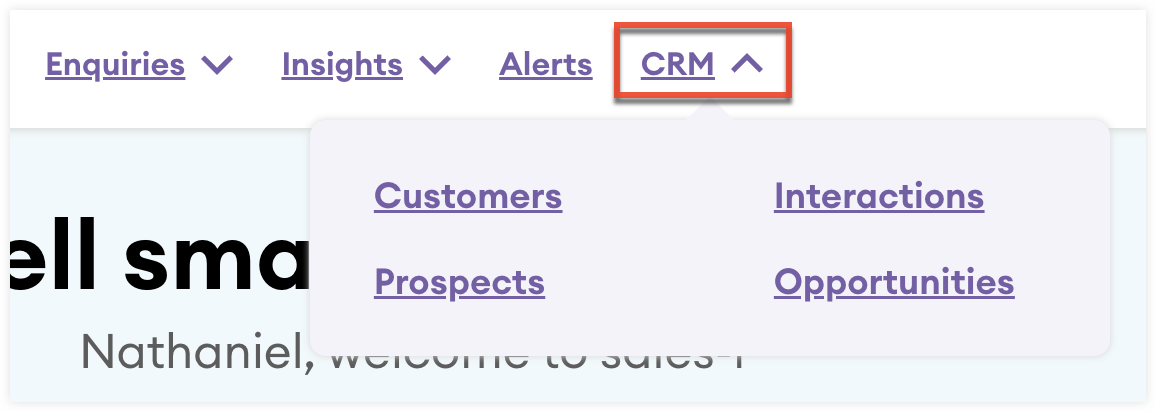
| CRM | Opens a dropdown to navigate to a specific record list view | |
| Search | Opens a search bar where you can select a record type and search by name | |
|
Notifications |
Opens the notifications panel | |
| Opens a dropdown to toggle profit value visibility and adjust display language and currency | ||
|
User/System Settings |
Opens a dropdown to access user and system settings and log out of sales-i |
Display Settings
From the display settings you can configure the following options:
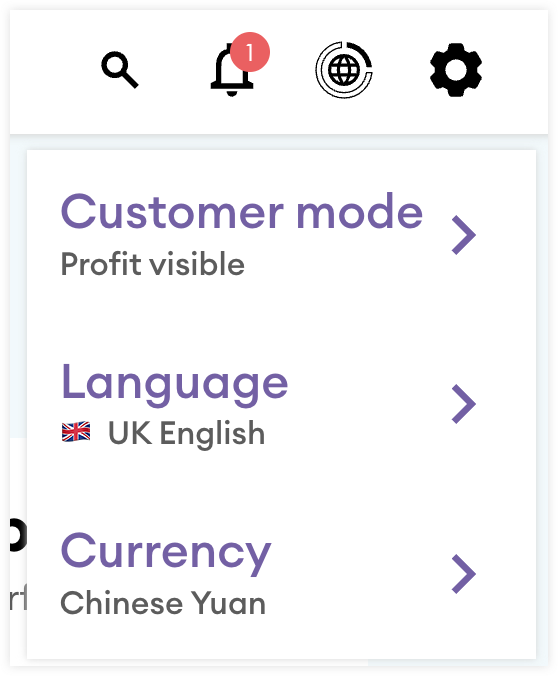
- Customer mode: Use the Customer mode setting to toggle between "Profit visible" and "Profit hidden". When "Profit hidden" is selected all profit values will be hidden across sales-i.
- Language: Use the Language setting to adjust the display language of sales-i. The languages available are set by your administrator.
- Currency: Use the Currency setting to adjust the display currency of sales-i. The currencies available are set by your administrator.
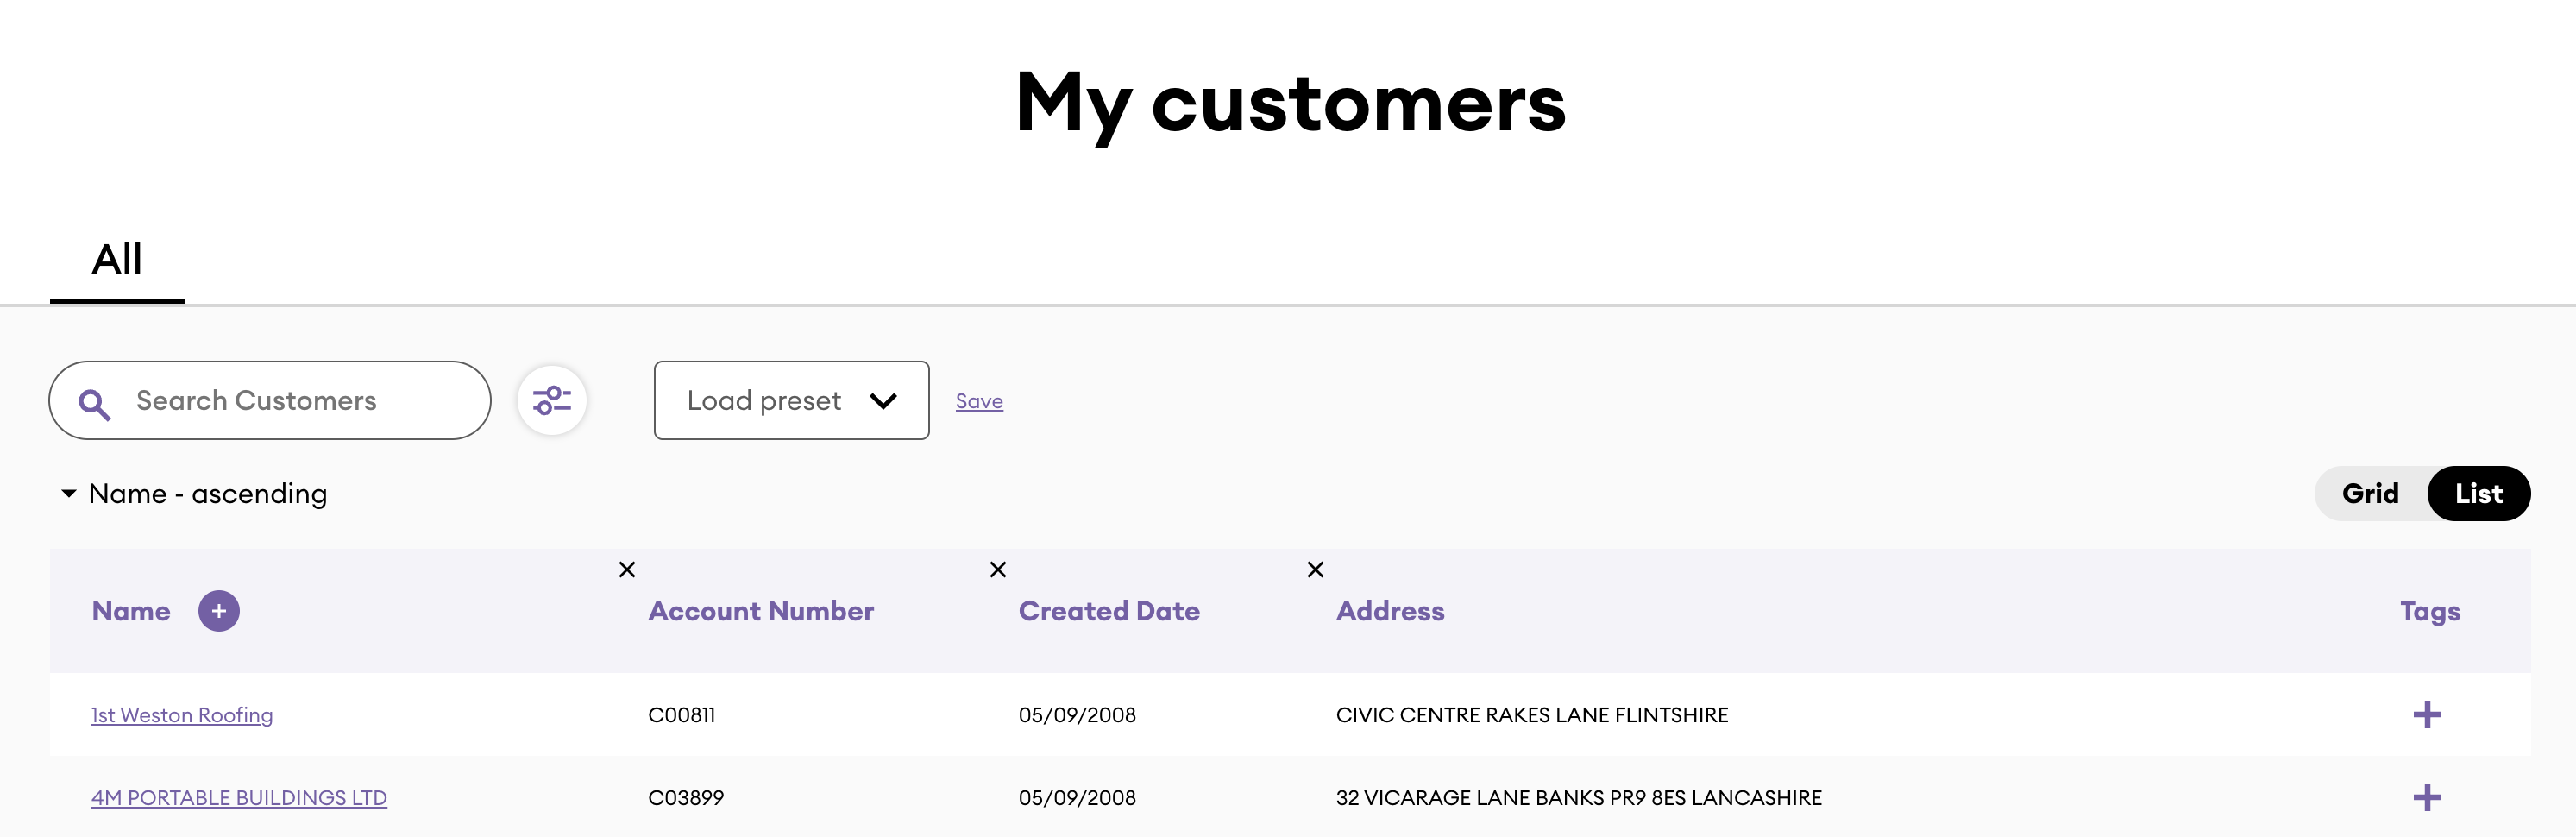
List View
The Customer, Prospect, and Opportunity list and grid views allow you to search and manage your records.
Filtering Records
Some list and grid views can be filtered by most analysis, standard, and custom fields. Follow these steps to filter a list or grid view:
- From the navigation bar, select "CRM" and then select either "Customers", "Prospects", or "Opportunities".
- From the record list or grid view, click the filter icon.
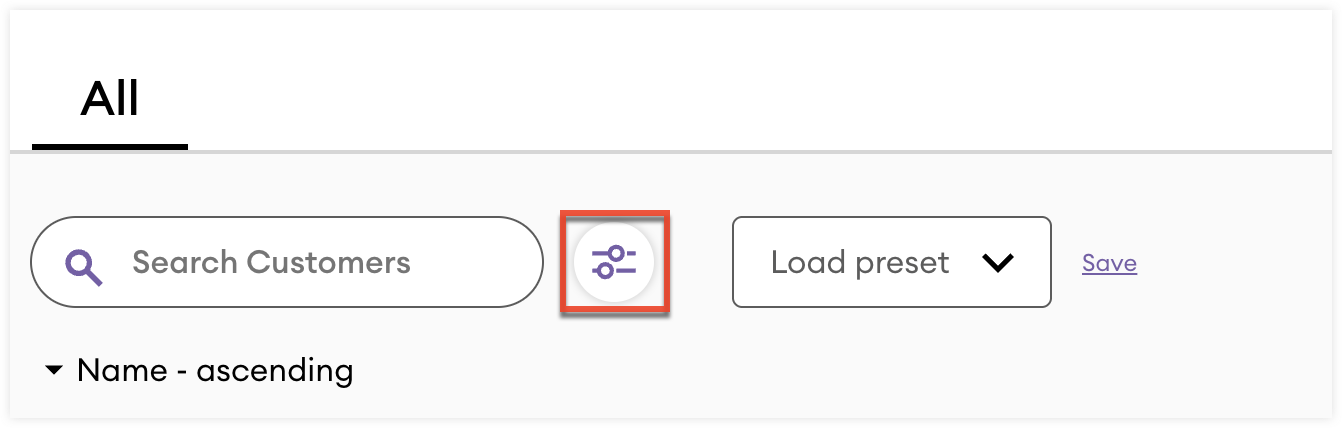
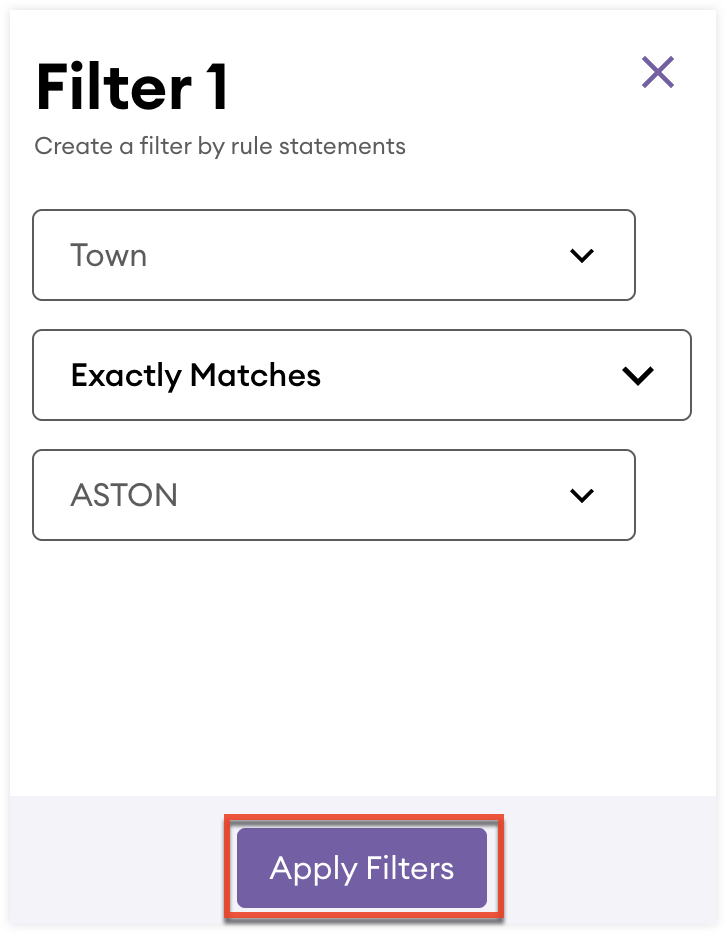
- Select a field, operator, and value to define the filter.
- Click "Apply" to apply the filter.
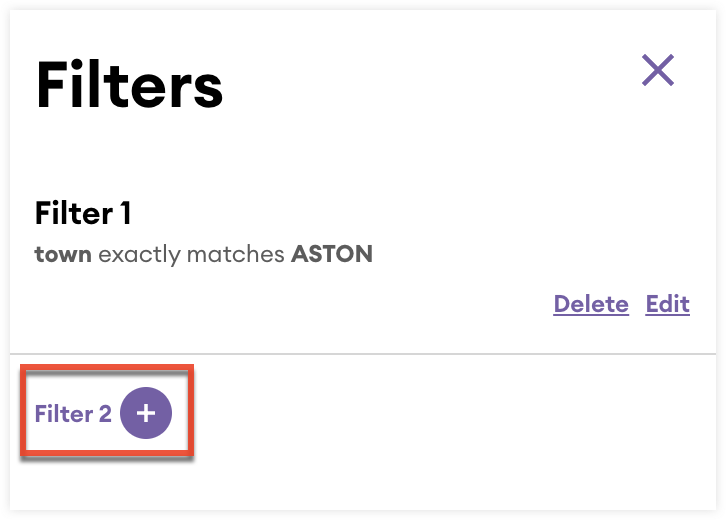
- To add an additional filter connected by "AND" logic, click "Filter X +"
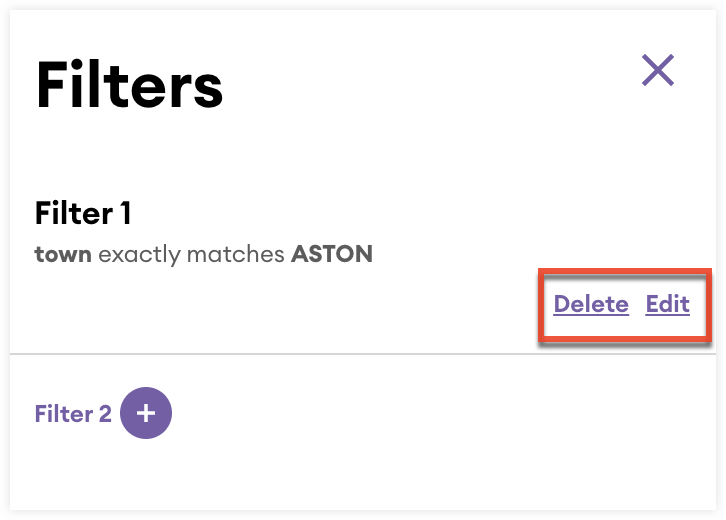
- To edit or delete applied filters, click the filter icon and then select either "Edit" or "Delete".
Managing Columns
You can add columns to a record list view to display additional information. Added columns will also appear as additional fields in the record card of the grid view. Follow these steps to add additional columns to a list view:
- From the navigation bar, select "CRM" and then select either "Customers", "Prospects", or "Opportunities".
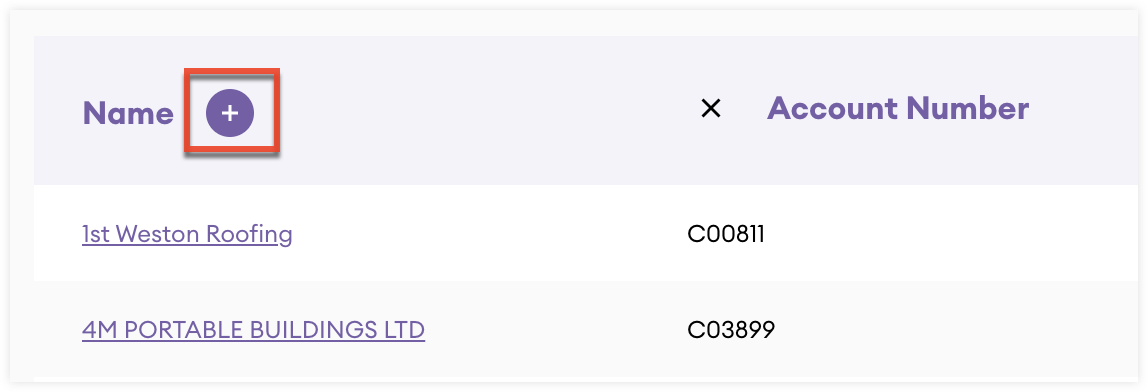
- From the record list view, click the + icon in the Name column.
- In the dropdown, search and select the checkbox next to the fields you want to add as additional columns.
- Click outside of the dropdown to add the columns to your list view.
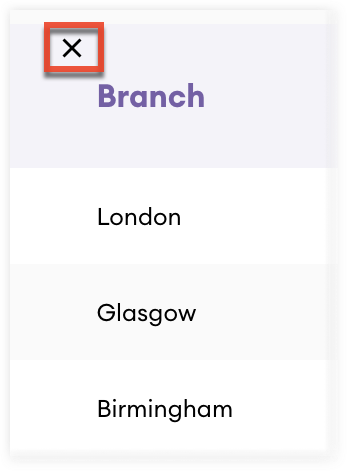
- To remove a column, click the x icon at the top left of the column.
Save and Load Filter and Column Changes as Presets
You can save and load search, filter, and column configurations as presets for the Customer, Prospect, and Opportunities list views. Follow these steps to save and load a configuration preset:
- From the navigation bar, select "CRM" and then select either "Customers", "Prospects", or "Opportunities".
- Apply your search, filters, and column configurations as needed.
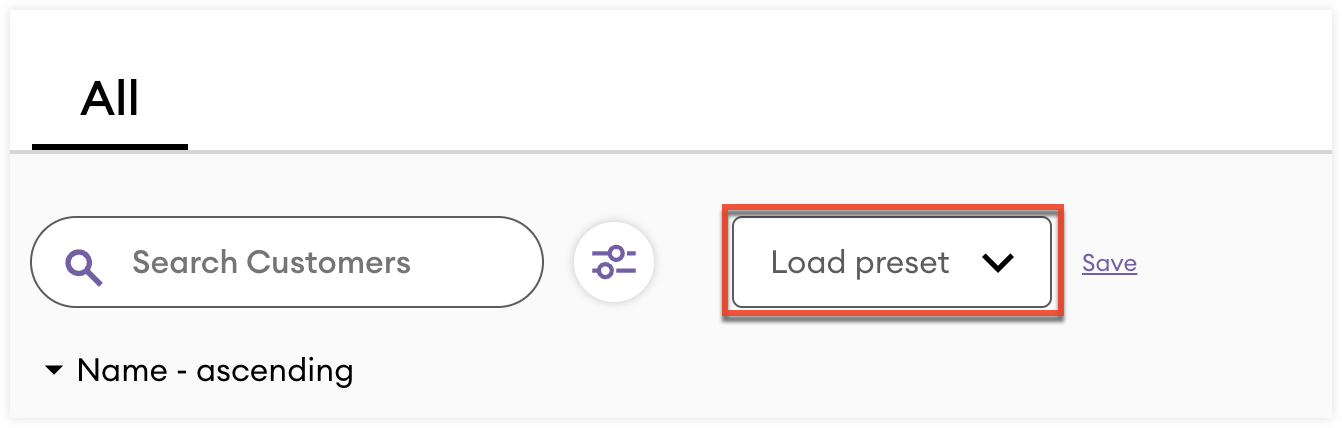
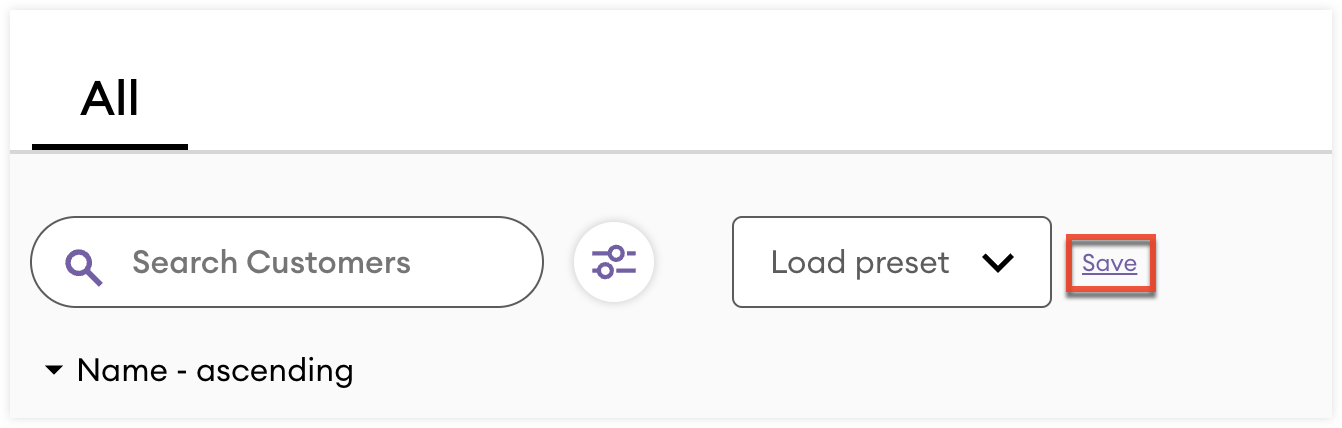
- Click "Save" at the top of the list.
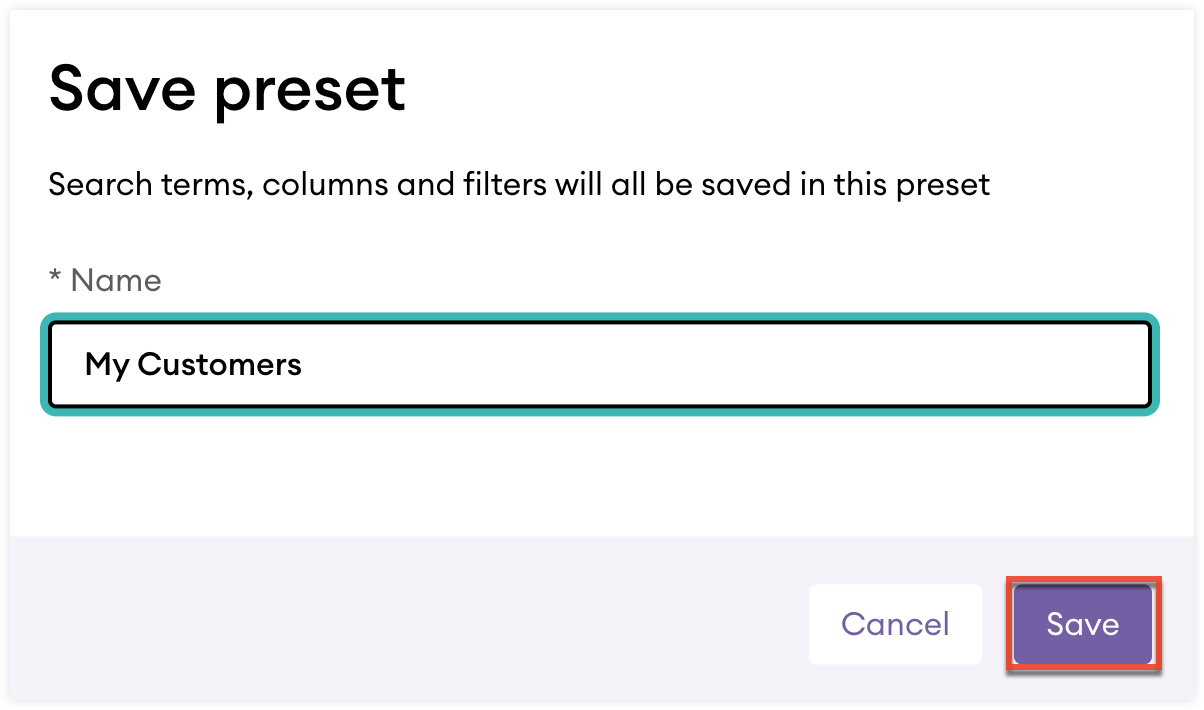
- Name the preset and click the Save button.
- To load a saved preset from a list view, select the preset from the Load preset dropdown field at the top of the list.