Insights and Snapshots
Overview
Insights and Snapshots are powerful prebuilt report libraries. Insight reports help you understand your overall sales performance and snapshot reports let you drill into sales data for a specific customer or analysis field.
This guide covers:
Using Insights
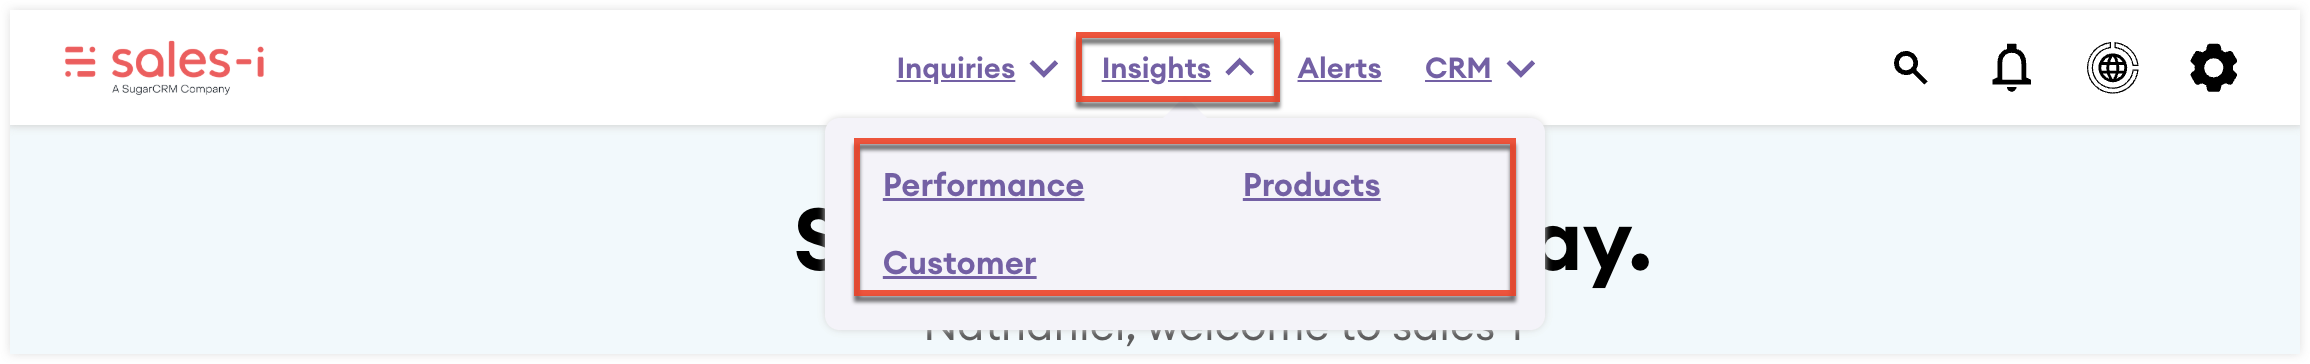
To access an insight report, select Insights from the navigation bar, then choose a category to see the available reports.
Insight Reports
This list describes the available insight reports.
| Category | Name | Description |
| Performance | Sales Opportunity | Understand the progress and value of potential, won, and loss opportunities. Sort and drill into your opportunity data by stage and assigned user. |
| Interaction Outcomes | Understand how many interactions have been created and assigned to your users. | |
| Interaction spend summary | Understand the relationship between interactions and customer spending. | |
| Products | Highest selling products | Understand which products you are selling the highest quantity of and which products are generating the most revenue. |
| Lowest selling products | Understand which products you are selling the lowest quantity of and which products are generating the least revenue. | |
| Highest margin product | Understand which products have the highest revenue margin. | |
| Lowest margin product | Understand which products have the lowest revenue margin. | |
| Highest selling product group | Understand which product groups you are selling the highest quantity of and which products groups are generating the most revenue. | |
| Lowest selling product group | Understand which product groups you are selling the lowest quantity of and which product groups are generating the least revenue. | |
| Highest margin product group | Understand which product groups have the highest revenue margin. | |
| Lowest margin product group | Understand which product groups have the lowest revenue margin. | |
| Product Associations | Understand the history and performance of AI/ML generated product associations. | |
| Customer | Highest margin customer | Understand which customers have the highest revenue margin. |
| Lowest margin customer | Understand which customers have the lowest revenue margin. | |
| Highest revenue customer | Understand which customers generate the most revenue. | |
| Lowest revenue customer | Understand which customers generate the least revenue. | |
| Customer down spend | Understand which customers are spending less YTD by percent. | |
| Customers with zero spend in the past months (lost accounts) | Understand which customers have generated no revenue in set periods of time. | |
| Customers with reduced spend by percentage | Understand which customers are spending less YTD by percent. | |
| Customers whose spend is down on last year | Understand which customer are spending less YTD and filter by a revenue range for the current year. | |
| Dormant YTD, spending this period | Understand which customers are spending this period but have not made another purchase YTD. | |
| Last 6 complete months, but not yet bought this month | Understand which customers have consistently been making purchases for the last six months but have not made a purchase this month. | |
| Customers (or Top Accounts) that have Not Bought our most profitable products (in the last [3/6/12 period]) | Understand which customers have not purchased your most profitable products in set periods of time. | |
| Customers who have decreasing spend period on period | Understand which customers have been generating less revenue over a set period of time. | |
| Customers Activity | Understand how many interactions have been created for your customers and customer KPIs. | |
| Customer Snapshot | Understand sales data for a specific customer with a collection of powerful reports. |
Using Snapshots
Snapshots are a collection of reports helping you understand sales data for a specific customer or analysis field.
Customer Snapshot
You can access customer snapshots via Insights or directly from a customer record view.
To access a customer snapshot from Insights:
- Select Insights from the navigation bar and select the Customer category.
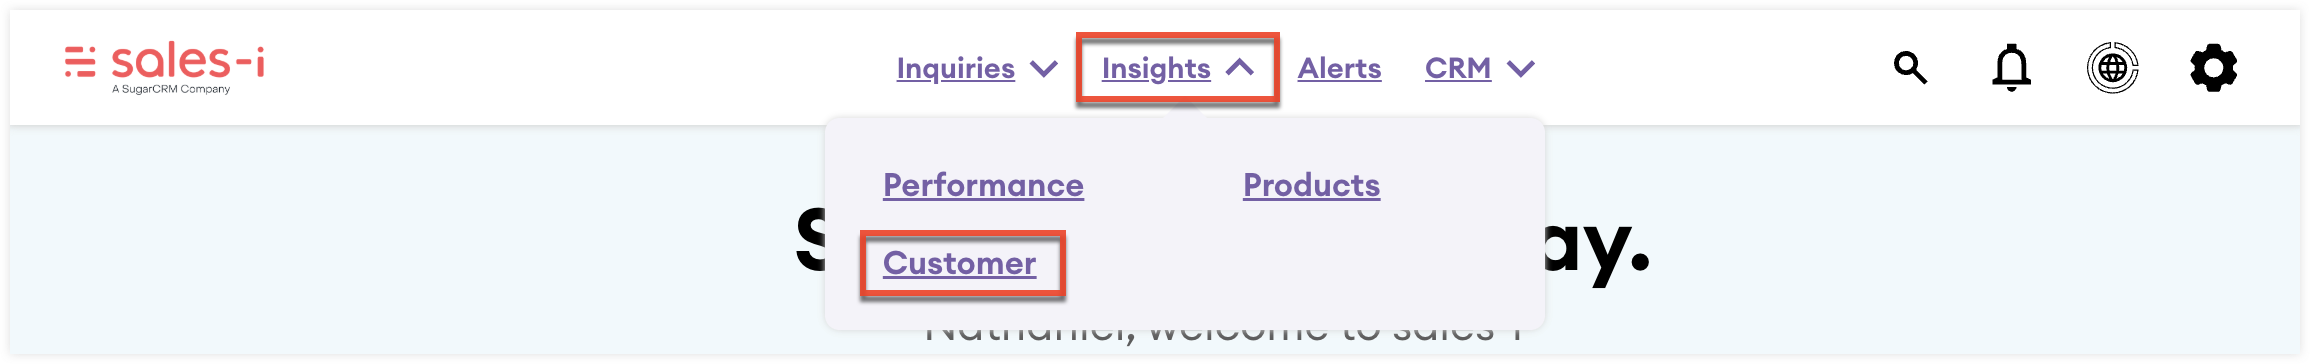
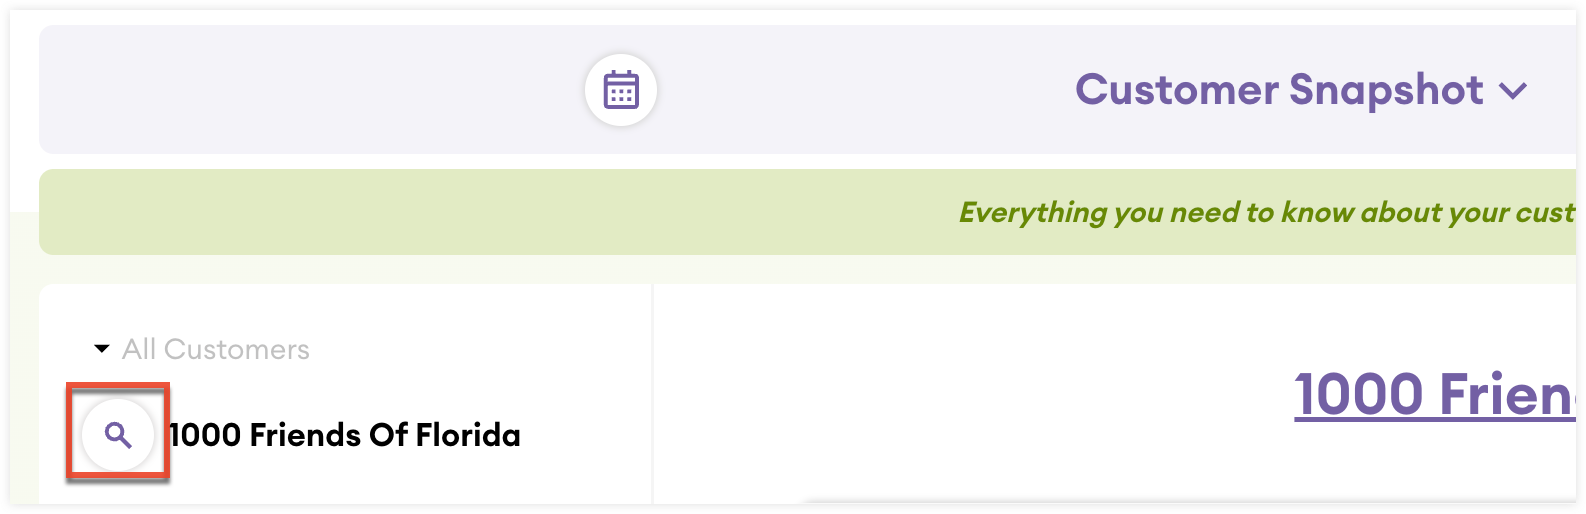
- Select the Customer Snapshot card.
- Click the search icon to search and select a customer.
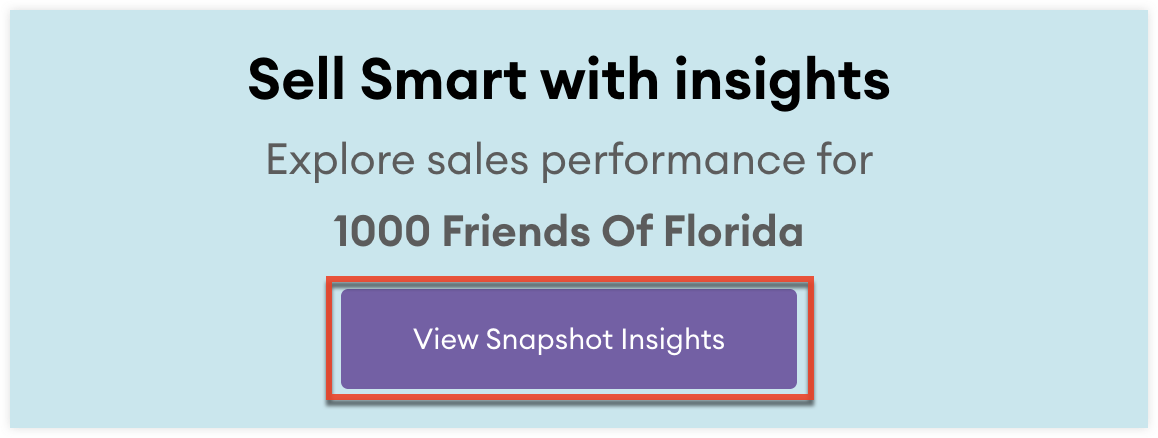
To access a customer snapshot from a customer record view:
- From the customer record view, navigate to the Overview tab.
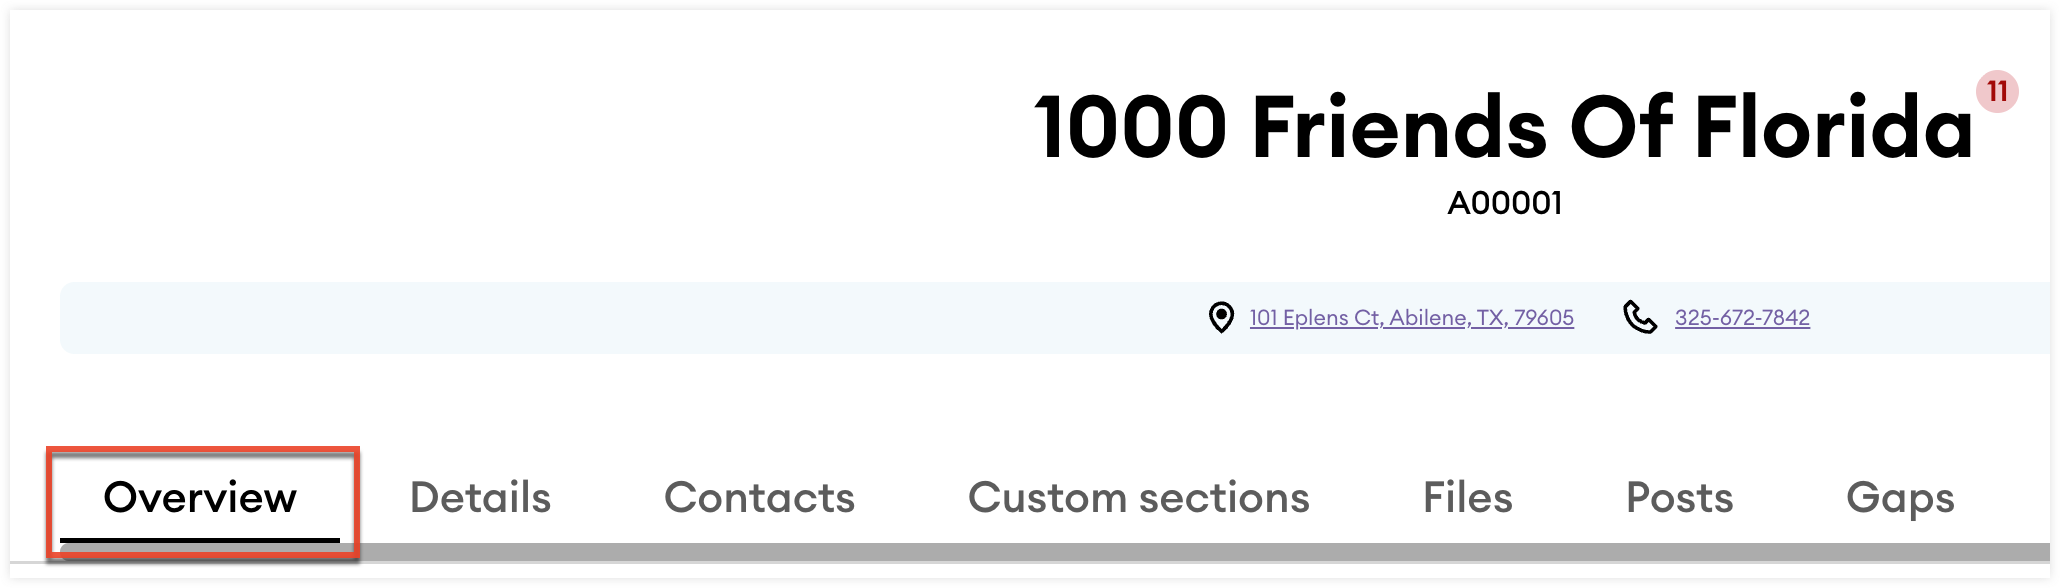
- Scroll to the bottom of the tab and click the View Snapshot Insights button.
Analysis Field Snapshot
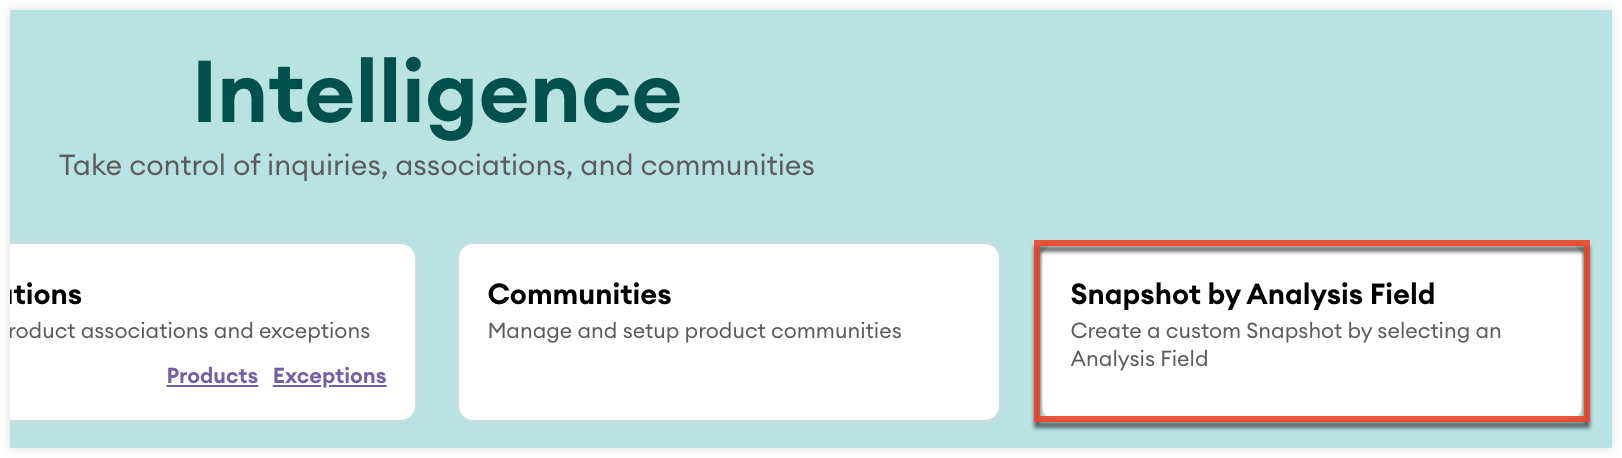
To access an analysis field snapshot:
- Navigate to the Admin page.
- From the Intelligence section, click the Snapshot by Analysis Field card.
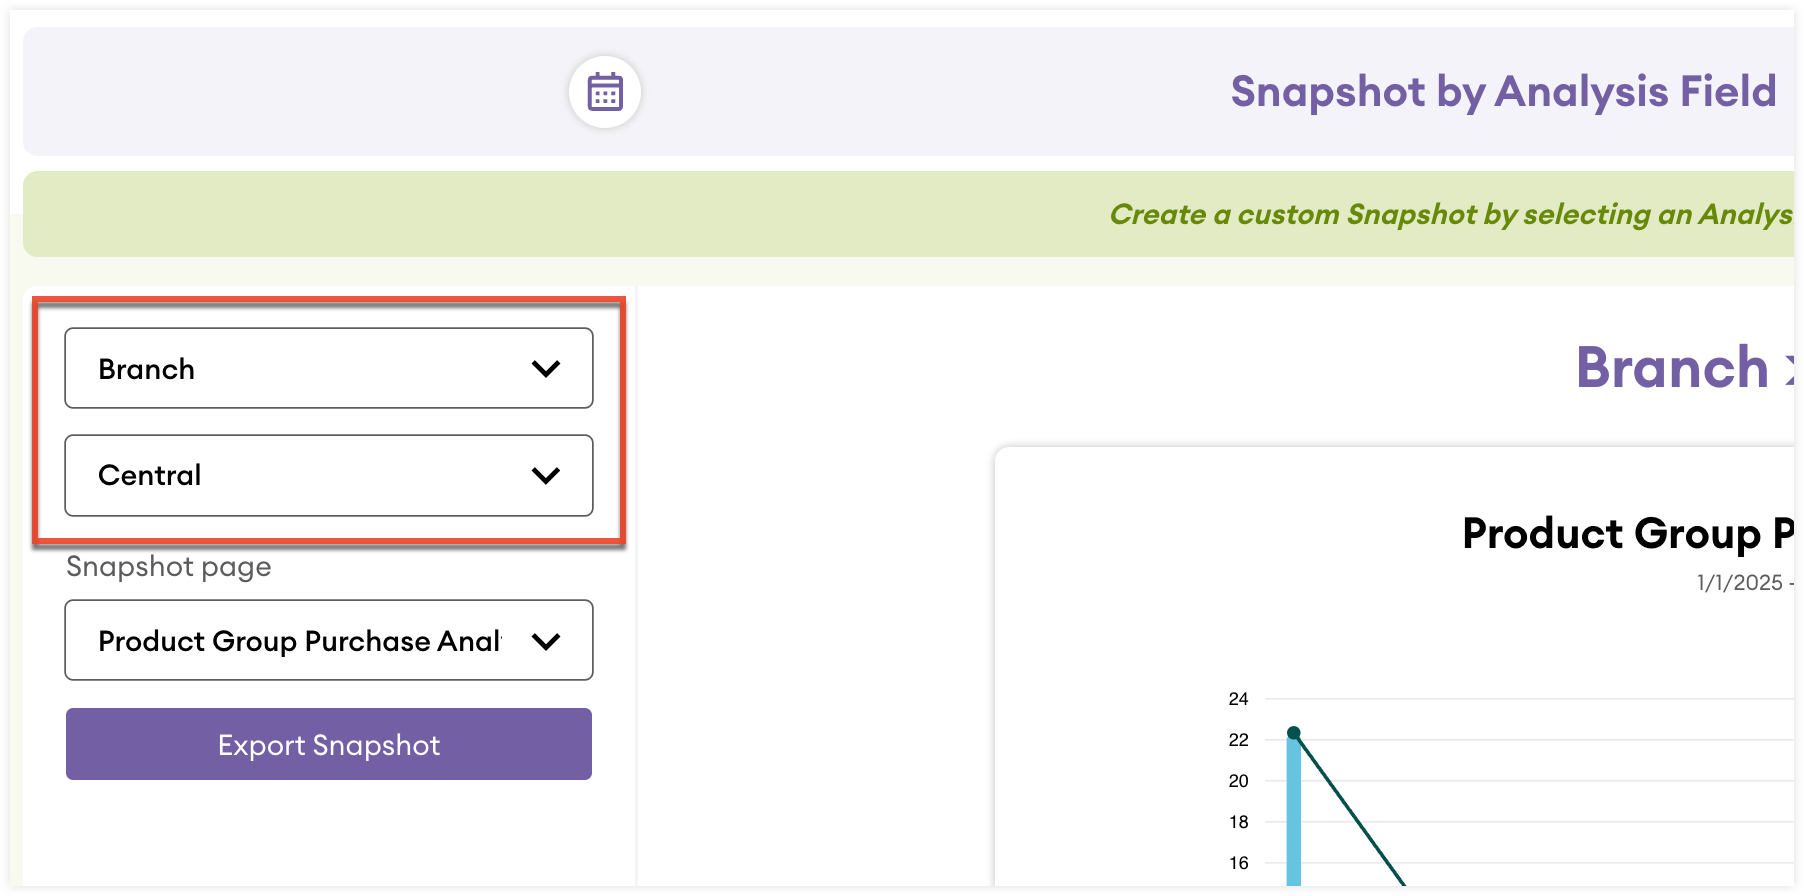
- Use the dropdown fields to select an analysis field and property.
Snapshot Reports
The list below describes the available snapshot reports.
| Name | Description |
| Summary* | Understand KPIs for the selected customer as well as AI/ML potential and missed opportunities. |
| Product Group Purchase Analysis | Understand which product groups the customer is buying and how the quantity purchased and revenue made compares to your average. |
| Top Product Groups by Purchase Value | Understand which product groups purchased by the customer are generating the most revenue. |
| Top Product Groups by Quantity Purchased | Understand which product groups purchased by the customer are sold in the highest quantities. |
| Top Products by Purchase Value | Understand which products purchased by the customer are generating the most revenue. |
| Top Products by Purchase Quantity | Understand which products purchased by the customer is sold in the highest quantities. |
| Products Purchased Frequently | Understand which products are frequently purchased by the customer. |
| Monthly Purchased by Value | Understand the revenue generated by the customer by month. |
| Monthly Purchases by Quantity | Understand the quantity of purchased products by the customer by month. |
| Latest Purchases by Value | Understand the latest products purchased by the customer and the revenue generated. |
| Latest Purchases by Quantity | Understand the latest products purchased by the customer and the quantity sold. |
| Purchases vs Gaps by Purchase Value | Understand how the customer’s generated revenue over time varies for the products they buy most. |
| Purchases vs Gaps by Purchase Quantity | Understand how the customer’s quantity purchased over time varies for the products they buy most. |
| Variance Inquiry by Purchase Value | Understand how the customer’s generated revenue varies across selected periods for each purchased product. |
| Variance Inquiry by Quantity | Understand how the customer’s quantity purchased varies between selected periods for each purchased product. |
| Accounts Analysis | Understand the total revenue generated by the customer. |
| Transaction Analysis | Understand the total number of transactions for the customer. |
*The Summary report is only available for customer snapshots.
Sharing and Saving Reports
Most insight and snapshot reports can be shared with other sales-i users and saved as a dashlet to your dashboards.
Sharing Reports
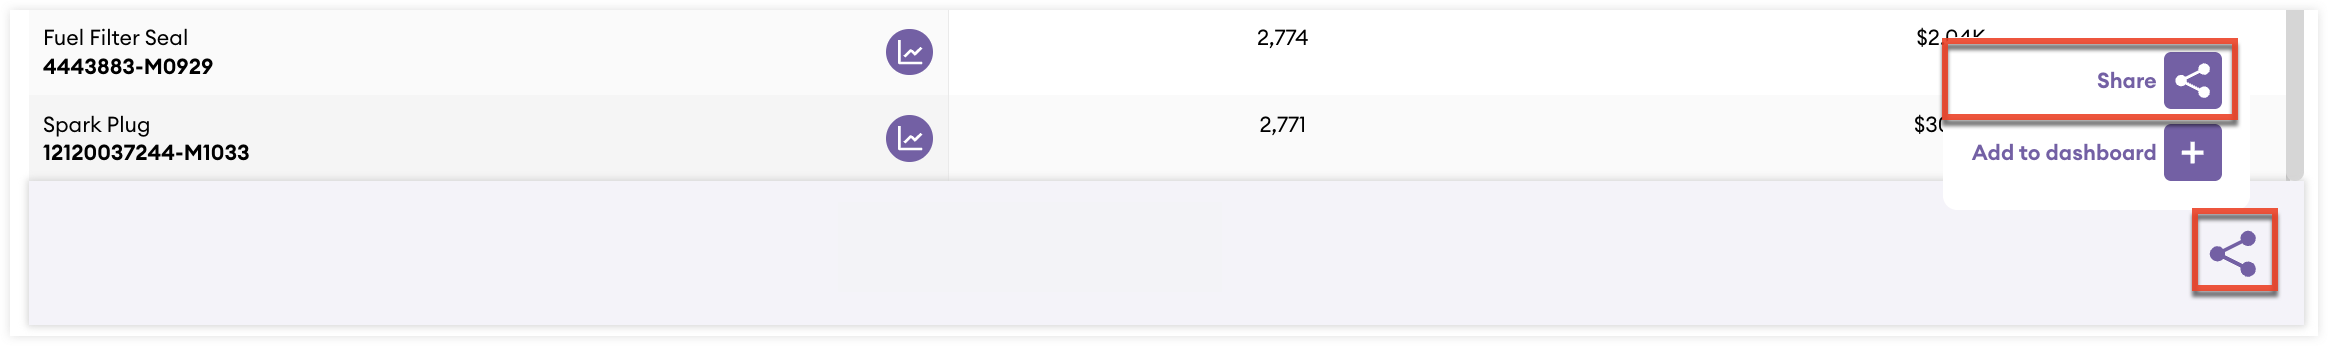
To share a report:
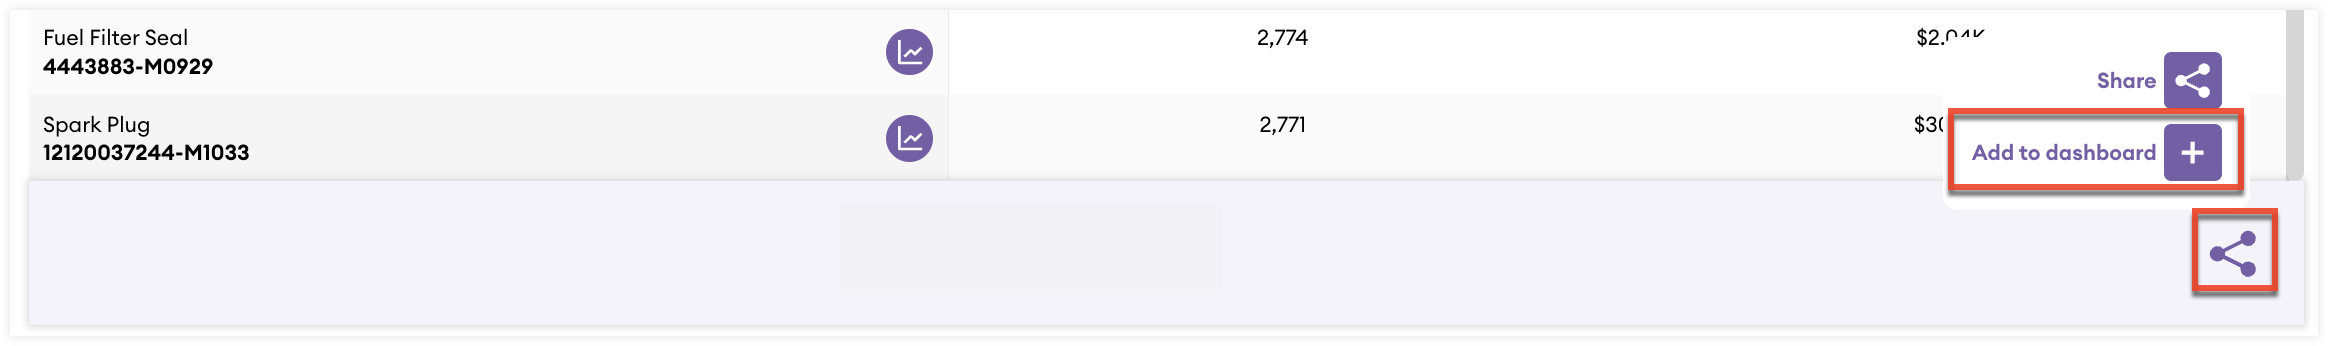
- Click the share icon at the bottom of the report.
- Click "Share".
- Fill in the required fields and select the users you would like to share the report with.
- Click "Share with colleagues". The selected users will receive a notification in sales-i with a link to the report.
Saving Reports
To save a report:
- Click the share icon at the bottom of the report.
- Click "Add to dashboard".
- Fill in the required fields and click "Save" to save the report to your Dashboards.