How to use Targets
Overview
Targets allows you to check sales performance against targets for the month and year. Please note: Targets can only be created by Power Users but can be viewed by all users.
Download a PDF version
Desktop
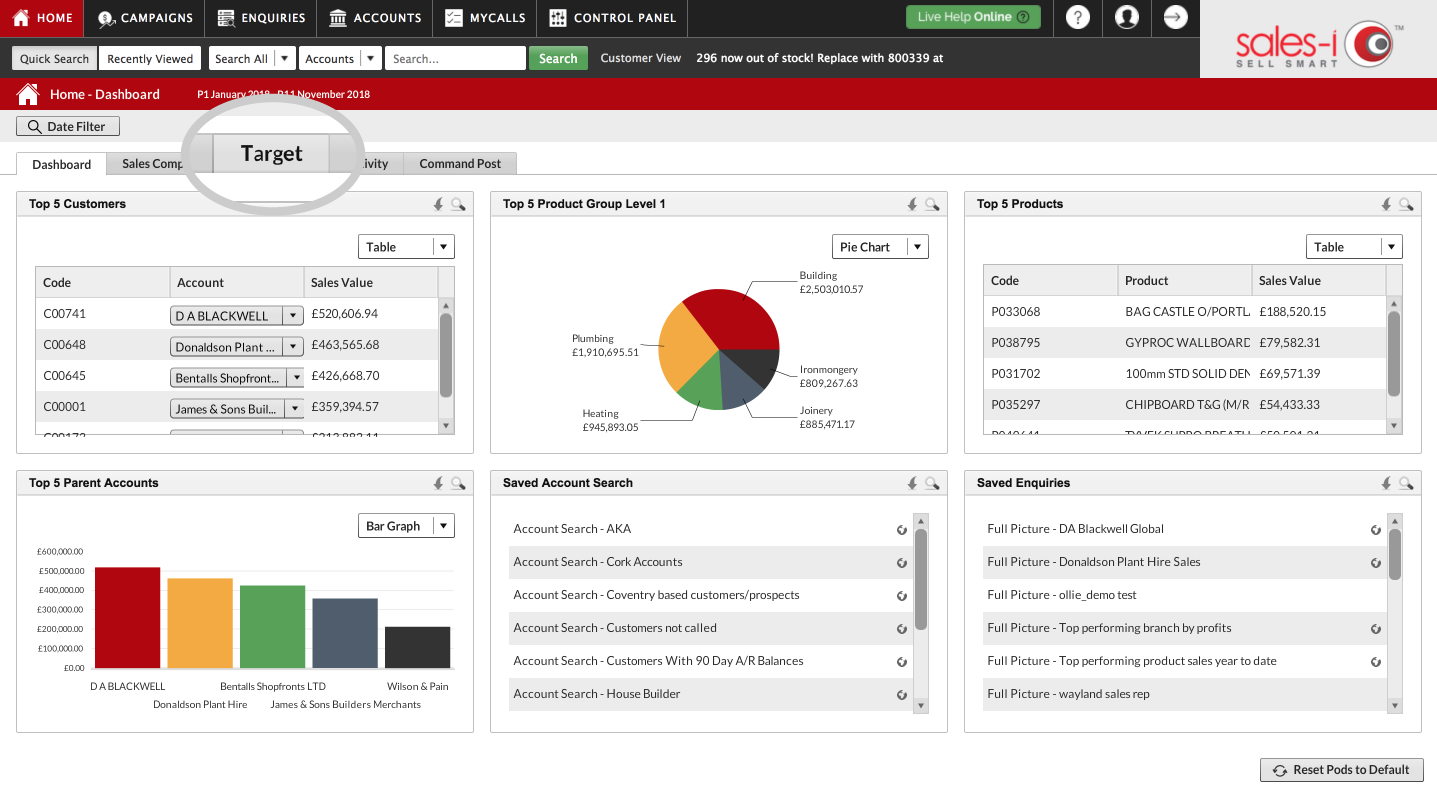
Step 1: Tap Target
From the home screen, click the Target tab.
Step 2: Select your category
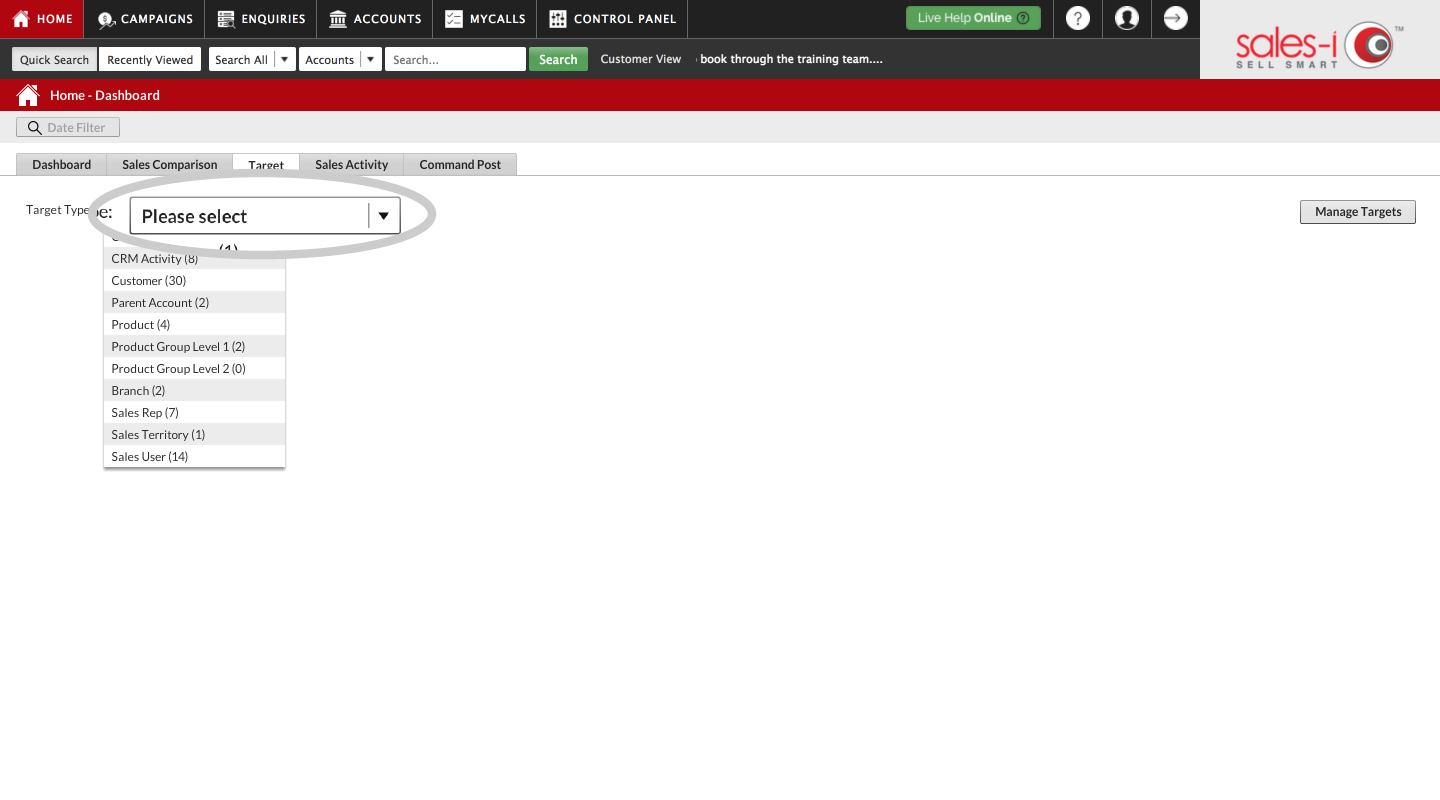
You will now have the option to choose your target category from the drop-down list.
Select the category you want to check your target for.
Step 3: Select your target
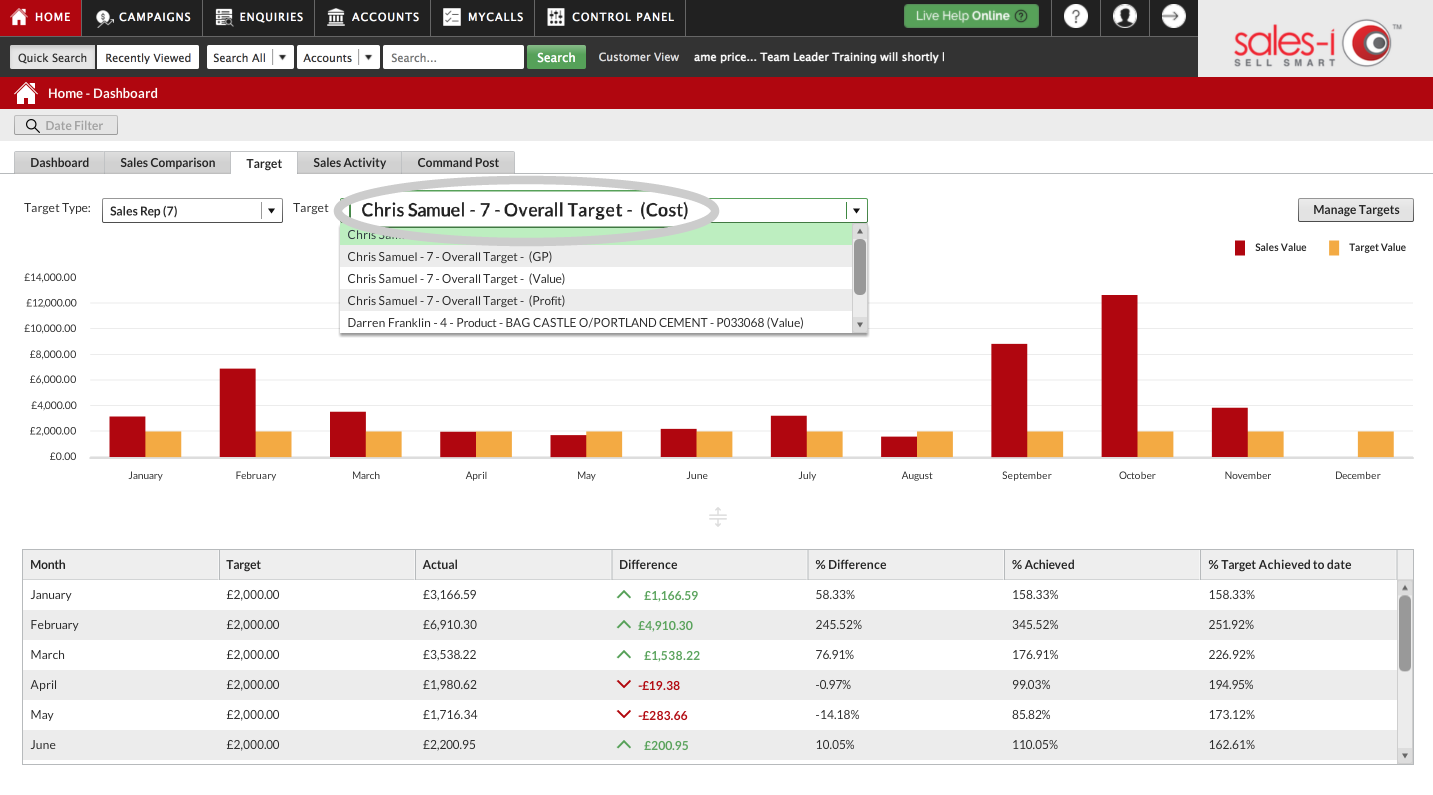
Now, you choose your target from the drop-down list.
Select the target you want to check in further detail.
Step 4: Targets explained
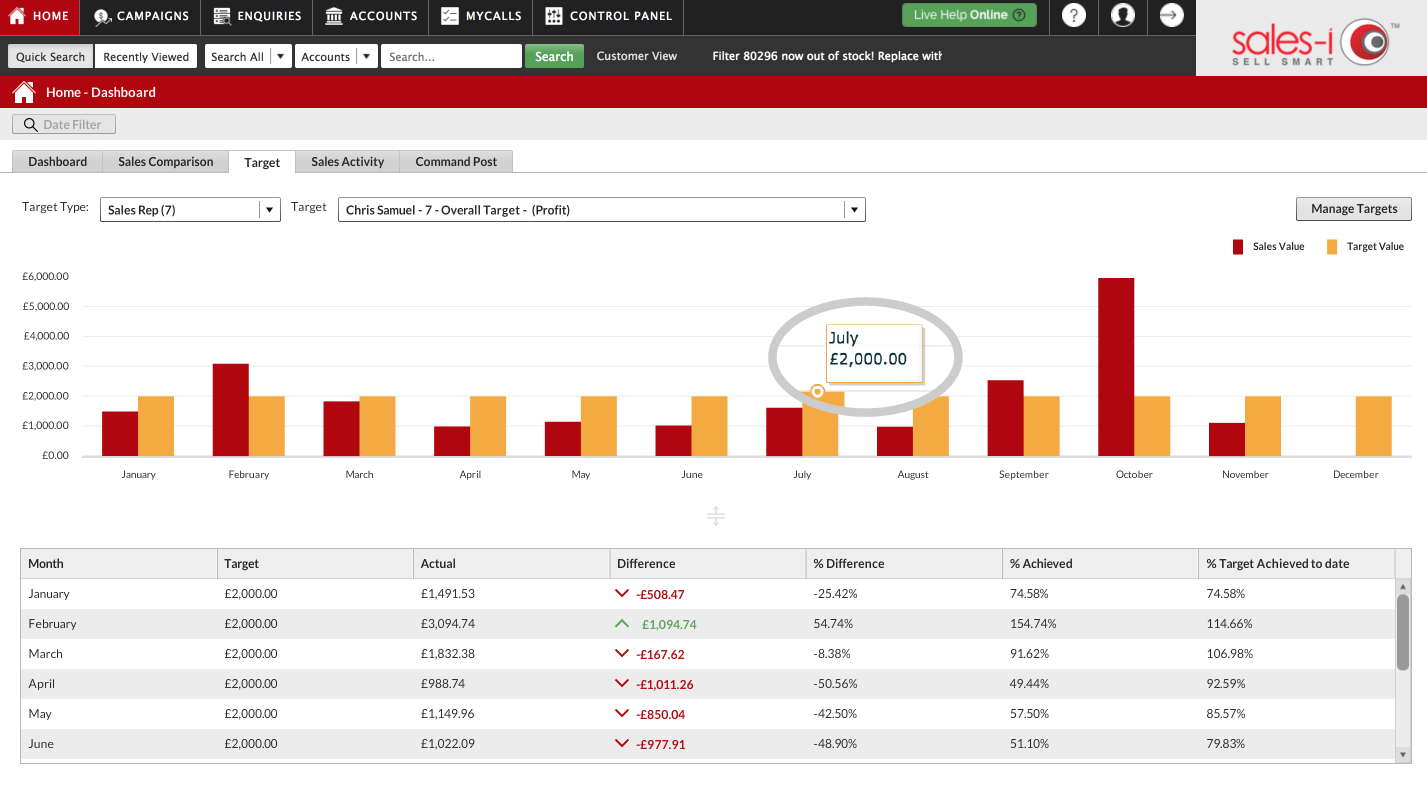
The yellow bar on the bar chart is your target.
The red is your performance against this target for each month.
You can hover your cursor over each bar to view the figures.
Step 5: Touch the info button
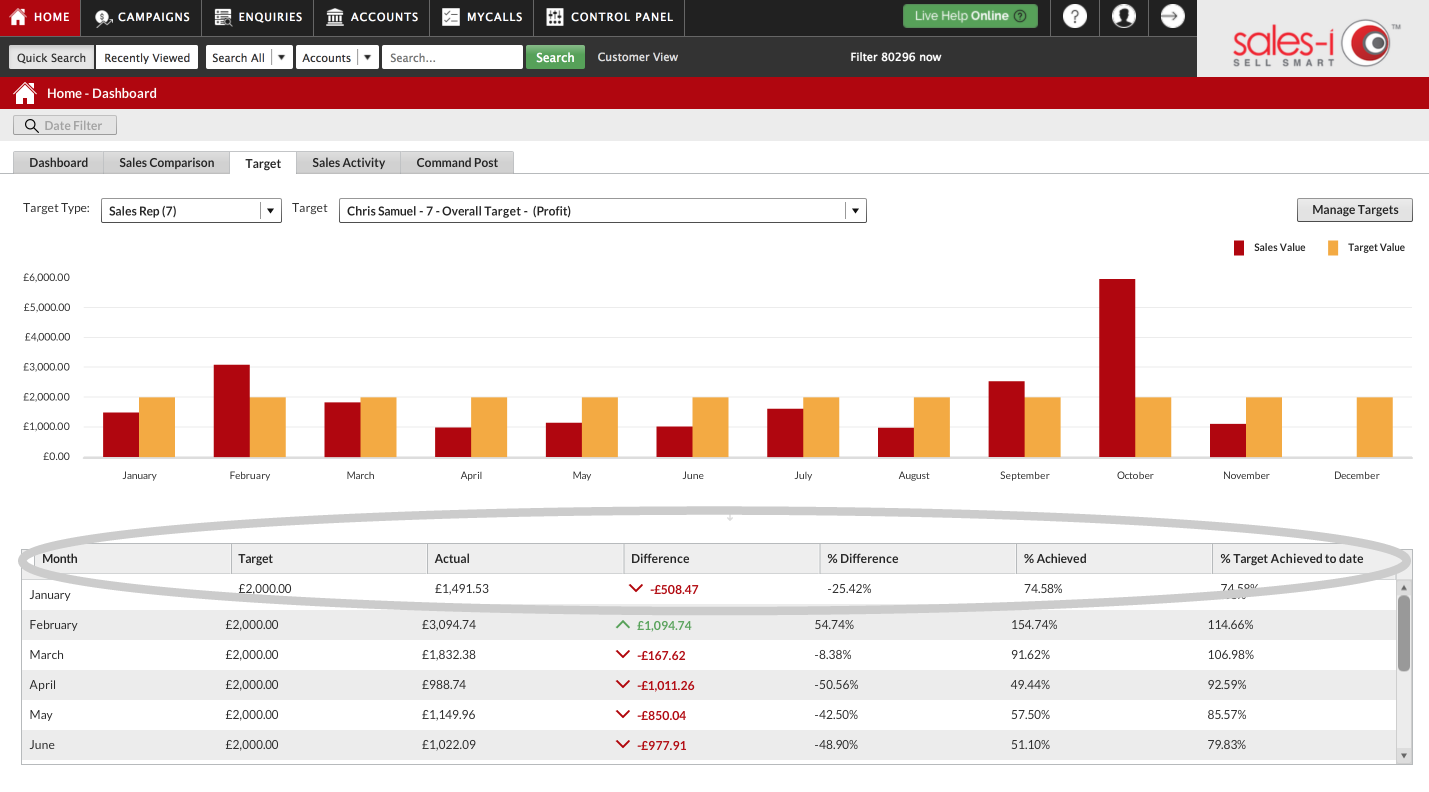
The table below the graph shows your targets with a little more detail:
Month: Month of the year
Target: The target amount for that month
Actual: The actual amount achieved for that month
Difference: The difference between your target and actual amount for that month
% Difference: The difference between your target and actual amount for that month expressed as a percentage
% Achieved: The amount of the target you have achieved for that month expressed as a percentage
% Target Achieved to date: The amount of the target you have achieved for the year to date expressed as a percentage .
Apple
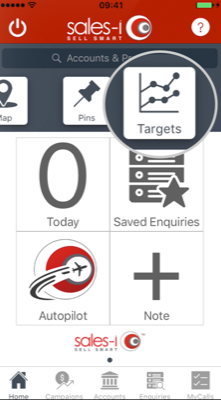
Step 1: Tap Targets
From the home screen, tap Targets.
Step 2: Select your category
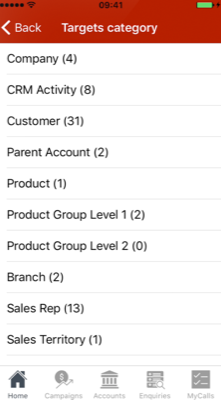
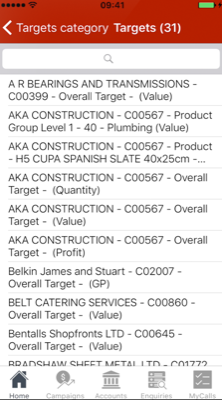
You will now see a set of categories.
Tap on the category you want to check your target for.
Step 3: Select your target
A sub-list of all your targets in this category will be dislayed.
Tap the target you want to look at in further detail.
Step 4: Targets explained
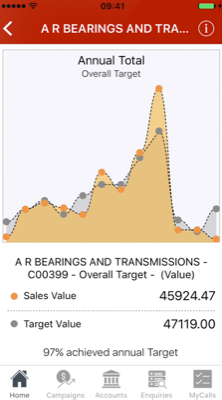
The grey section on the graph is your target, the orange is your performance against this target and each of the dots on the screen represent one month.
The target stated at the bottom of the screen is annual.
Your percentage of the annual target achieved to date is also displayed here.
Step 5: Touch the info button
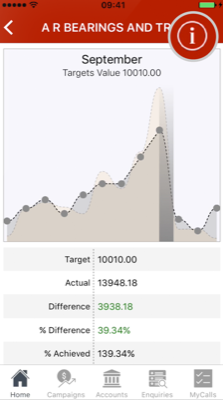
Tap and hold on the graph to check the monthly data, and simply slide across to jump from month to month. When you do this, all of your monthly figures will be displayed at the bottom of the screen.
You will also see an info button in the top right. Tap this.
Step 6: Explanation
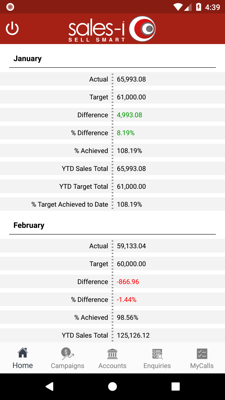
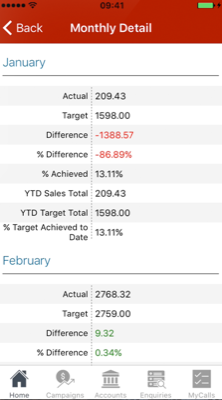
This screen displays the full detail for the target and achieved sales, presenting both monthly figures and YTD totals.
Android
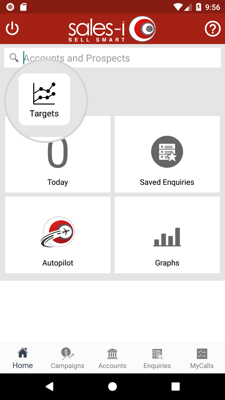
Step 1: Tap Targets
From the home screen, tap Targets.
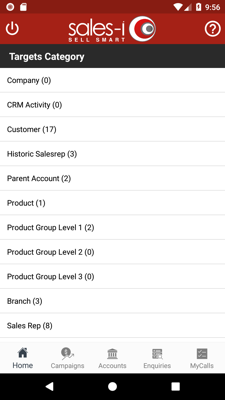
Step 2: Select your category
You will now see a set of categories.
Tap on the category you want to check your target for.
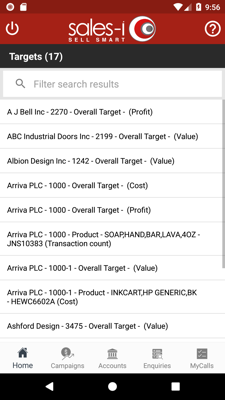
Step 3: Select your target
A sub-list of all your targets in this category will be dislayed.
Tap the target you want to look at in further detail.
Step 4: Targets explained
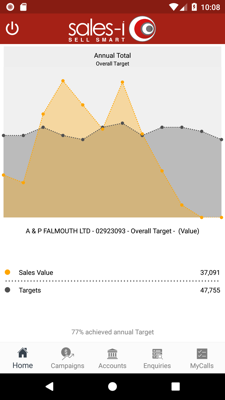
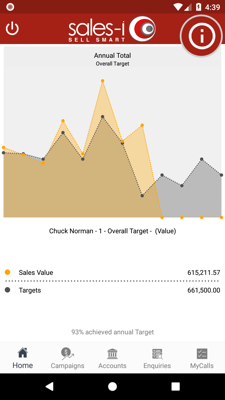
The grey section on the graph is your target, the orange is your performance against this target and each of the dots on the screen represent one month.
The target stated at the bottom of the screen is annual.
Your percentage of the annual target achieved to date is also displayed here.
Step 5: Monthly data
Tap and hold on the graph to check the monthly data, and simply slide across to jump from month to month. When you do this, all of your monthly figures will be displayed at the bottom of the screen.
You will also see an info button in the top right. Tap this.
Step 6: Explanation
This screen displays the full detail for the target and achieved sales, presenting both monthly figures and YTD totals.
