Getting started with Campaigns
Overview
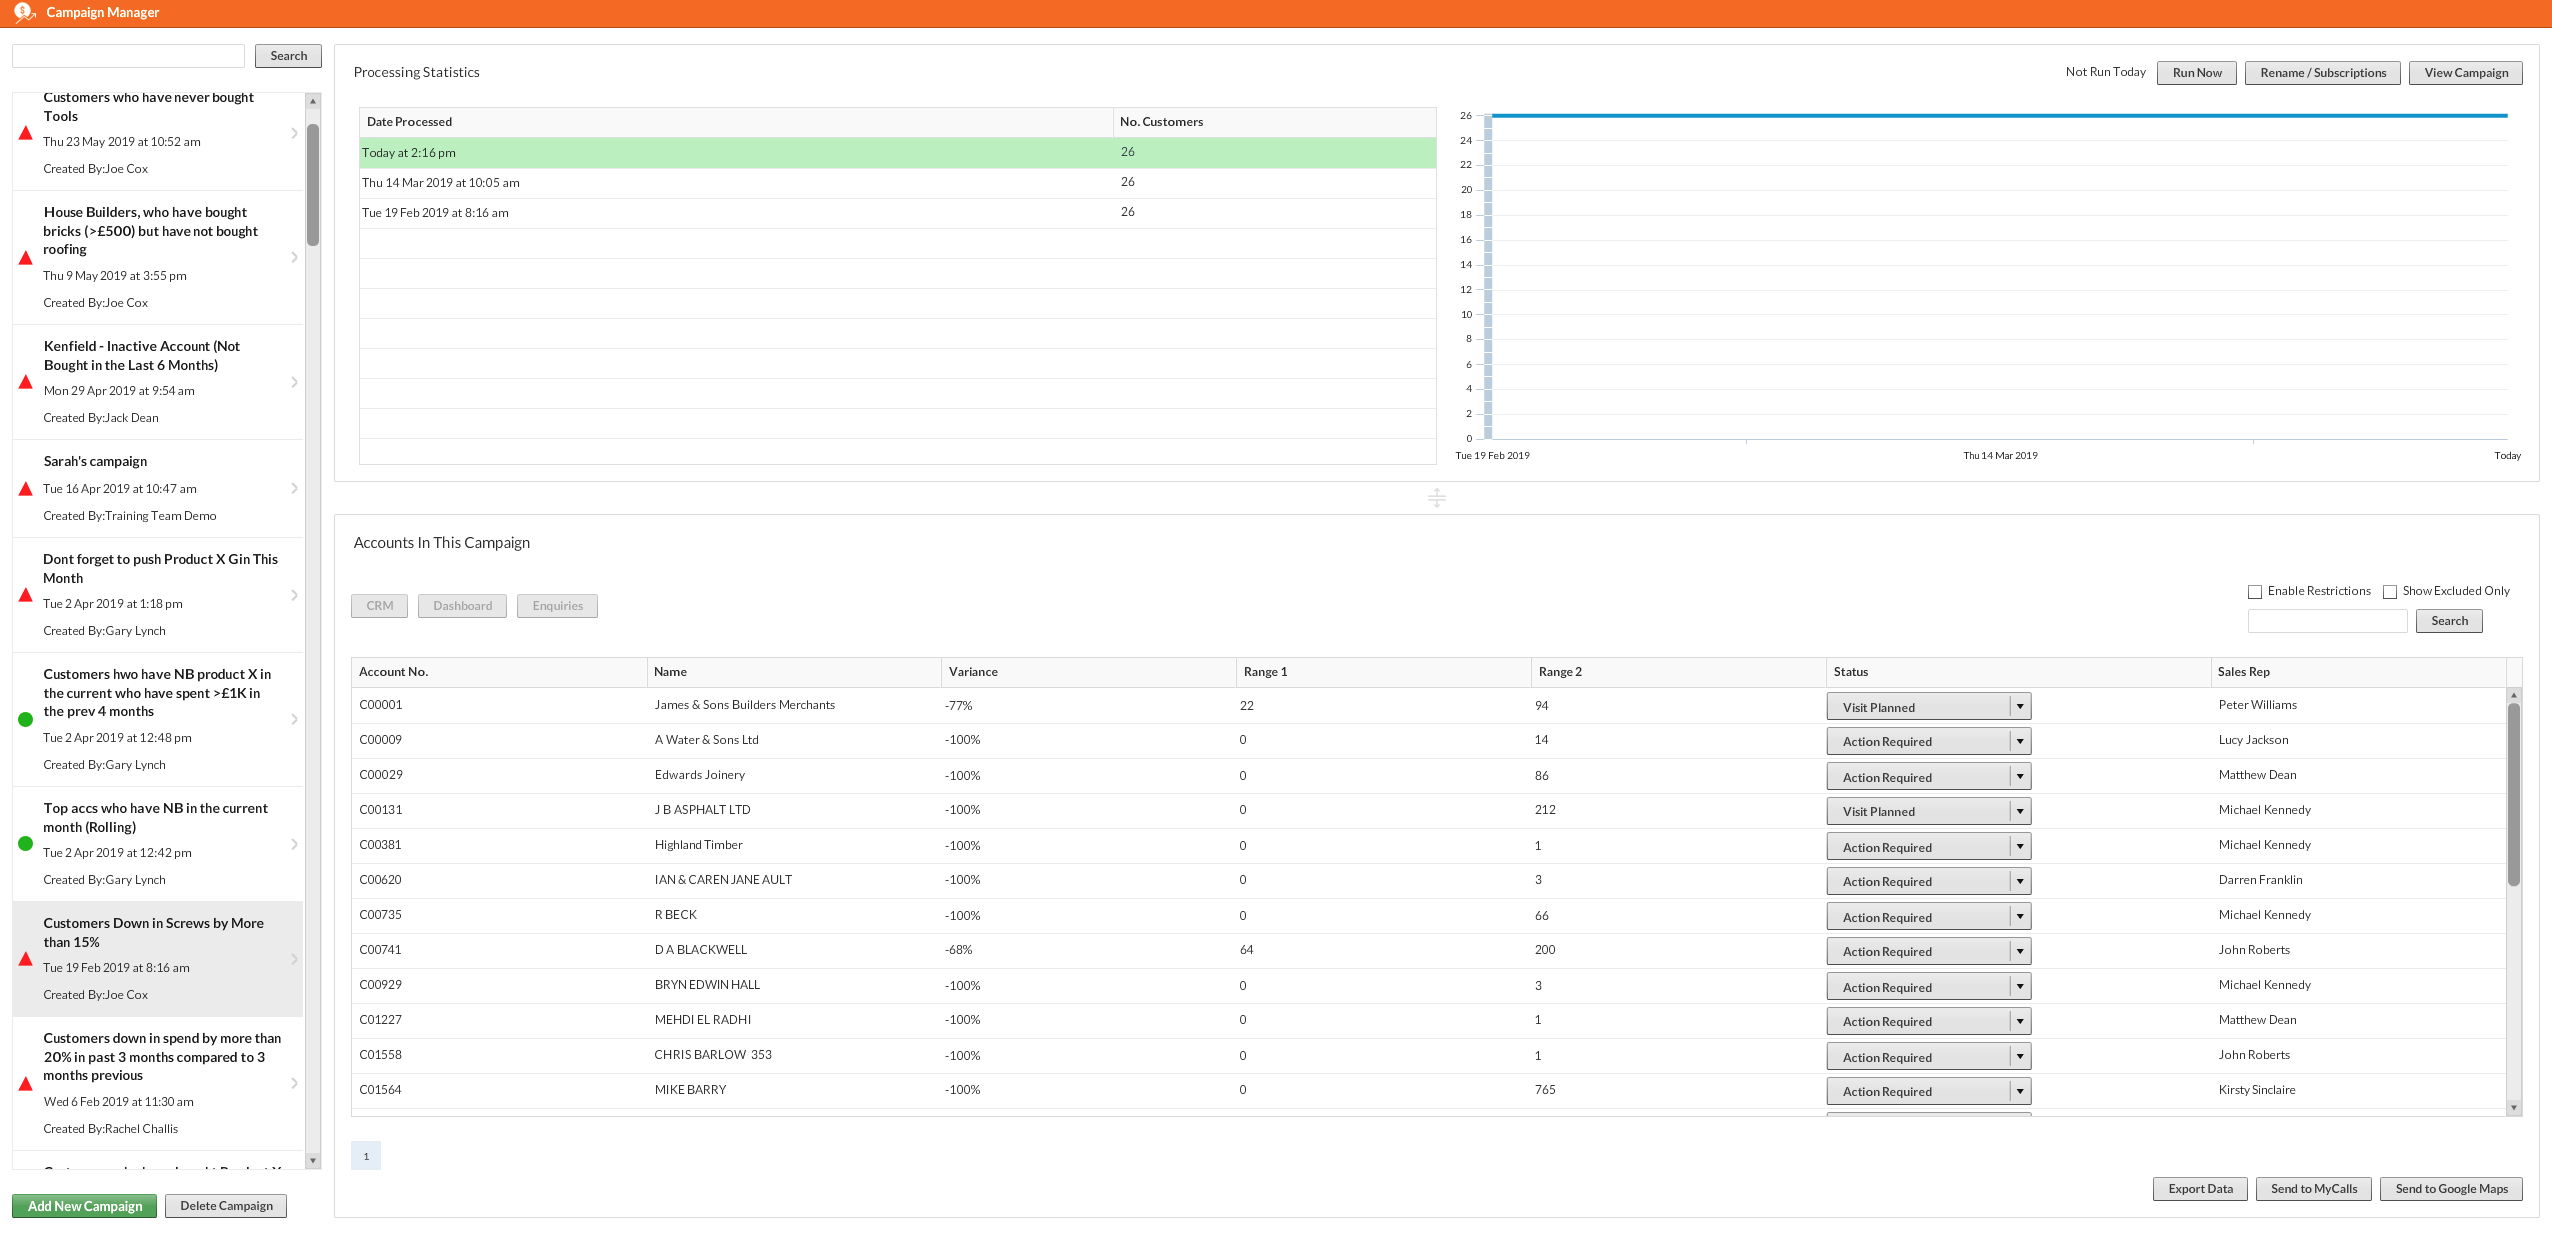
Campaigns can be as creative as you need: From identifying valuable cross-selling opportunities to monitoring any customers that are down in spend in a particular product group in a certain region.
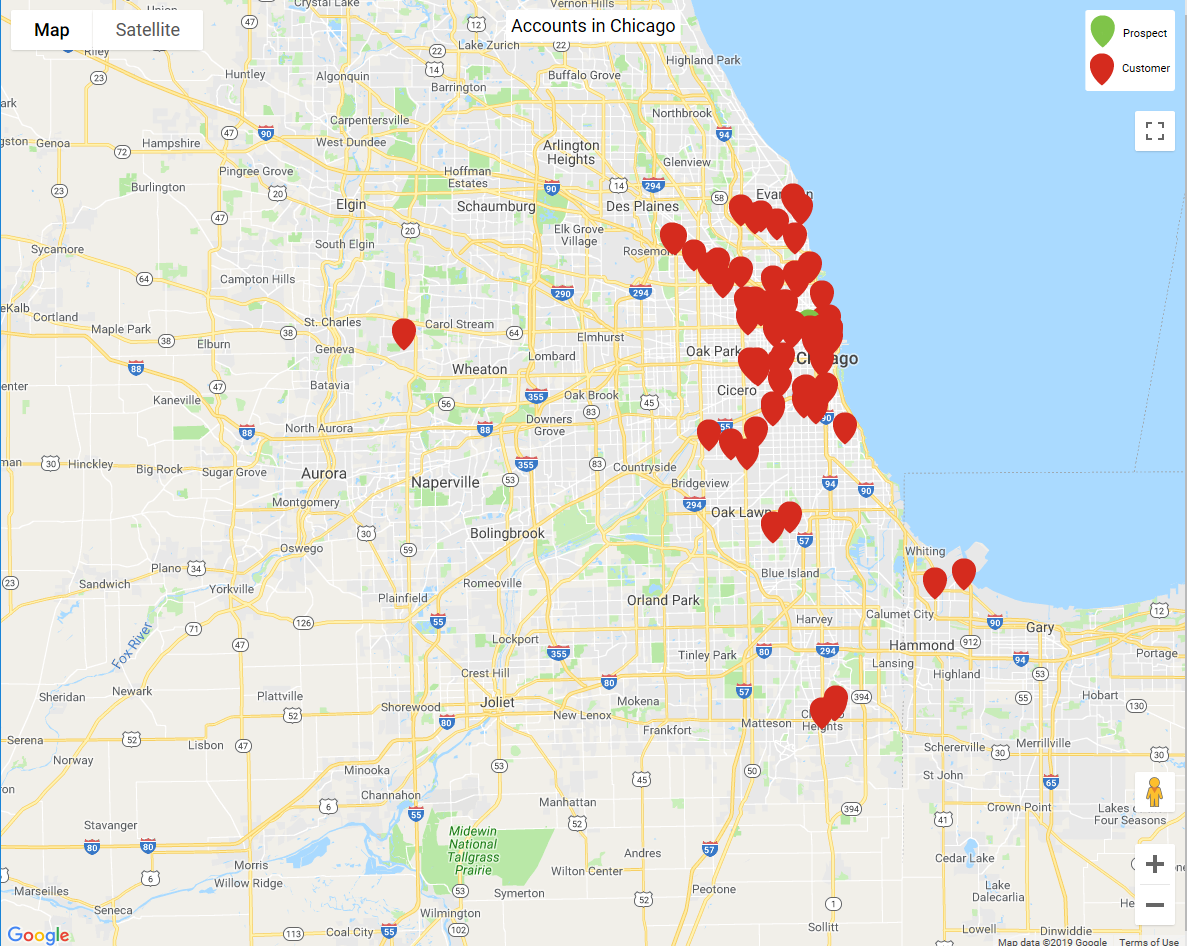
Campaigns can be plotted to Google Maps for smarter route planning, exported into MyCalls to ensure calls are personal and assigned to reps to ensure prompt follow-up once an account breaks the tripwires you set.
This how to guide will explain what each different Campaign filter does and gives you some examples on how they can be used successfully.

Full Picture
The Full Picture campaign filter is useful for sorting customers by any measurement type e.g. profit, cost, value. You can use the Full Picture campaign filter to see, for instance, every customer who has spent $5,000 or less so far this year.
Saved Search
Saved Search allows you to search for customer account data from the record card. If you want your campaign to start out with a narrower scope of accounts to search through for your campaign you would use this filter. For instance, if you wanted the campaign to only look at customer accounts in a specific region, this would be the filter for you.
Want to discover how to view all of your customer accounts and plot them to a map? Click here.

Top Accounts
The Top Accounts filter can be used to quickly display your top spending accounts by value. You can specify the date range and how many accounts you want to restrict the campaign to. You could use this filter if you wanted to see the 25 biggest spenders from the last complete months or the year to date.
Want to discover who your top 50 customers are? Click here
Not Bought
The Not Bought filter helps you identify which customers have not bought certain products, product groups or anything at all in a time frame of your choosing. While simple in concept, this campaign filter is very useful because of its ability to identify gaps in sales and opportunities to grow sales. This is best used in conjunction with a full picture or variance filter.
Want to discover which customers have not bought anything from you? Click here
Variance
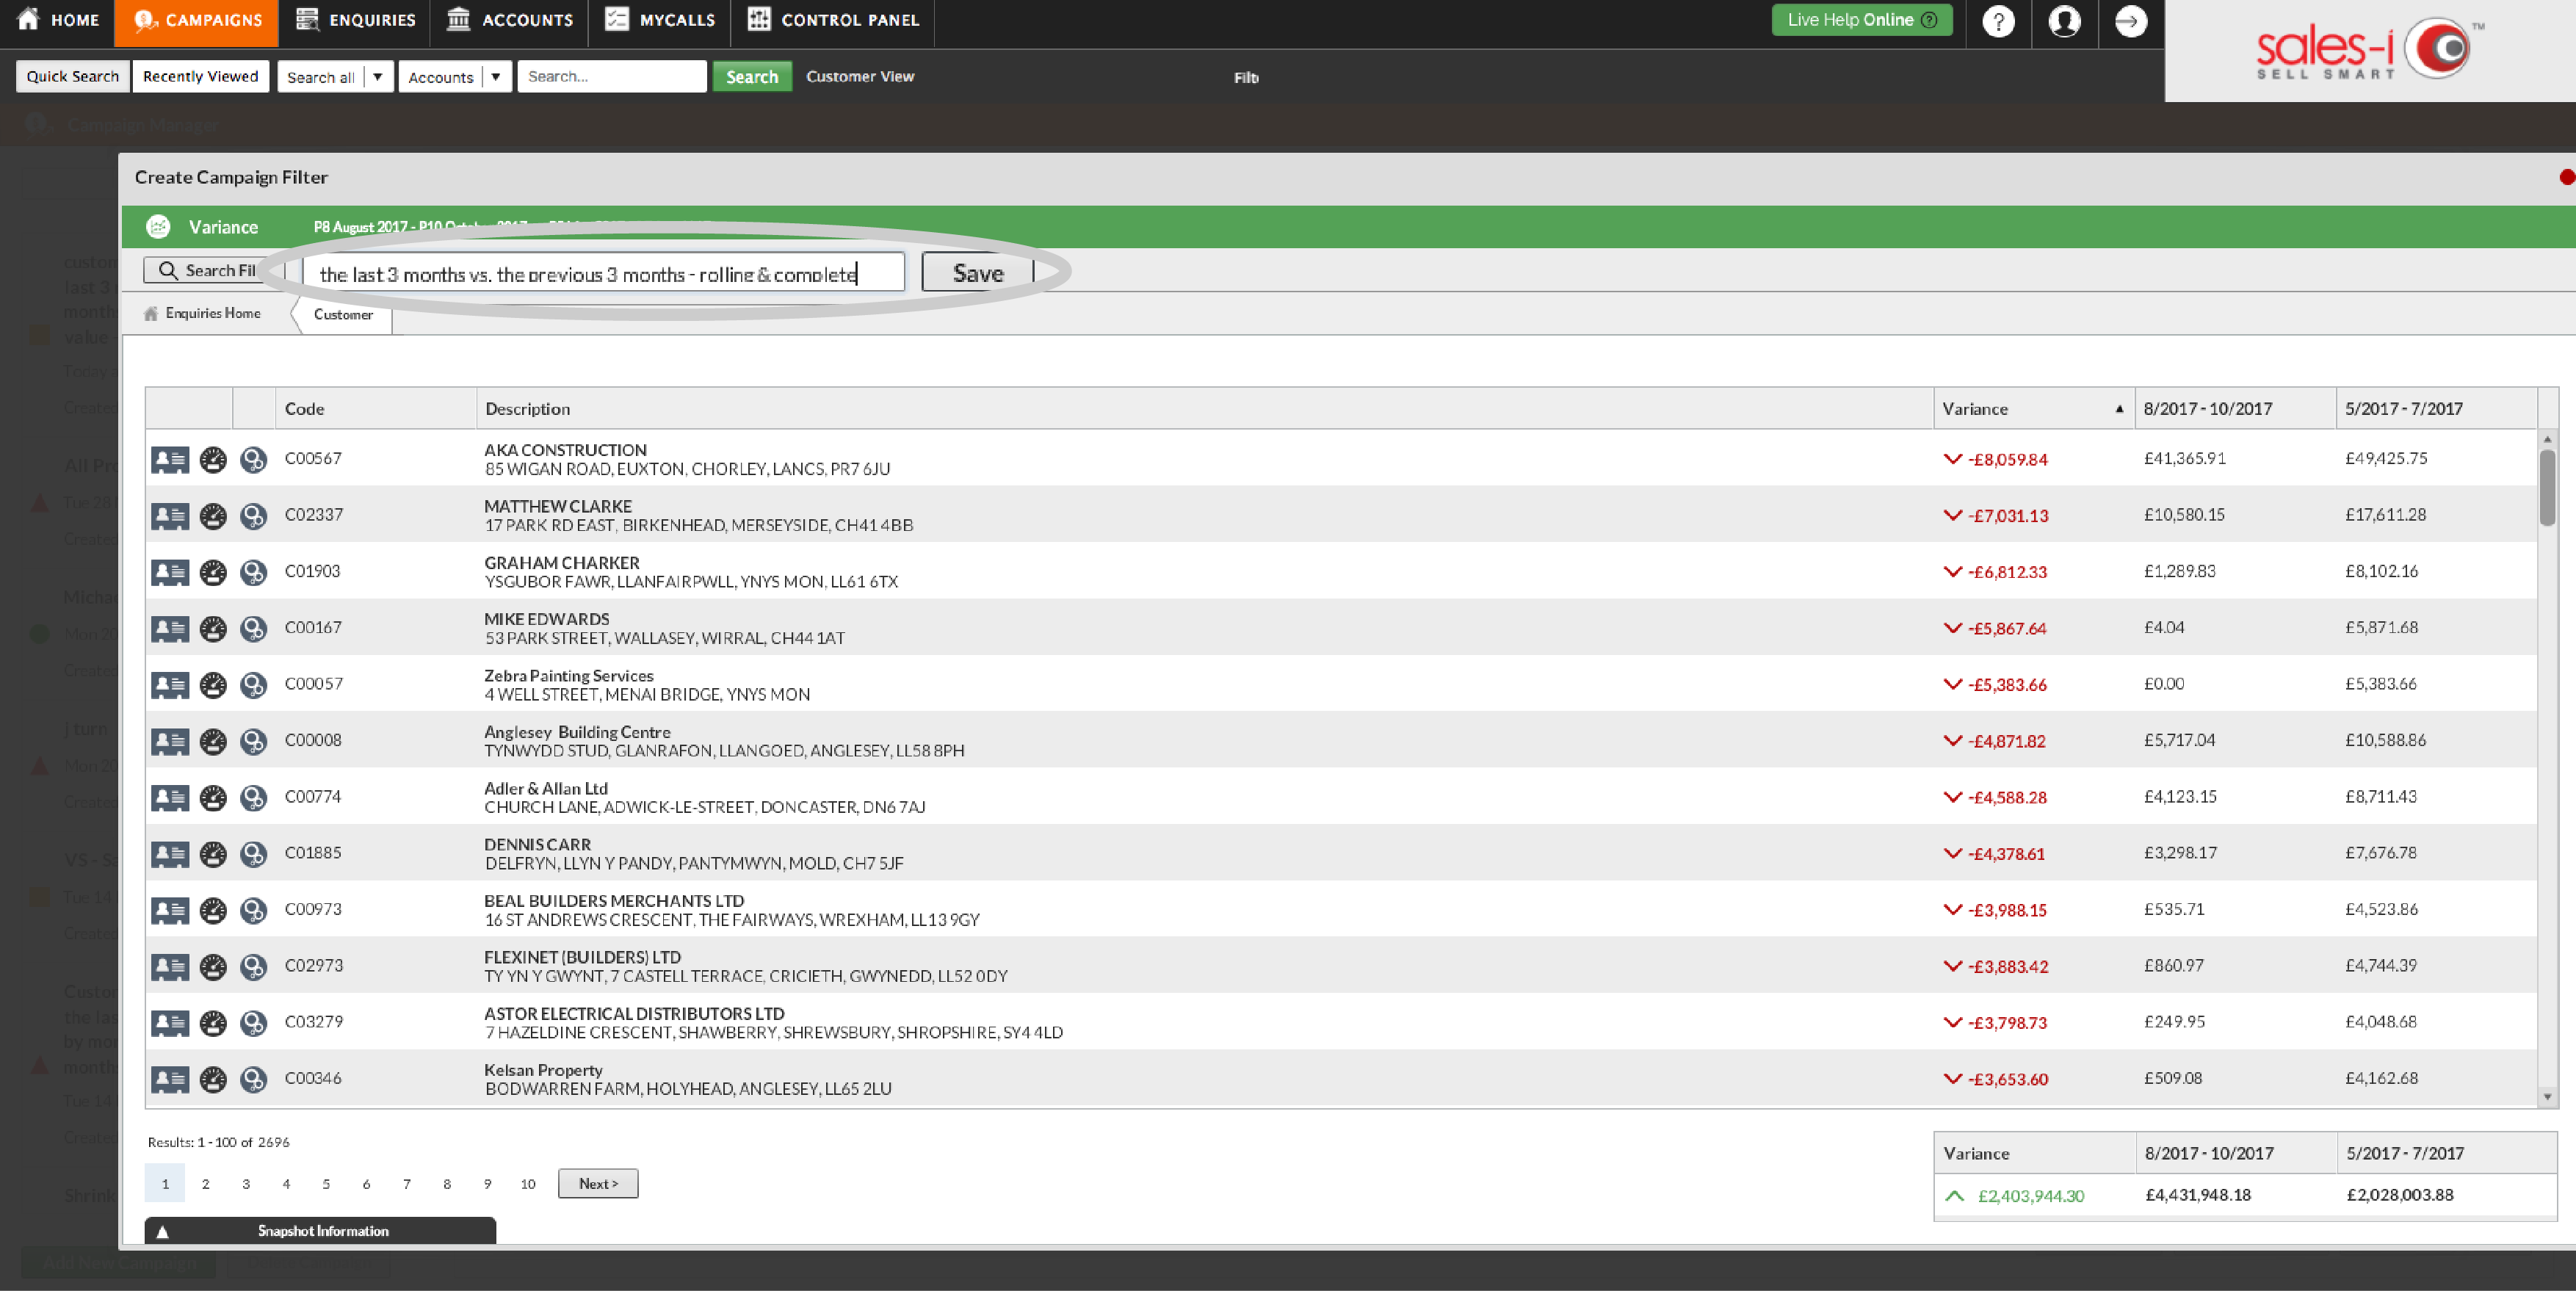
Variance is great when you need to compare sales values over two specified date ranges or for identifying areas where sales value is shrinking or growing. For example: You could use a Variance filter to see which of your customers spent less this January compared to last January.
Want to discover which customers have reduced their spend with you? Click here

Spend Mix
The Spend Mix filter compares sales values in a customer's account to the market average. For example, you can use this to see customer accounts that are spending less than the market average by 10% or more or to identify customers that have 20% more transactions than the market average. This can be used for all measurement types e.g. profit, cost, value, quantity etc.
Not Hitting Targets
This campaign filter can be used to quickly identify your customer accounts that have not hit their sales targets for a specific date range. If you wanted to see what customer accounts have not reached their target sales yet this year to date, or to see which customer accounts are under their targets by 15% or more in a previous month, you would use this campaign filter.
Combining Filters
To create even more specific campaigns, you can use up to three filters per campaign.
Please Note: You can only use each filter type once, and the campaign will only output accounts that fulfil all the criteria from all of the filters.
For instance: If you wanted to quickly list which of your accounts spent more than $5,000 so far this year, but did not buy a specific product you’d like to up-sell, you would use a Full Picture filter to see who has spent more than $5,000 year to date and use a Not Bought filter to find who hasn’t bought that item.
Want to find out which of your top 300 customers have not bought anything so far this month? Click here.
