Reporting
Overview
Sugar Market includes several standard reports and supports the creation of custom advanced reports for analyzing your marketing activities. This page explains the reporting options that are available.
Accessing Reports
To access Reports:
- In the navigation bar, click the Analytics module.

- Select either "Standard Reports" or "Custom Reports".
Standard Report Descriptions
Standard Reports are commonly used, pre-defined reports that are included with Sugar Market. While you can filter most of these reports (e.g., choosing the emails or landing pages to include), the report logic is already established, which makes it quick and easy for you to access the data you need. The following are the standard reports available:
| Report Category | Report Name | Description |
| Accounts | Account Score | Accounts with a score mapped to the account field "Score" and a score value greater than 100. |
| Total Accounts | Count of all accounts in Sugar Market. | |
| Account Owners | Accounts assigned to each user. | |
| Contacts | Blank Emails | Number of contact and lead records in the system that do not have an email address. |
| Contact Owners | Contacts assigned to each user. | |
| Contacts by Deliverability Status Detail | List of contacts by delivery status that can be filtered by bounce status. | |
| Contacts Warehouse | Every marketing touch any Sugar Market user has had with a contact within a given time frame. Choose to include all contacts in the database or all contacts owned by a designated user. This report provides insight into how a salesperson's contacts are interacting with your content and your most active accounts. | |
| Database Size for Subscription | Number of leads and contacts in Sugar Market counted towards your subscription. This count does not include unsubscribes, blank emails, or bounced emails. | |
| Entire Database |
Number of contact and lead records in the system. |
|
| Total Contacts | Number of all contacts in Sugar Market. | |
| Total Leads | Number of all leads in Market. | |
| Undeliverables | Number of records with email addresses to which Sugar Market is not able to deliver. This may be due to various bounce reasons. | |
| Unsubscribes | Number of unsubscribed records in Sugar Market. | |
| Email Campaigns | Campaign Statistics |
Summary table of a campaign's statistics, a graphical view of the statistics, and user details for opens, clicks, and unsubscribes. |
| Campaign Summary | Summary report of multiple campaigns including bounces, unsubscribes, and percentages. | |
| Delivery Status | Quick report of all emails that were delivered, bounced, or both within a specified time range. You can only query back to March 12, 2011 as the earliest date. This report can provide insight into how your deliverability has changed over time, including contributing factors. | |
| Email Bounce Detail |
Number of email bounces by bounce code. |
|
| Email Campaign Engagement |
Engagement detail for email campaigns, including the contacts who opened the email and the links clicked. |
|
| Email Link Click Details |
Click through activity for tracked links in emails, including the email name, the links that were clicked, and the total number of clicks and unique clicks. Bot clicks are automatically filtered out of this report. |
|
| Opened Emails |
List of recipients who opened an email. |
|
| Soft Bounces |
Soft email bounces that are tracked in Sugar Market, which can be filtered based on the soft bounce codes. |
|
| Subscriber List | Displays who is on a suppression list, which lists they are on, and more. Filter this report by suppression list and/or date range. | |
| Unopened Emails per Campaign | List of recipients who did not open an email. | |
| Events | Event Attendees | Details from a hosted webinar, including attendees, account name, and contact owner. |
| Event Follow-Up | List of contacts that are marked for follow-up from an event. | |
| Event Registrations Detail | People who registered for an event with account, contact info, and account manager. | |
| Event Summary | Number of people registered for an event versus the number of invitations sent. | |
| Folders | Folder Owner | Library folders with their owner information. This report shows which owner roles you should match. |
| Landing Pages | Landing Page Details | Details from the legacy landing pages that were completed, including individual details of each time the form was completed. You can export or print this report. |
| Landing Page Results | Combine multiple legacy landing pages together into a cumulative report breaking up the information by Landing Page. You can export or print this report. | |
| Landing Page Summary | Summary of start and complete times for multiple legacy landing pages. | |
| Page Analytics | Form Completes |
Form submission details, including each individual field's value. |
| Summary | High-level metrics for each of your pages (visits, conversions, conversion rate). | |
| Visits Details |
Detailed information on each individual visit to your pages, grouped by page and individual hit. |
|
| Scoring Reports | Detailed Scoring Report | Scores by scoring profile for a selected time period. |
| Subscriptions | Email Campaign Activity Summary | Standard campaign summary statistics for all email campaigns during a specified time period, presented in a tabular format that facilitates comparison of many campaigns at once. |
| Lead Capture Form Performance | Number of times each active landing page is completed during each day in a specified time frame. | |
| Track Changes | Track Changes | An aggregate review of which contacts and leads have had changes to their fields in Sugar Market during a specified amount of time. For records with multiple changes, each change is recorded as an individual line item in the report. By default, all changes that occurred over the past 30 days are displayed, but you can adjust the history to see any time frame. |
| Web Analytics | Daily Web Activity Current Month | Usage stats and holistic metrics of your company's marketing success, including unique web hits, number of pages visited, number of alerts sent, and top keywords. |
| Organizations | Names of organizations associated with visits to your website. | |
| Organizations by Keyword | Names of organizations associated with visits to your website and the keywords used. | |
| Top Entry Page | Number of visitors and the top web pages where they entered the website. | |
| Top Entry Page with Referrer | Number of visitors and the top web pages (with referrer) where they entered the website. | |
| Top Exit Page | Number of visitors and the top web pages where they exited the website. | |
| Top Keywords | Number of visitors and the top keywords used to visit the website. | |
| Top Keywords by Referrer | Number of visitors, the top keywords, and referrer used to visit the website. |
Running Standard Reports
To run a standard report:
- In the navigation bar, click the Analytics module.
- Click "Standard Reports".
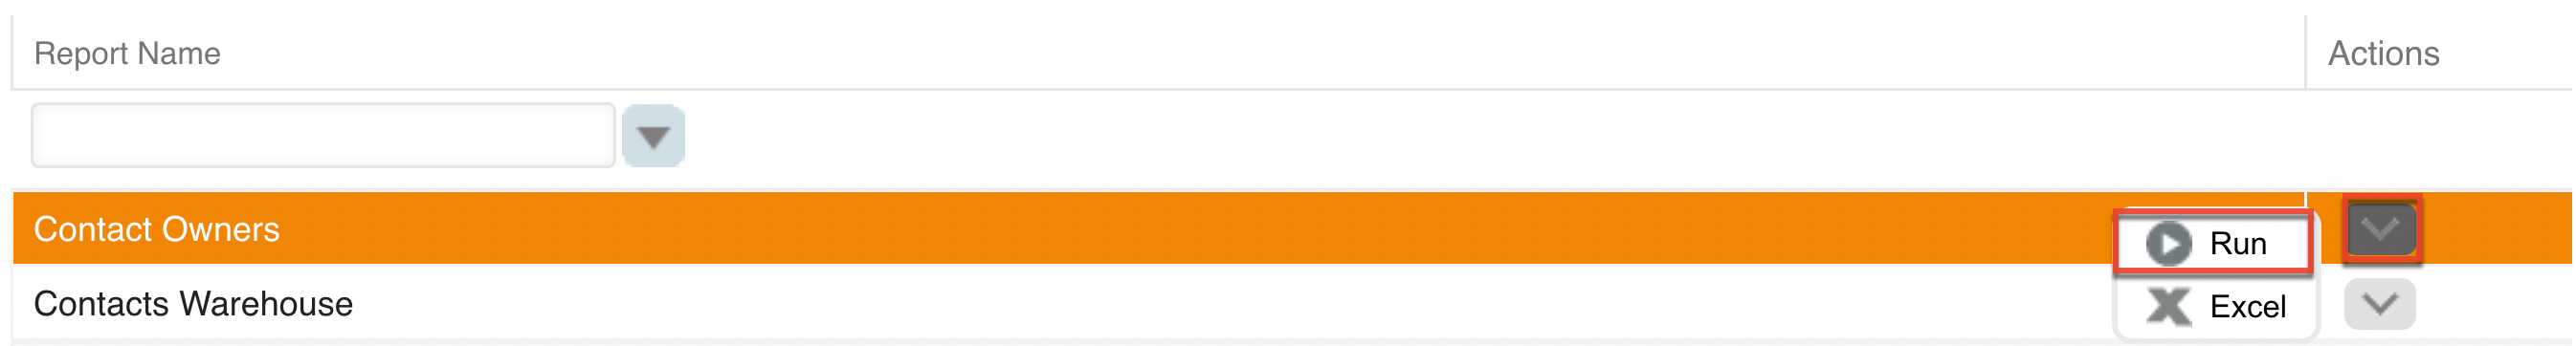
- Select a report category and name.
- With the report name highlighted, select Run from the Actions menu. A pop-up window displays either with results or prompting for additional criteria.
Creating Custom Reports
Build custom reports with Sugar Market's Advanced Report Builder.
Note: Save reports often during creation to preserve all changes.
- In the navigation bar, click the Analytics module.
- Click "Custom Reports".
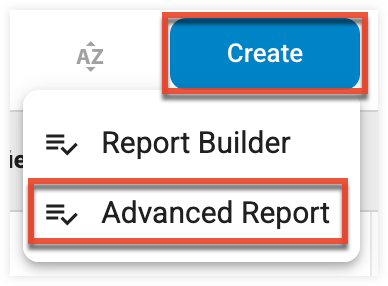
- On the Reports page, click the Create button in the toolbar.
- Click "Advanced Report" from the dropdown menu.
- Enter the following information, and then click the Save button:
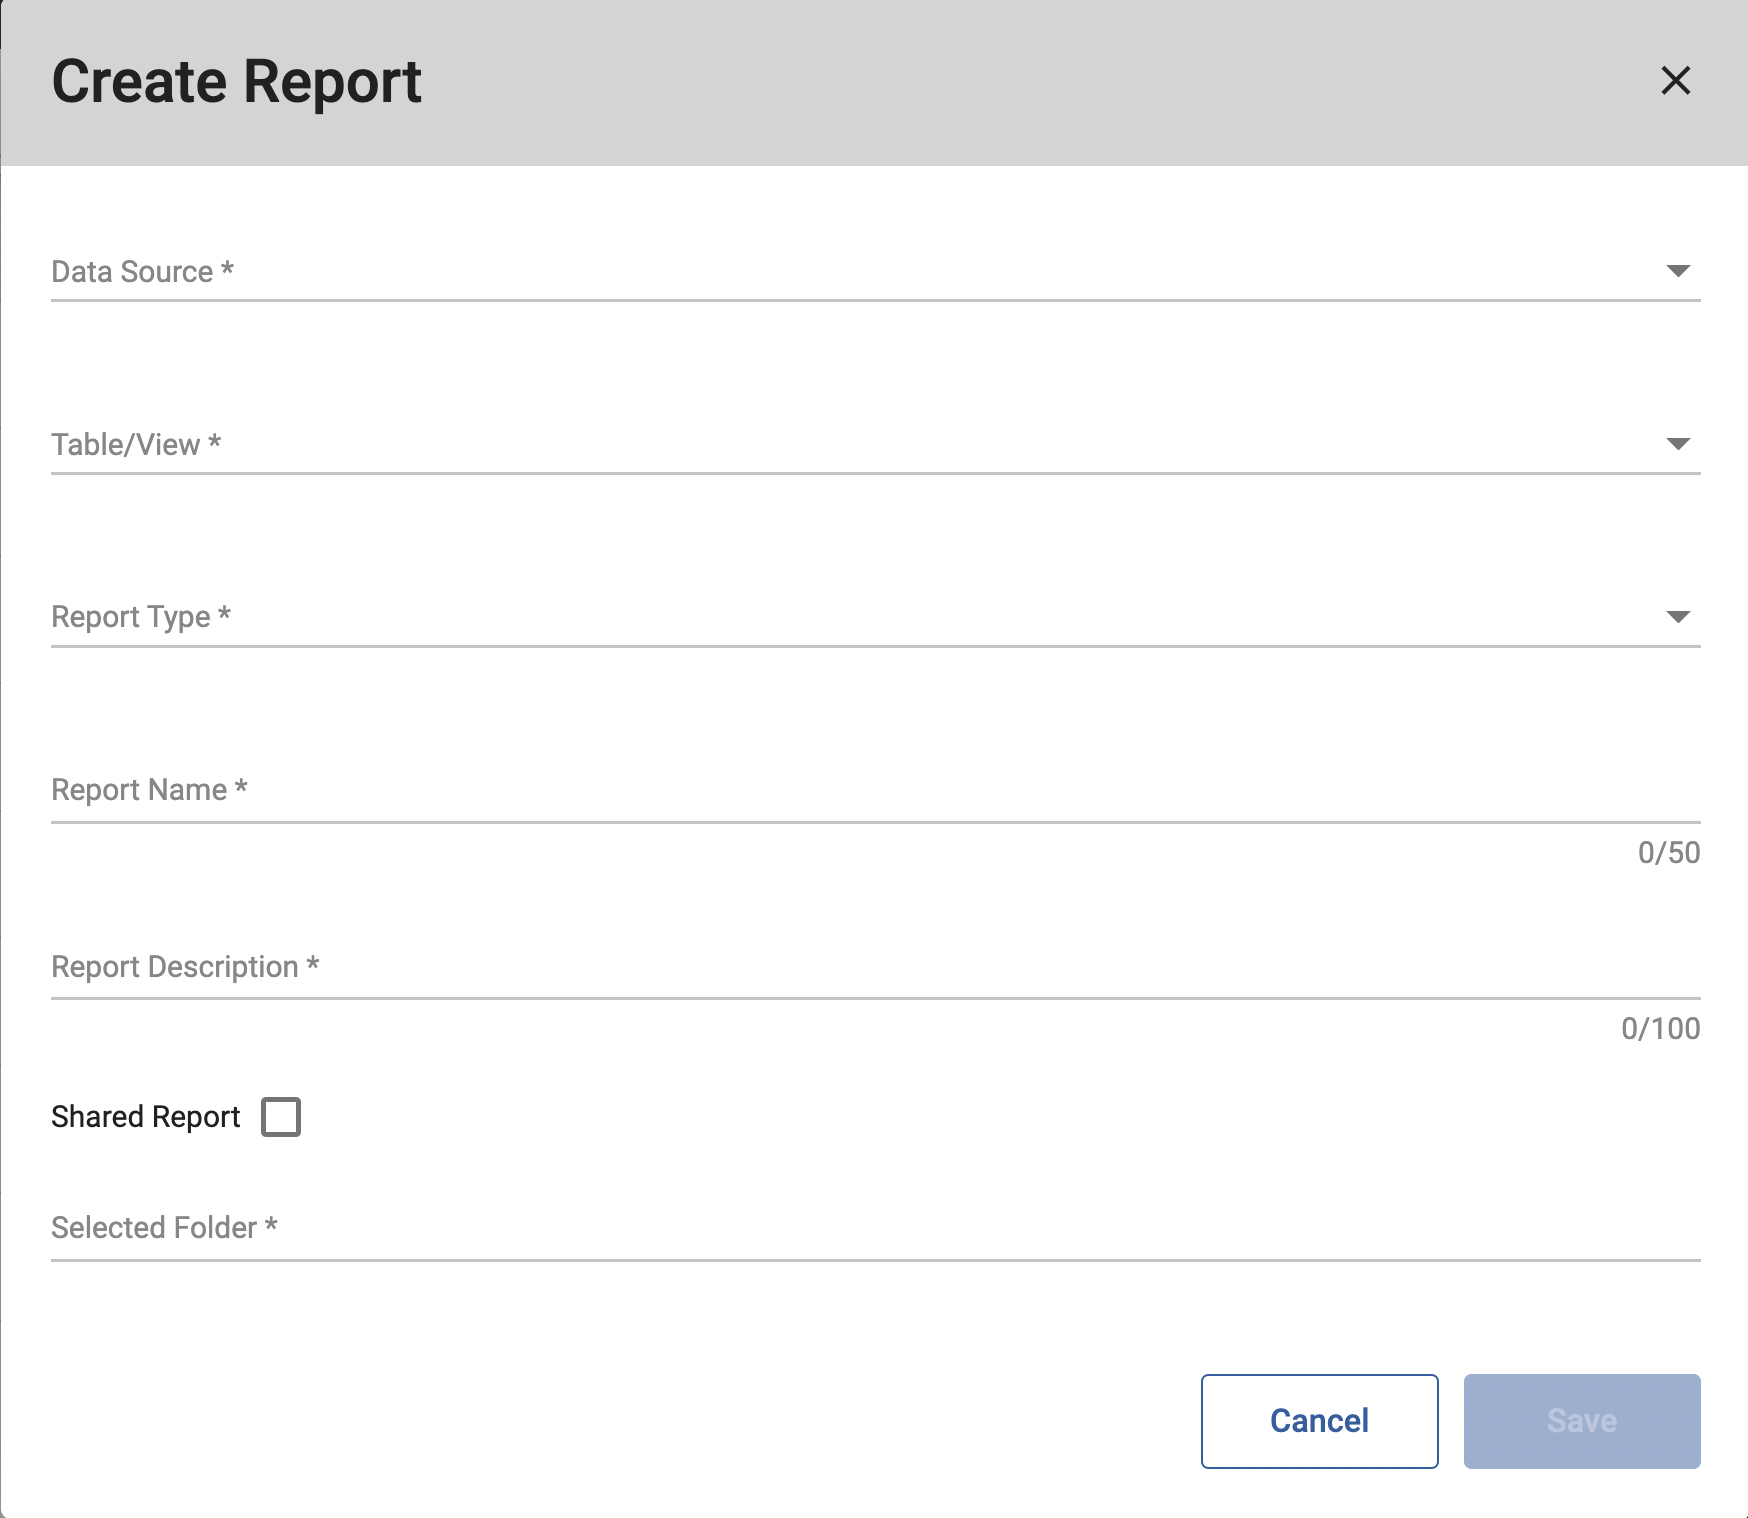
- Data Source: This defines the tables that contain the desired information.
- Custom Views: These are more advanced views that have been created from the Views module.
Note: Custom views include deleted records. - Single Table: A specific single table that is not joined to any other tables. This will allow you to report on information for that specific table only.
- Standard Views: Pre-built tables joining multiple single tables together. For example, joining the Contact table to the Account table allows you to report on the information of both tables. Most reports will utilize standard views. Please refer to the Custom Report Standard Views page for descriptions of each view.
- Custom Views: These are more advanced views that have been created from the Views module.
- Table/View: For custom views, this is the custom view name. For single tables, this is the table name. For standard views, it is a concatenation of the table names that have been joined (e.g., viewAccountContactCampaign is the Account, Contact, and Campaign tables joined).
- Report Type: Tabular or Summary. Tabular is the most useful option since it displays all details of the report and provides an option to export to Microsoft Excel.
- Report Name: Set a name for your report.
- Report Description: Set a description for your report.
- Shared Report: Enabling this option makes the report visible to other users.
- Selected Folder: Select which folder your report will be saved in.
- Data Source: This defines the tables that contain the desired information.
- On the Report Editor page, identify the report parameters described below, and then click the Save Report button at the bottom of the Report Details section.
Report Parameters
Report parameters are divided into the following tabs at the bottom of the Report Details page.
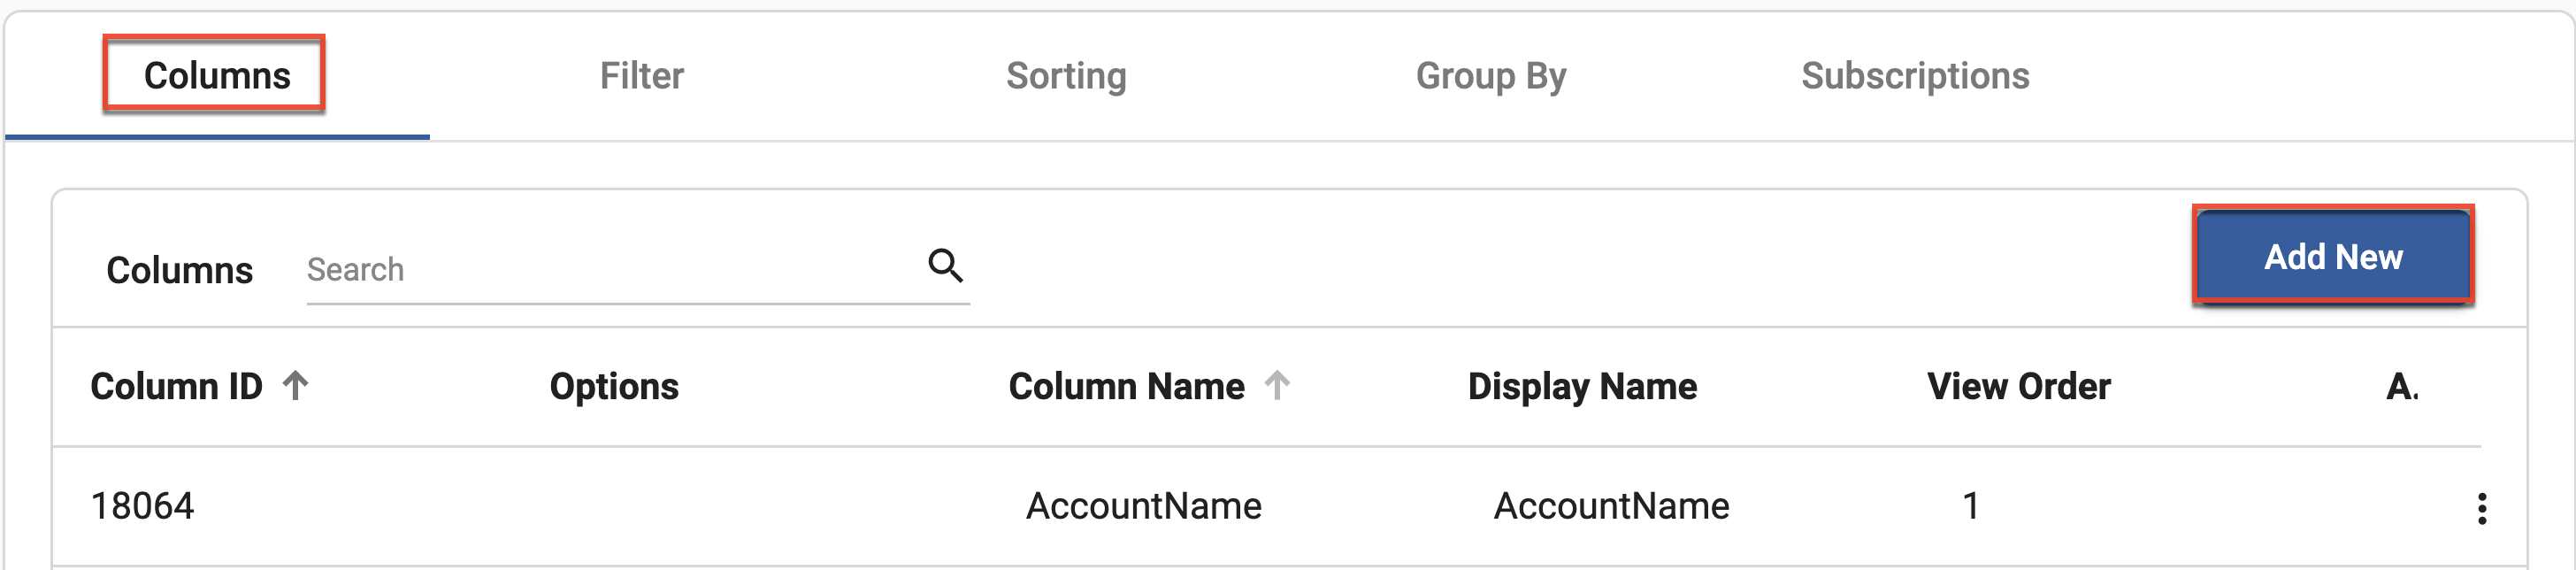
Columns
To identify the fields to be used as report columns:
- On the Columns tab, click the Add New button.
- Select the fields to be displayed as columns in your report by moving them from the Available Columns list to the Selected Columns list. Use the following guidelines when selecting fields:
- Select individual fields by clicking the right-facing arrow with the field selected.
- Select multiple fields by holding the keyboard CTRL key while making selections.
- Add all fields by clicking the double right-facing arrow.
- To remove fields from the Available Columns list, select the field and then click the left-facing arrow, or click the double left-facing arrow to remove all fields.
- You can also use the Search Column field to filter for a specific field.
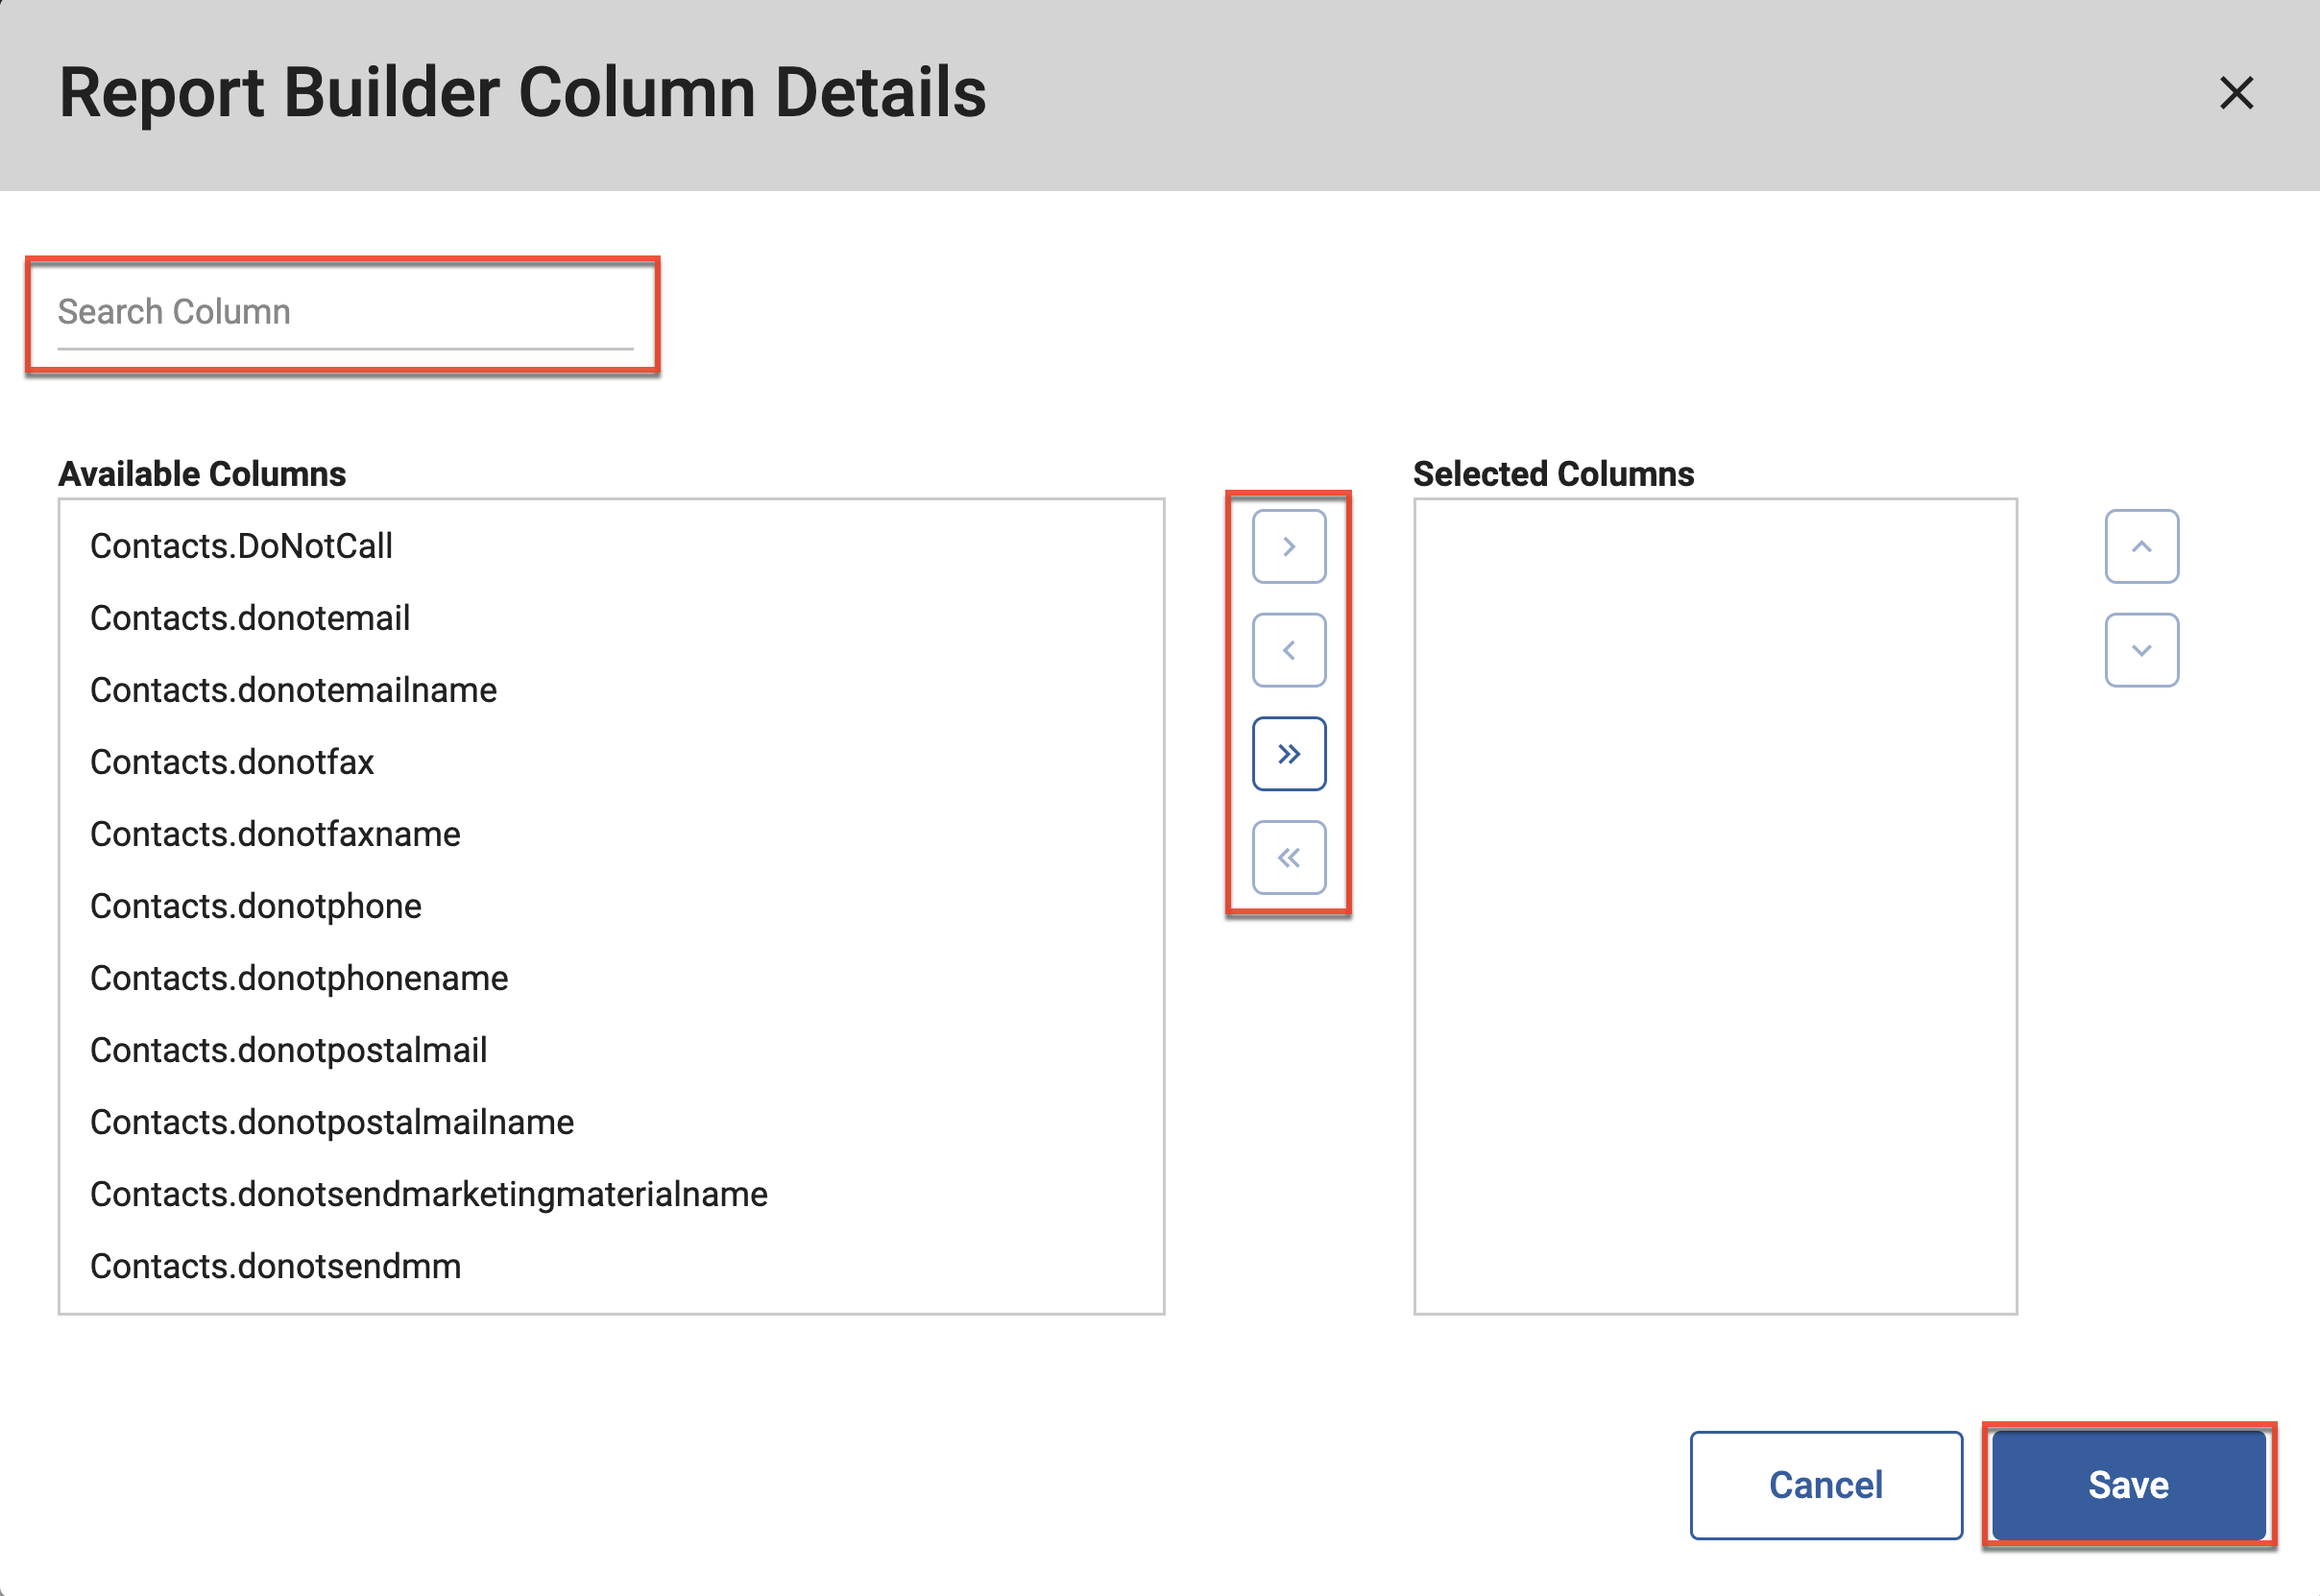
- Click the Save button after adding all desired fields.
Filters
You can use filters to set specific criteria the records need to satisfy to be included in the report.
Follow these steps to add a new filter to your report:
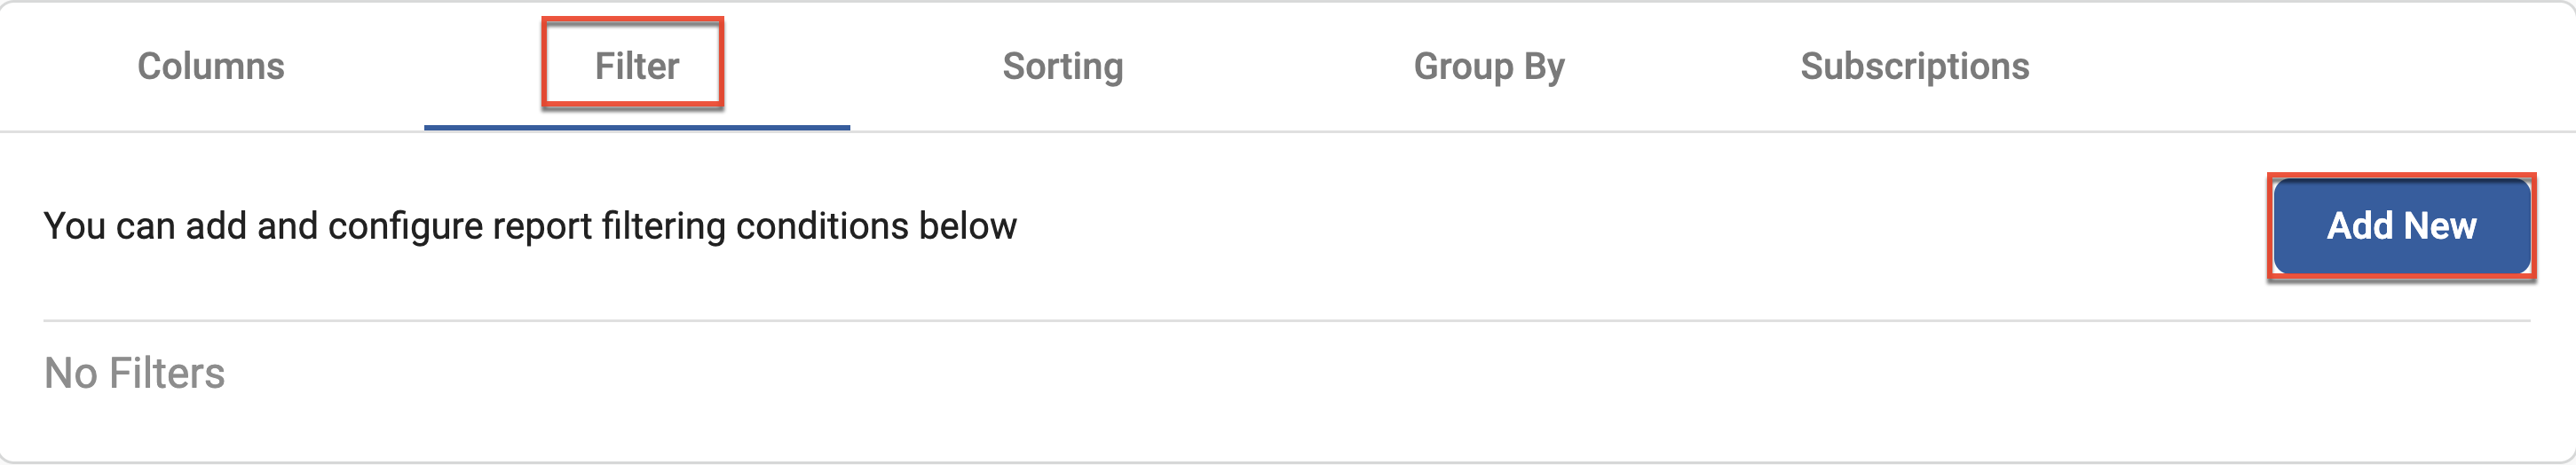
- On the Filter tab, click the Add New button.
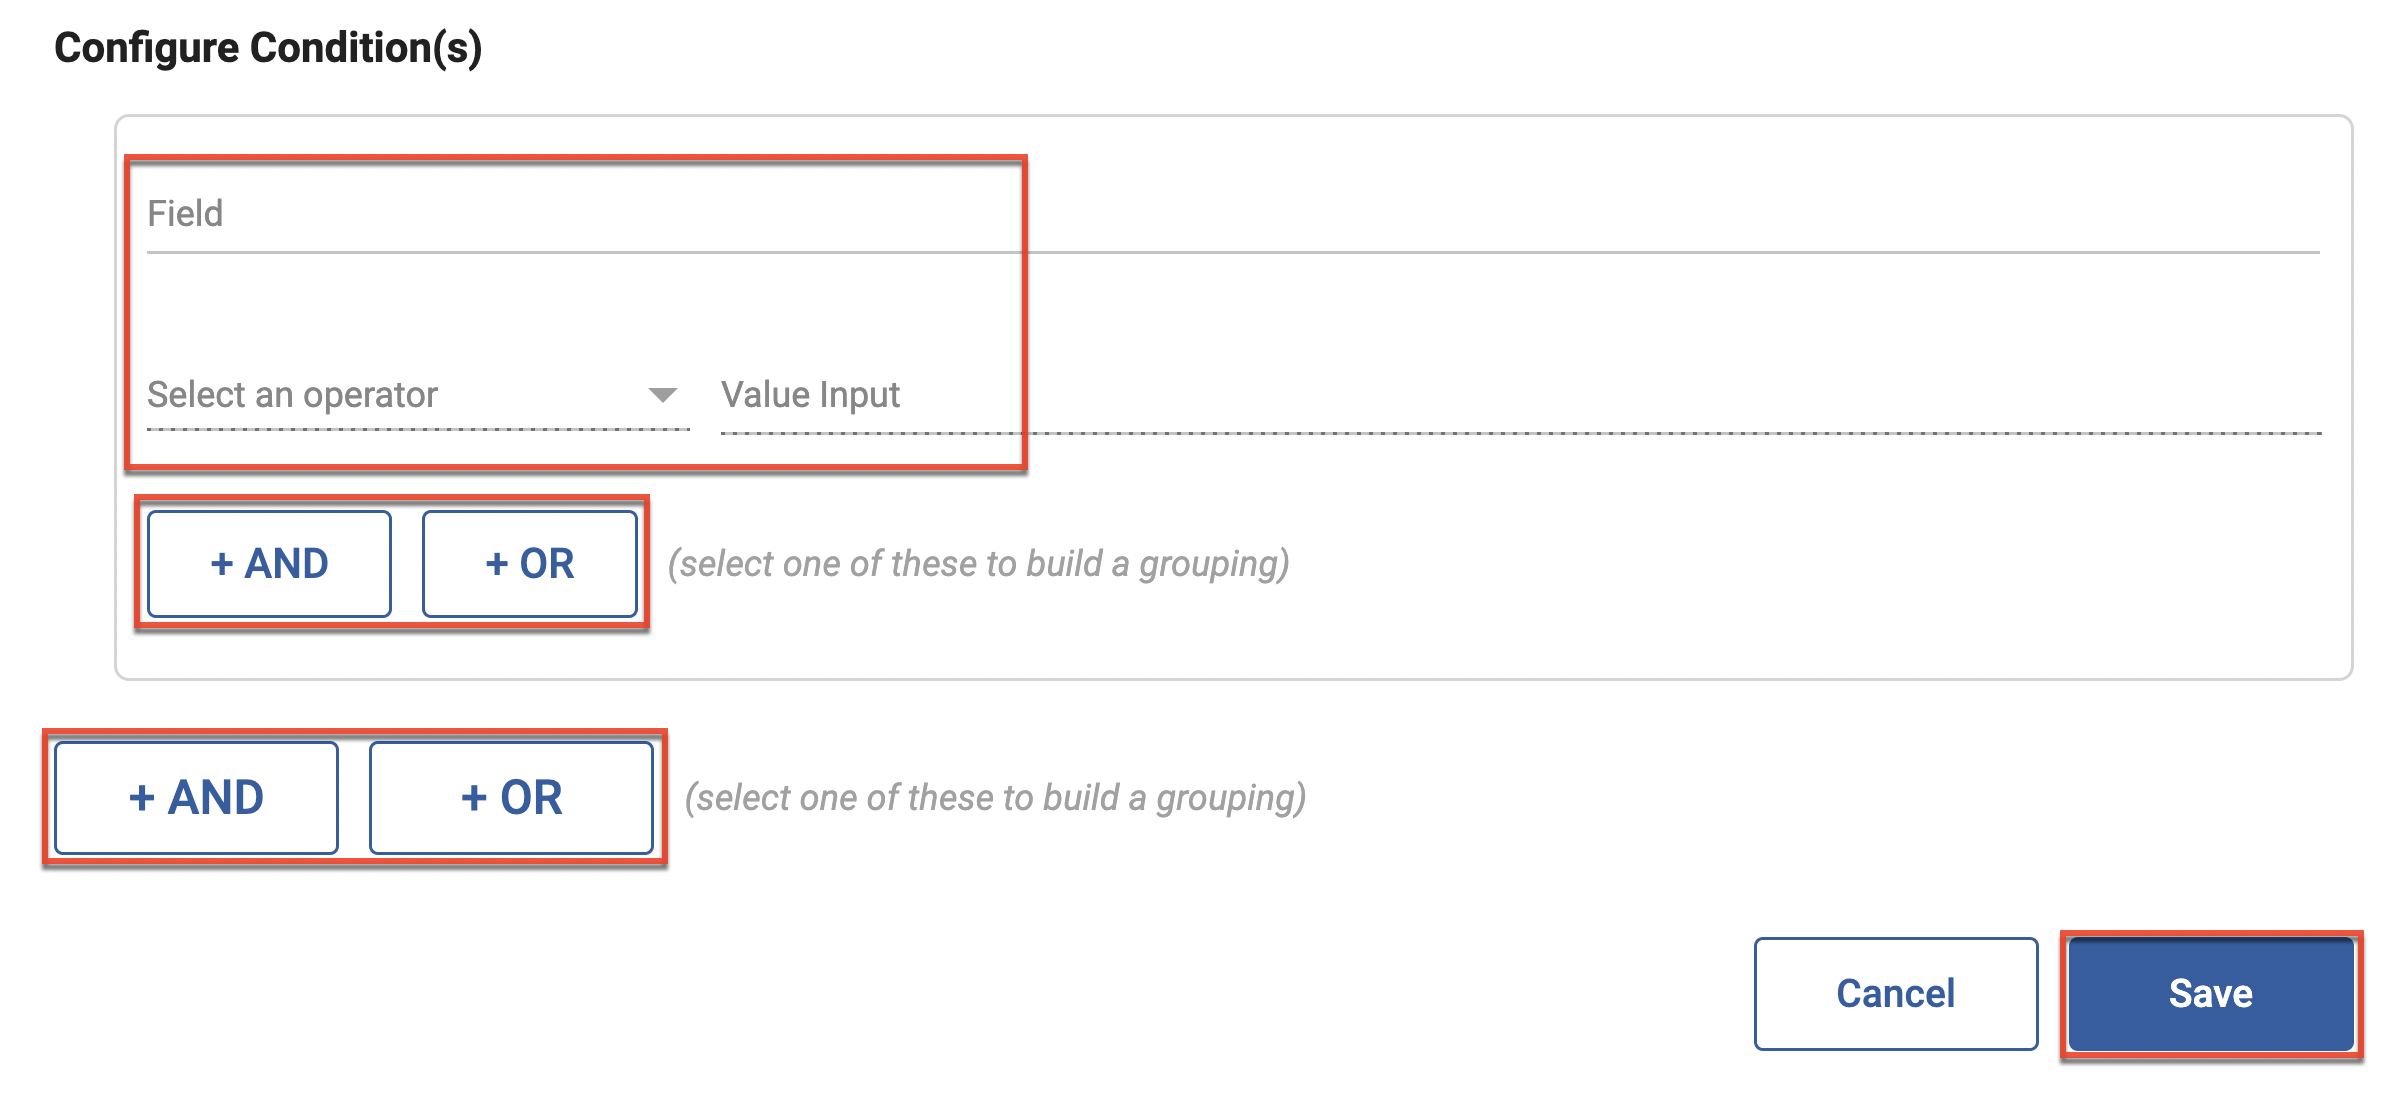
- In the Report Filtering dialog, select the field you wish to filter by as well as the operator and value input to be applied to the field.
- To add additional filtering conditions within a grouping click either the "+ And" or the "+ Or" button.
- To create an additional grouping with independent filtering conditions click either the "+ And" or the "+ Or" button below the existing grouping or groupings.
- Once you have created your filters click the Save button.
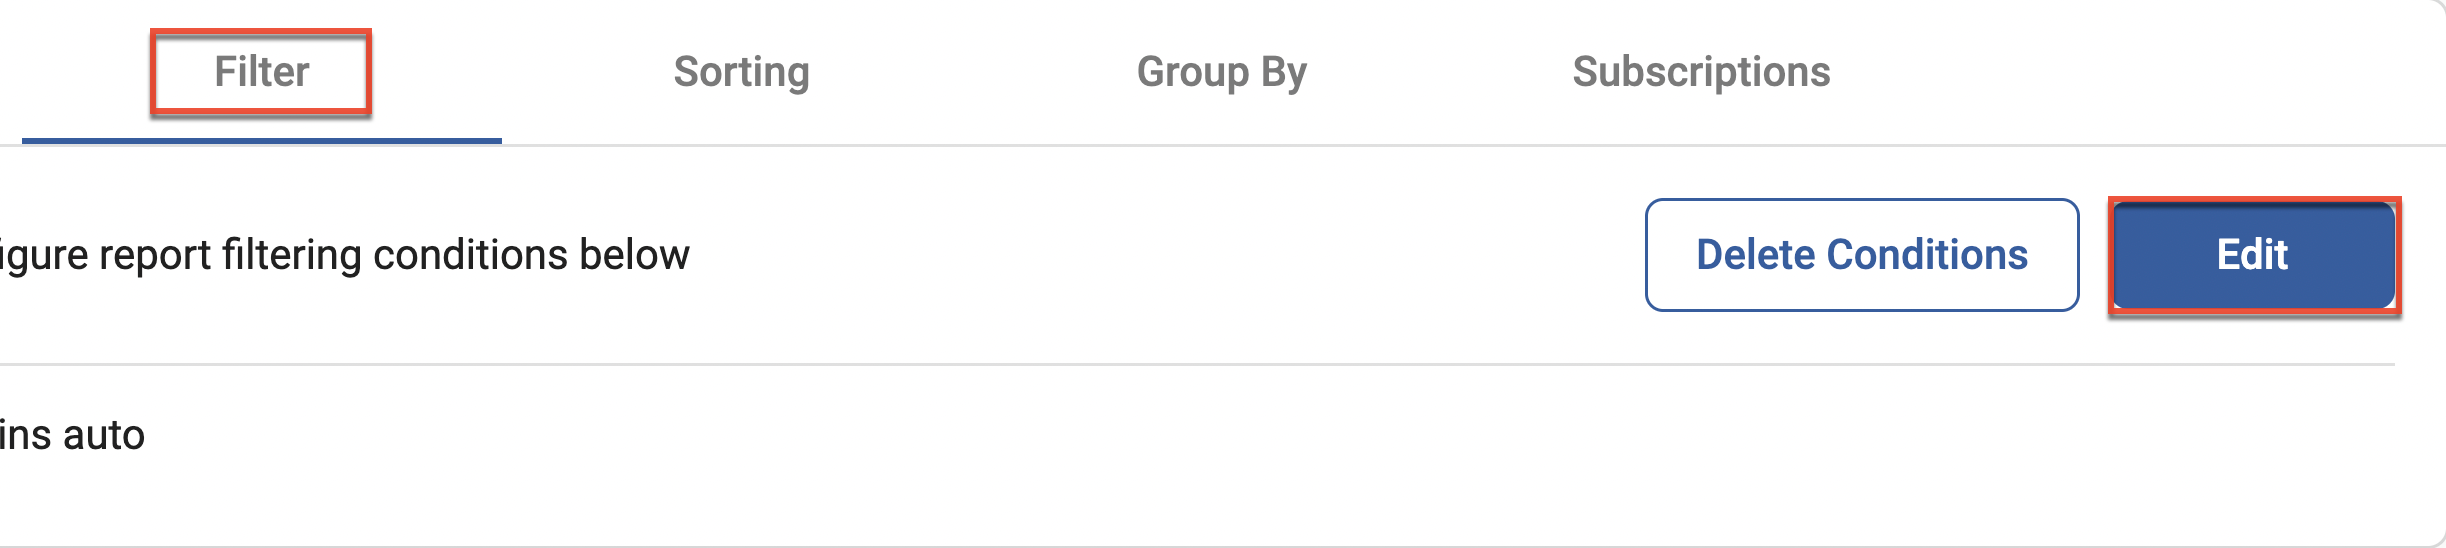
- To add additional filters to your report, click the Edit button.
Filtering on Date Fields
When creating a filter with a date fields you can set a range using the Greater than or equals operator and merge tags for the Value Input:
- Create a filter using a date field type.
- In the Operator field, select "Greater Than or Equal To".
- Click the Merge Tag icon.
- From the dropdown list select a time range.
- When using the Days Subtract or Days Add merge tags you must also specify the number of days. Ex. ++DaysSubtract5++
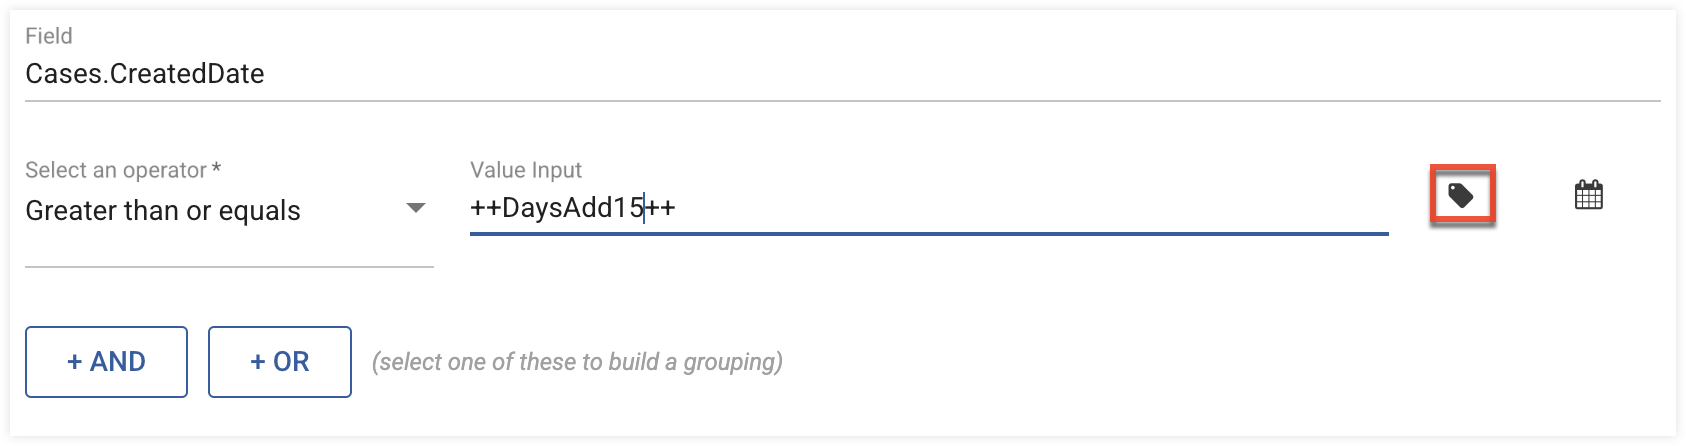
- Click the Save button.
Sorting
Identify the fields on which to sort your report and the order in which results should be displayed.
- On the Sorting tab, click the Add New button.
- Select the fields to sort your report by moving them from the Available Columns list to the Selected Columns list.
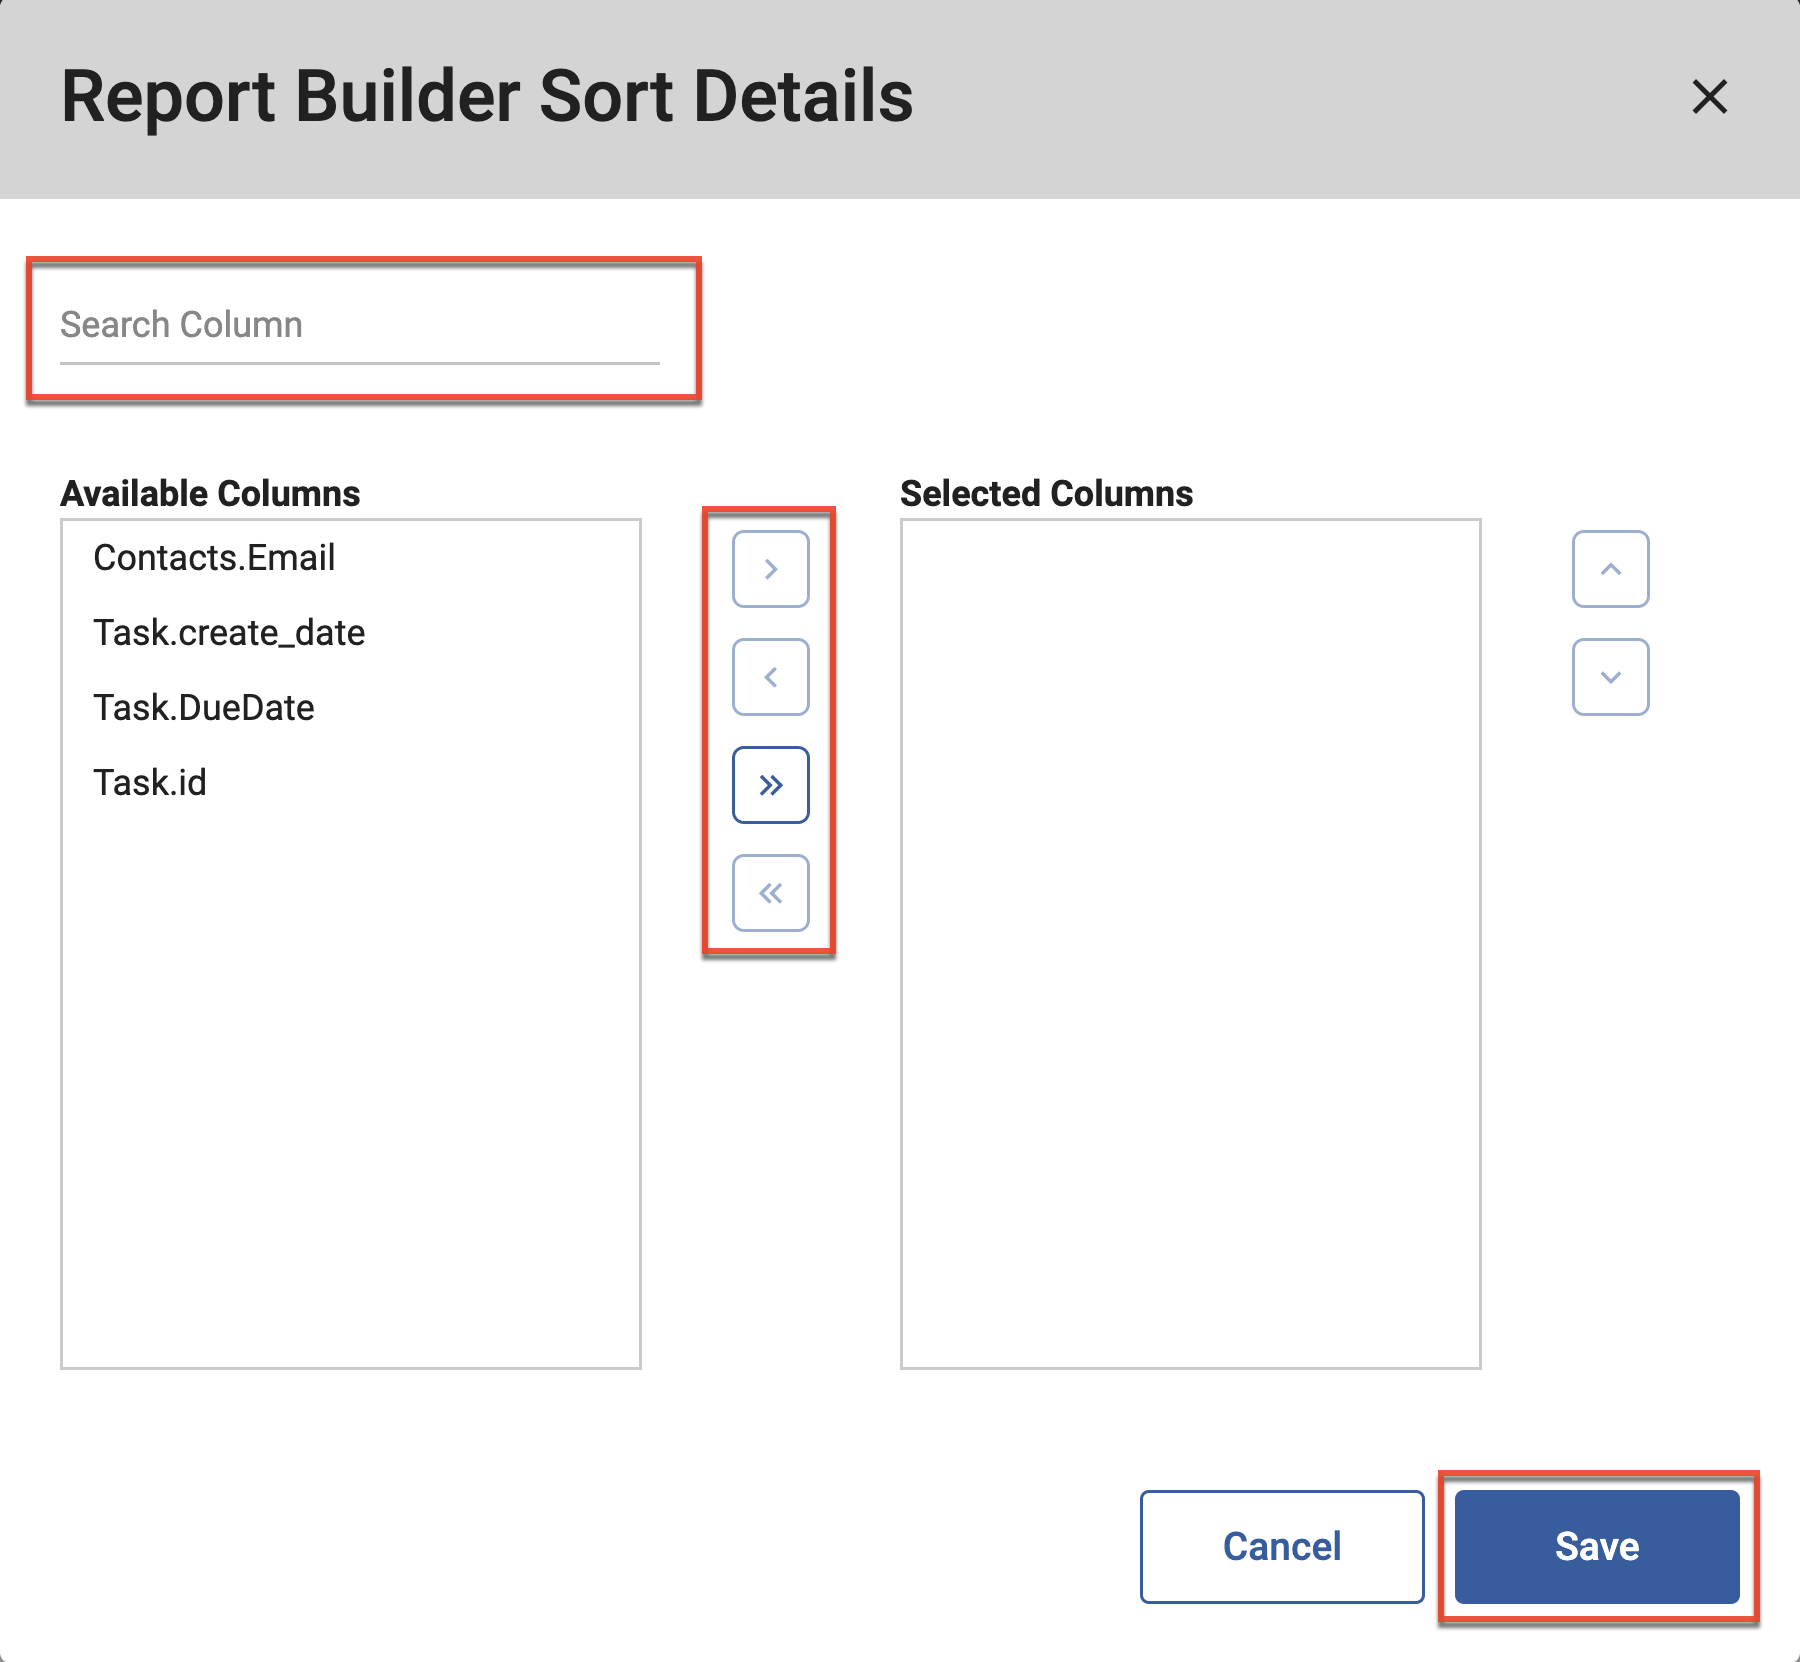
- Repeat to sort by additional columns, and then click the Save button.
- The default sort order is Ascending. To change the sort order, click the three dots menu within the Actions column and then select "Edit".
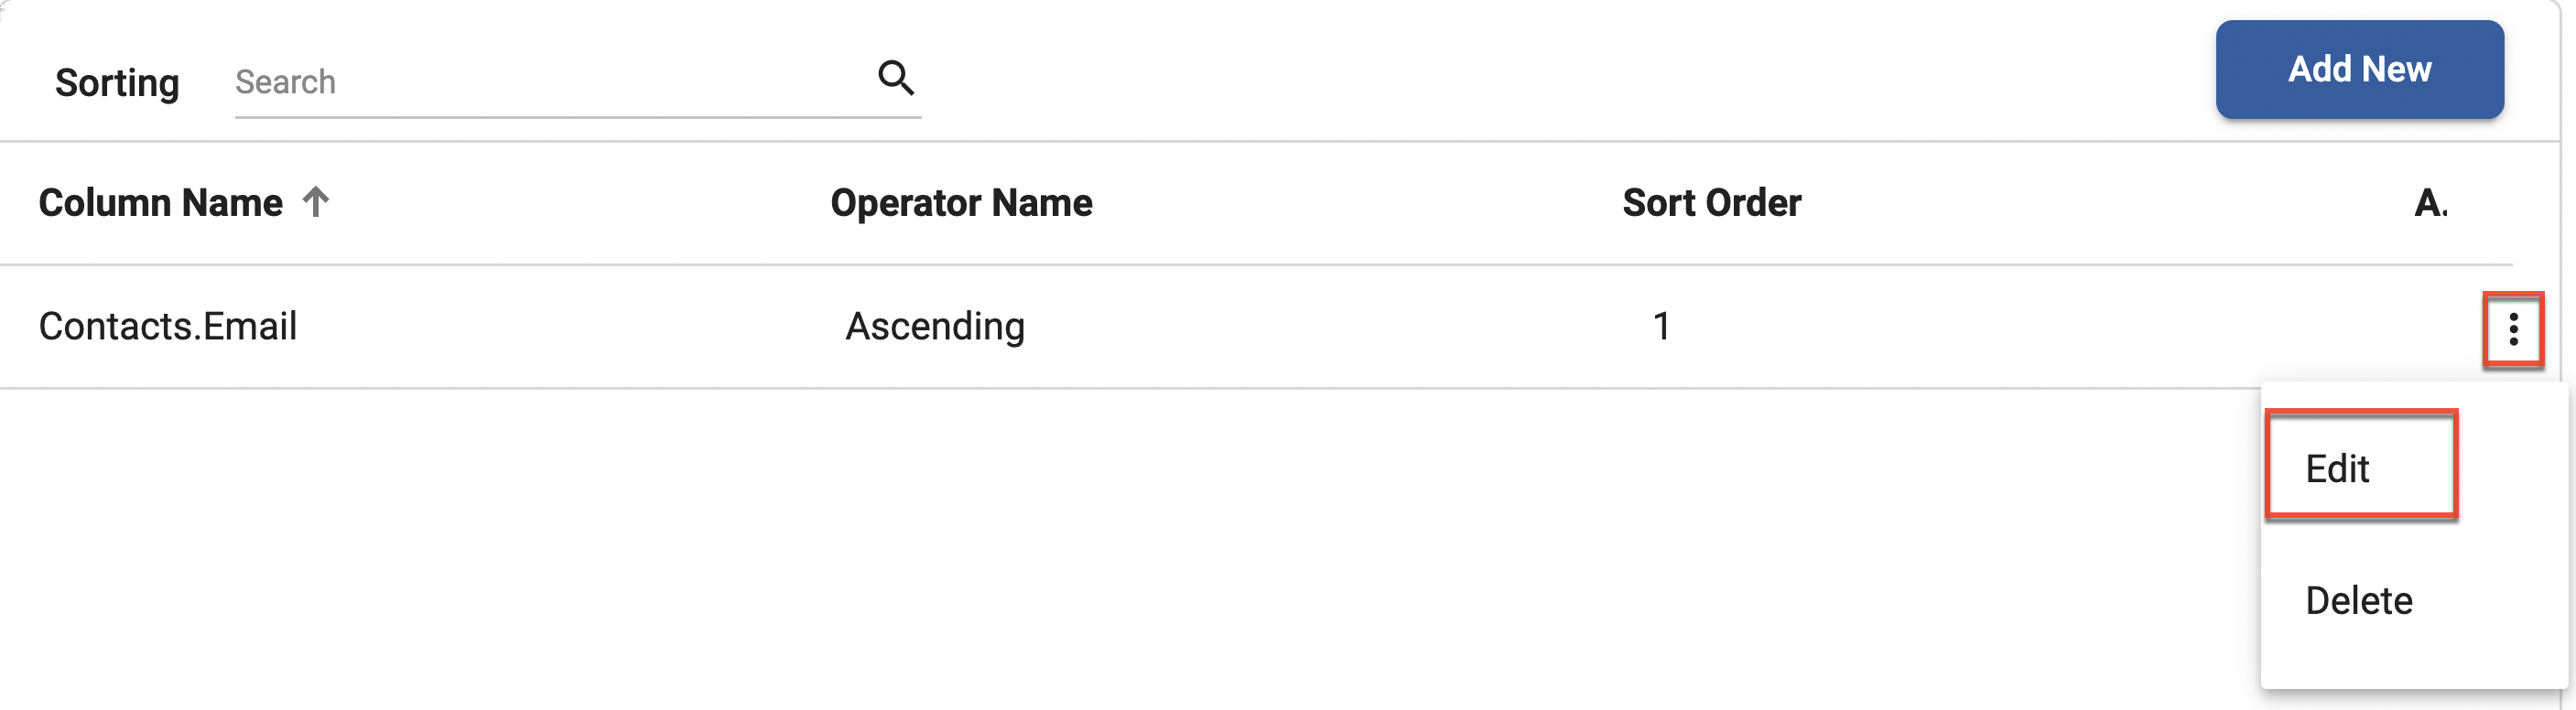
- Select the desired sort order, and then click the Save button.
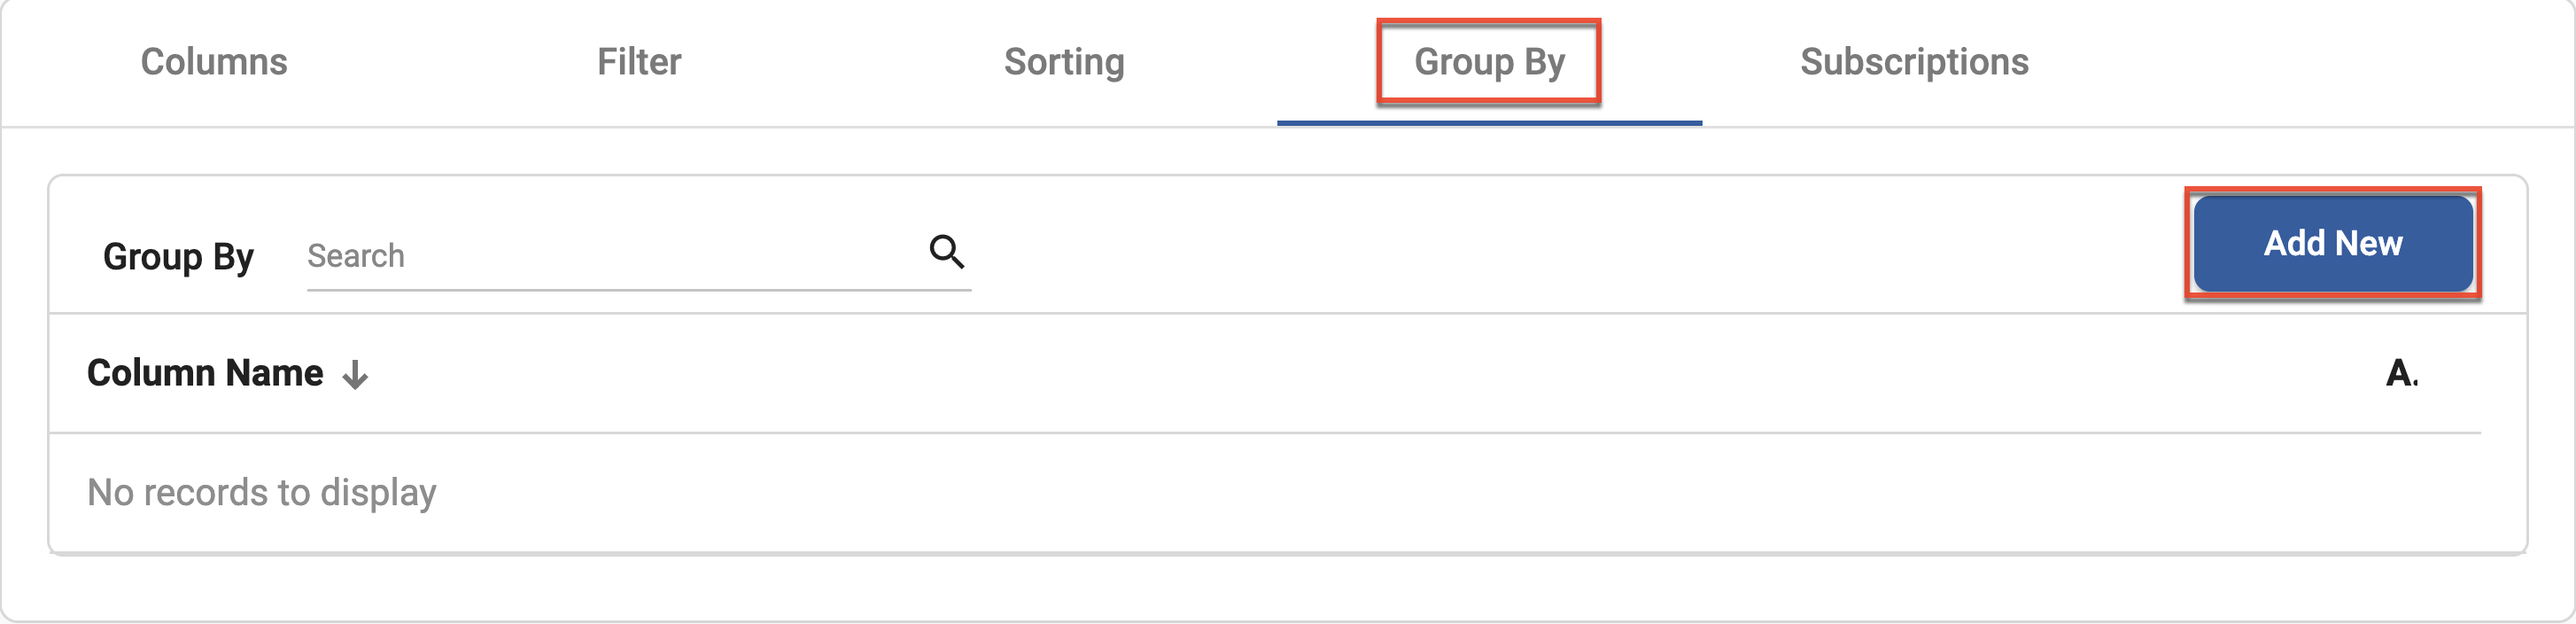
Group By
Group records that are duplicates. To merge identical records in the report grid together, you need to add all of the columns selected on the Columns tab to the Group By tab. Take special note that if there is a mismatch between the columns on the Columns tab and the Group By tab, the report will generate an error and output 0 records.
- On the Group By tab, click the Add New button.
- Select the fields to sort your report by moving them from the Available Columns list to the Selected Columns list.
- Repeat to group by additional columns, and then click the Save button.
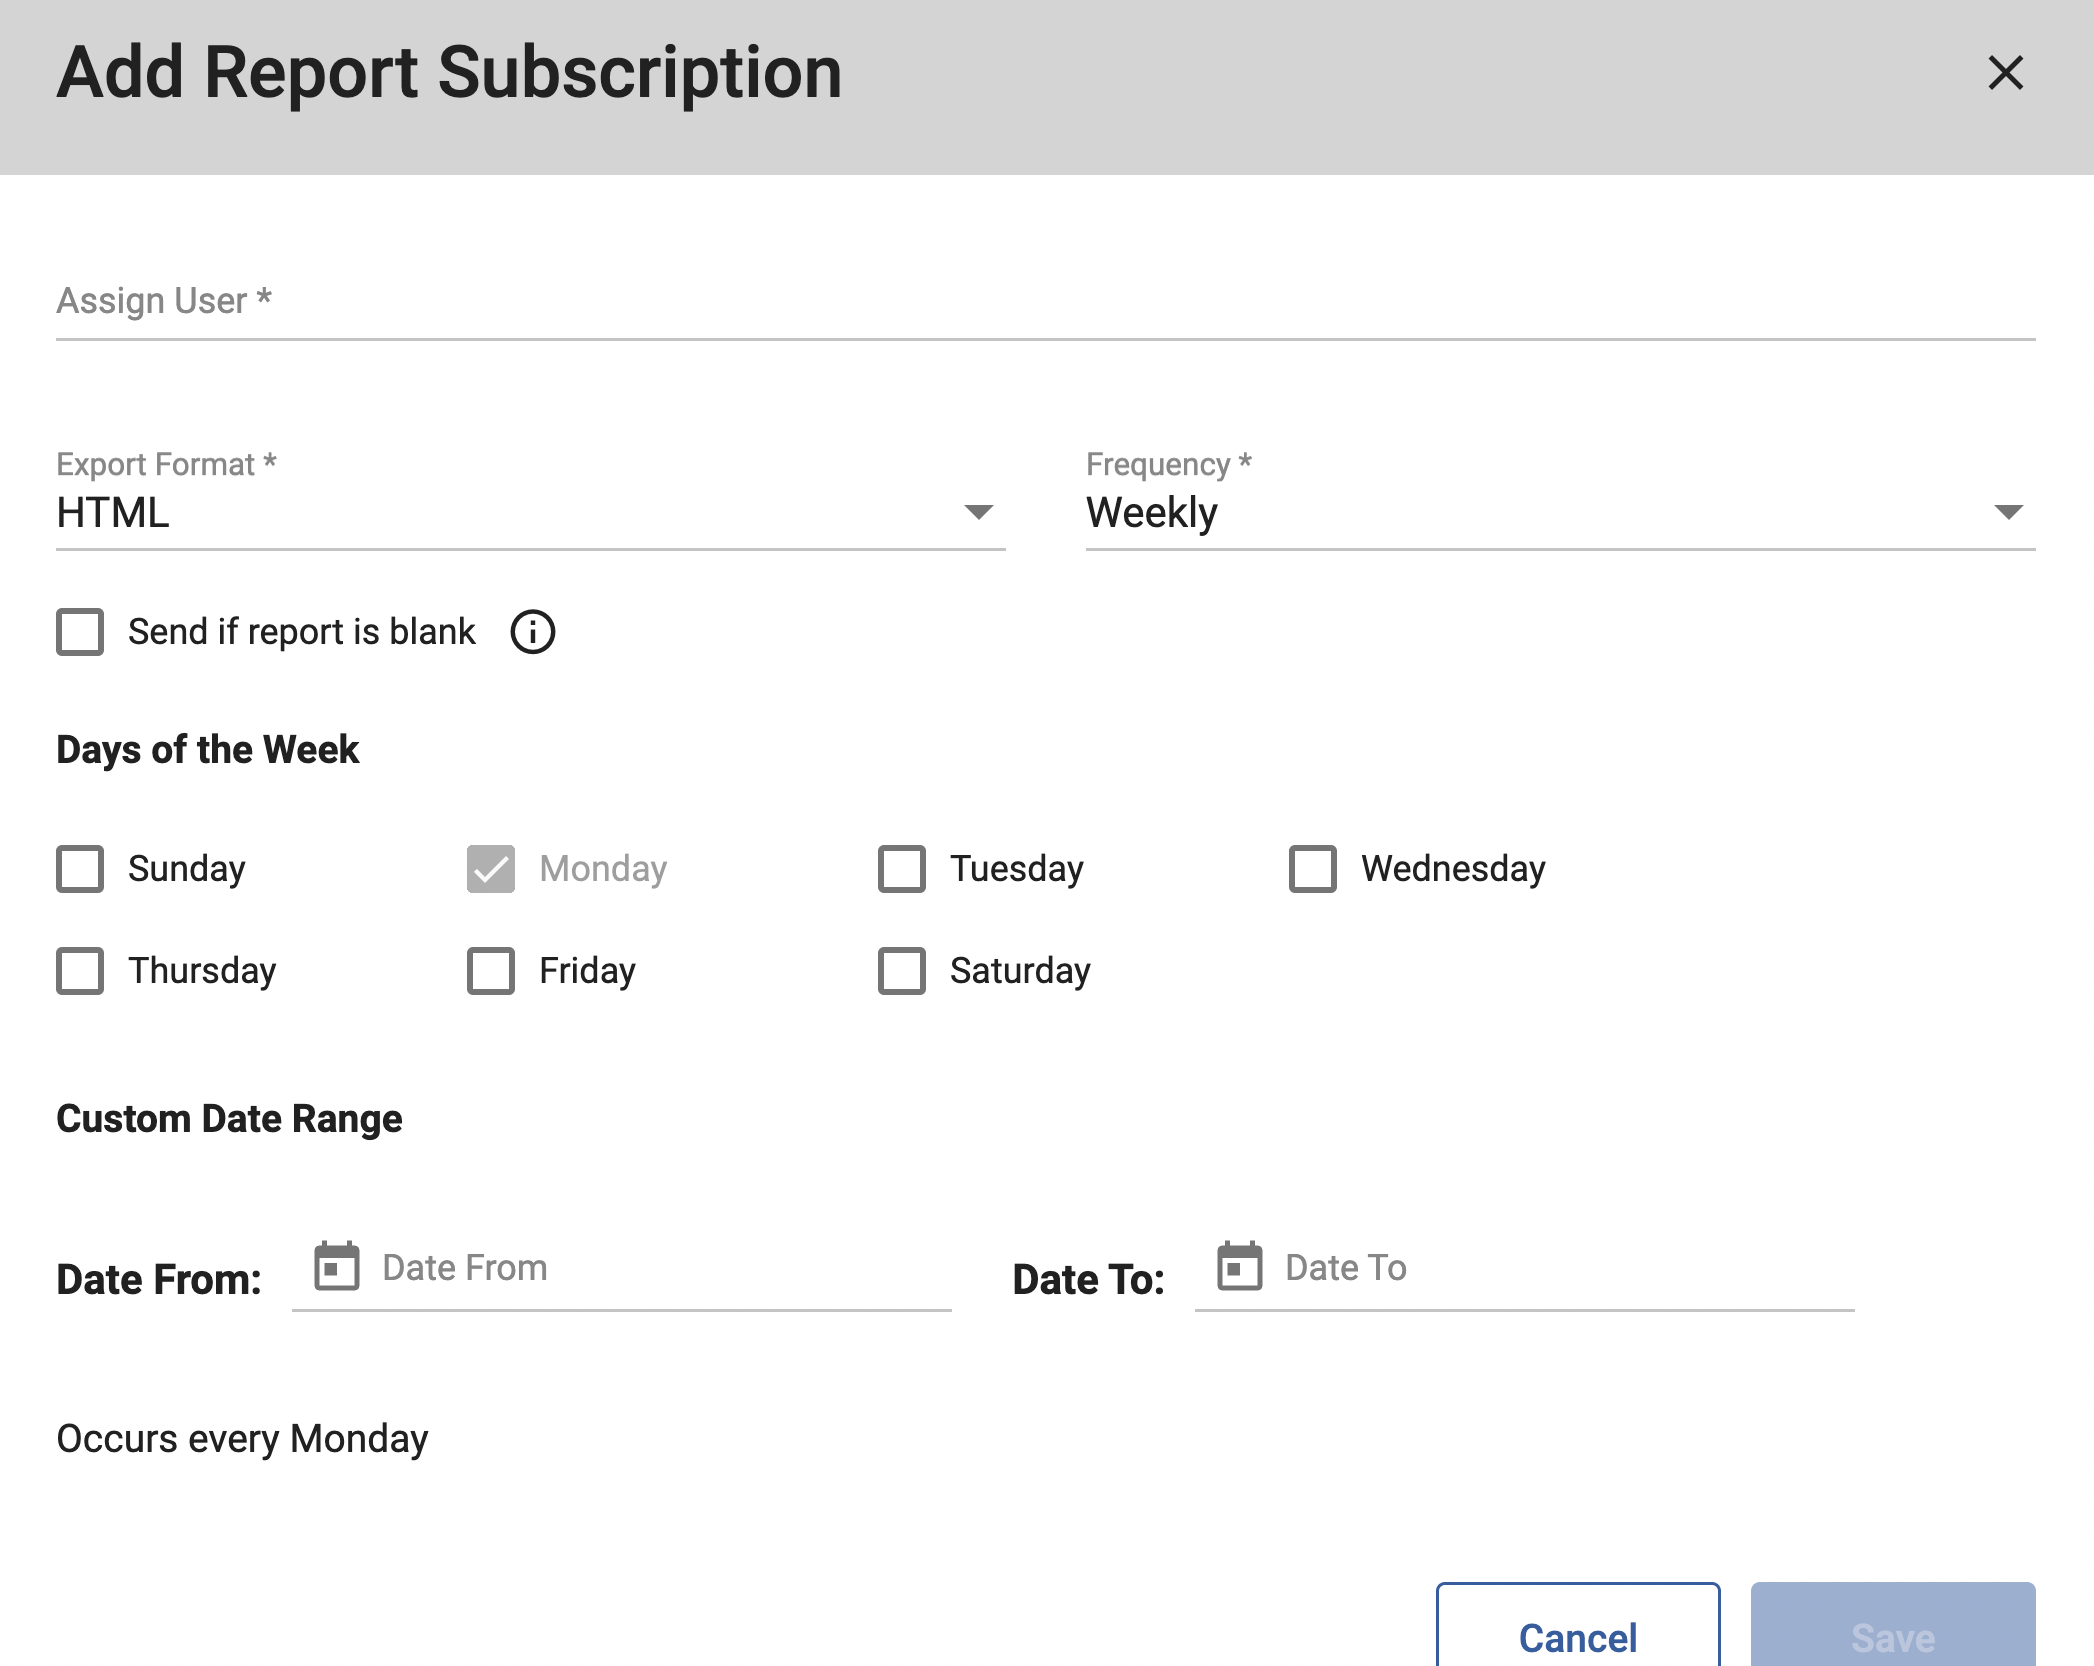
Subscriptions
Send the report by email to any Sugar Market user on a scheduled basis. This option is recommended for large reports (up to 25 MB). Please refer to the Sugar Market Settings and Preferences page for more information on managing subscriptions.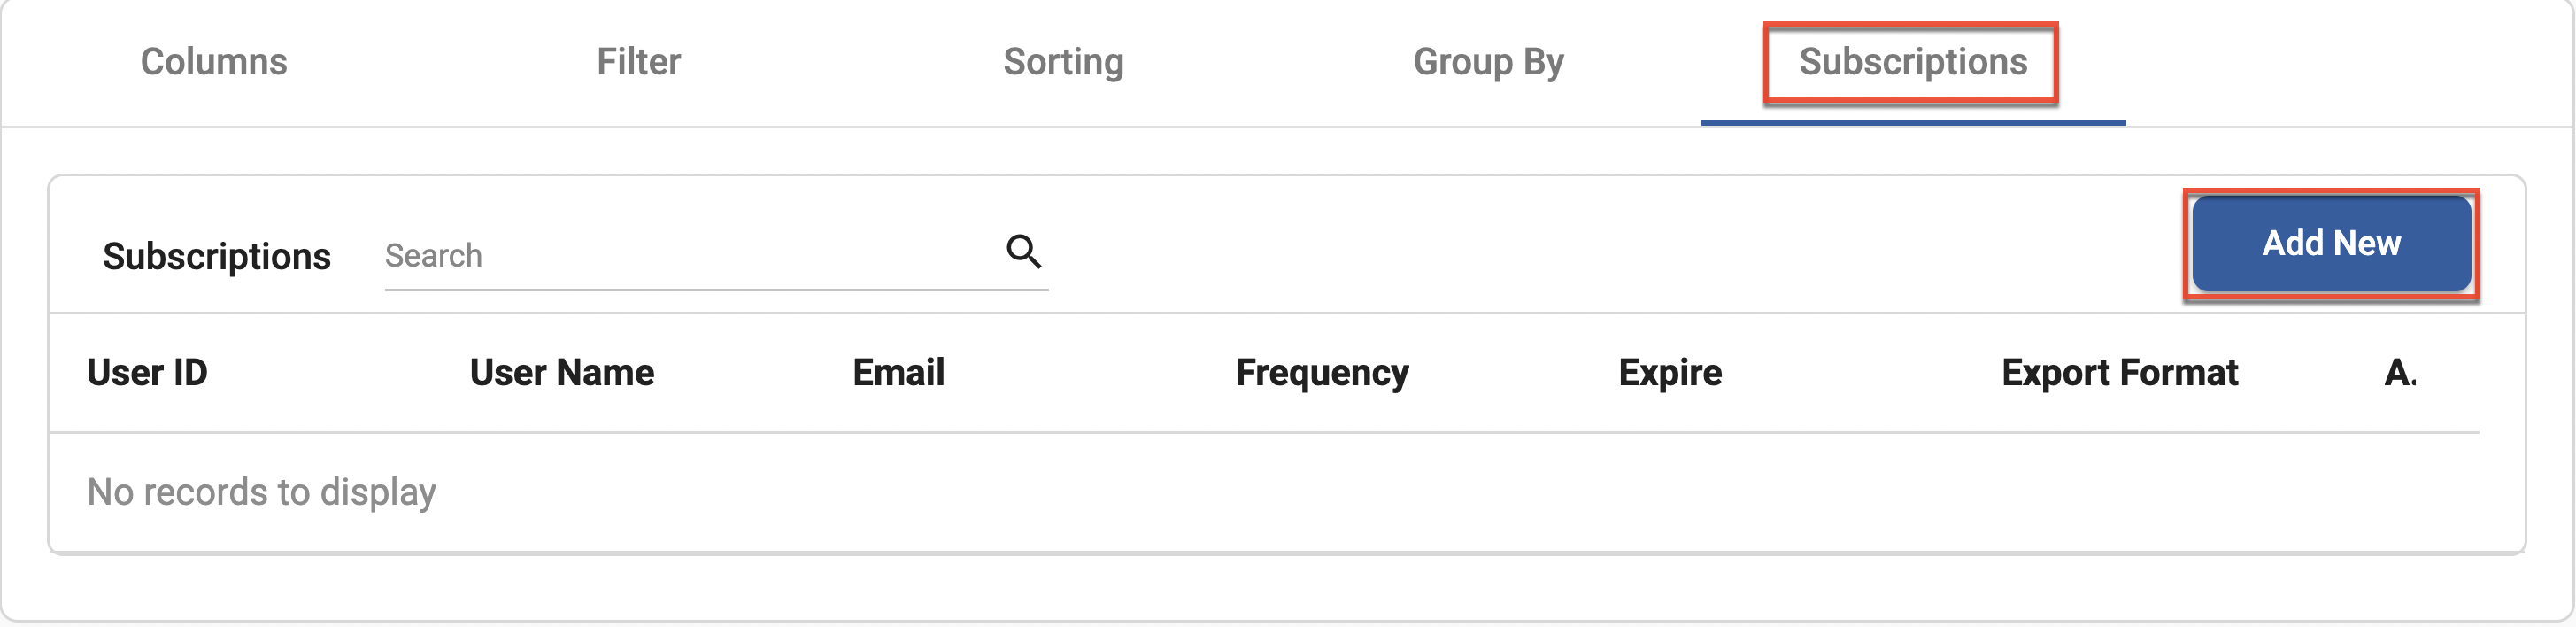
Running Custom Reports
Click the Run Report button for a list of options.
- Retrieve Record Count: Get a total count of records in your report.
- Report Viewer: View your results in a browser-based report viewer (limited to 2,000 records).
- Download to Excel: Download the report directly to your computer as an Excel document (limited to 10,000 records)
- Email Report: Email the report to yourself. Use this option if your report is greater than 10,000 records by less than 400,000 records. Also note that Excel has a limit of 1,048,576 rows. Any report with a larger record set than the Excel limit will not be successfully exported. To export a report larger than this limit, add another filter that will allow you to split the report in half, such as a date range or a filter on the IDs.
Advanced Report Templates
Sugar Market provides a few templates in the Sugar Market Templates folder for you to get started when using the Advanced Report Builder. These templates have the tables identified in the template name joined together and include common columns to help you get started.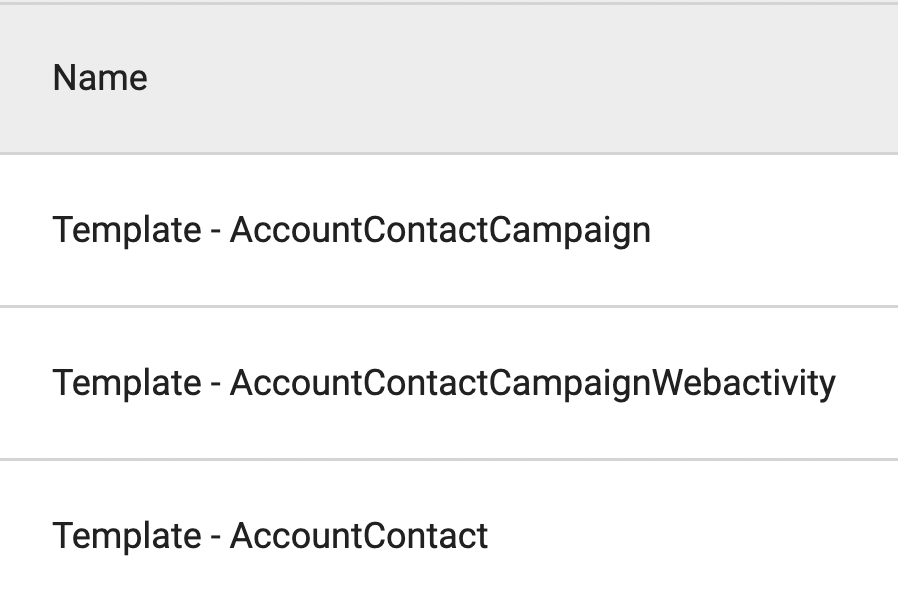
Before using one of these templates, consider the data you are looking for. If you are looking for contact data, then the template that has the Account table joined with the Contacts table will produce the desired results. The template that includes all three tables Account, Contact, and Campaign will provide better data at the campaign level.
Advanced Report Operators
When organizing report filters it is important to select the correct report operators to aggregate the desired results. Using the wrong operator could aggregate too many results, or produce the wrong result entirely.
Understanding Row Logic
It is important to specify the row logic being used when using more than one filter. There are only two values that can be selected: OR and AND. Choose the operator carefully since it determines the logic of the next filter. It can be helpful to read the statement as a sentence to determine which row logic to use. For example:
- "Where email contains '@aol.com' AND deliverystatus equals '1'" will only aggregate results that fulfill both criteria.
- "Where email contains '@aol.com' OR deliverystatus equals '1'" will aggregate the results that fulfill either criteria.
| Operation | Description |
| Equals | Equates to the exact value of. Use this operator for text fields, not the "Is" operator. |
| Does Not Equal | Ignores the values that do not match. Use this operator for text fields, not the "Is not" operator. |
| Contains | Will contain alpha/numeric characters anywhere within the full value. |
| Does not contain | Will not contain alpha/numeric characters anywhere within the full value. |
| Begins with | The queried value will start with alpha/numeric characters within the column value area. |
| Ends with | The queried value will end with alpha/numeric characters within the column value area. |
| Is less than | The queried value is fewer than the integer specified. |
| Is less than or equal to | The queried value is the same as, or fewer than the specified value. |
| Is greater than | The queried value is greater than the integer specified. |
| Is greater than or equal to | The queried value. |
| Is in list | Searches a value contained in a list of values notated by the ('') format. Example: ('Georgia','New York','Alabama'). The column value should not exceed 200 characters. |
| Is not in list | Is one value NOT contained in a list of values notated by the ('') format. Example: ('Georgia','New York','Alabama'). The column value should not exceed 200 characters. |
| In Geos | Selects values that are within a geographical list set up within the administration view. |
| Not in Geos | Selects values that are within a geographical list set up within the administration view. |
| Is | Returns all null values in the selected column when "NULL" is identified as the column value in the report filter. |
| Is not | Excludes all null values in the selected column when "NULL" is identified as the column value in the report filter. |