Exploring Data in Advanced Analytics
This page introduces you to Explore. You can use Explore to create powerful reports with your marketing data in Sugar Market's Advanced Analytics, powered by Looker.
Getting Started
Accessing Explore
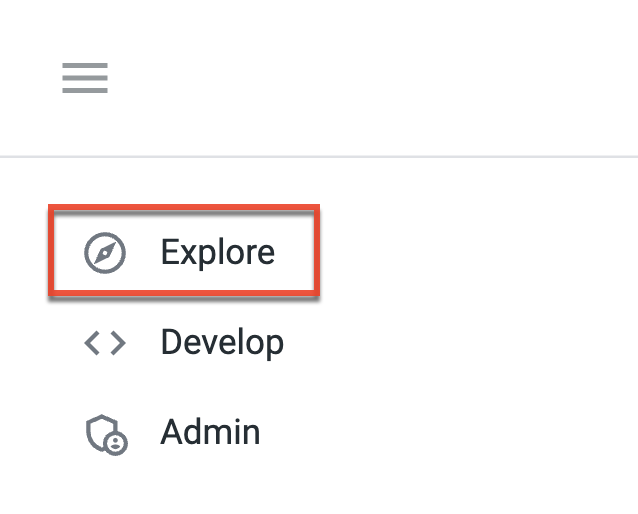
To access Explore click "Explore" in the navigation bar. See the Exploring Data in Looker article on Google Cloud's website for more details on using Explore in Advanced Analytics.
Note: Some features presented in Google Cloud's Looker documentation may not be available in Advanced Analytics.
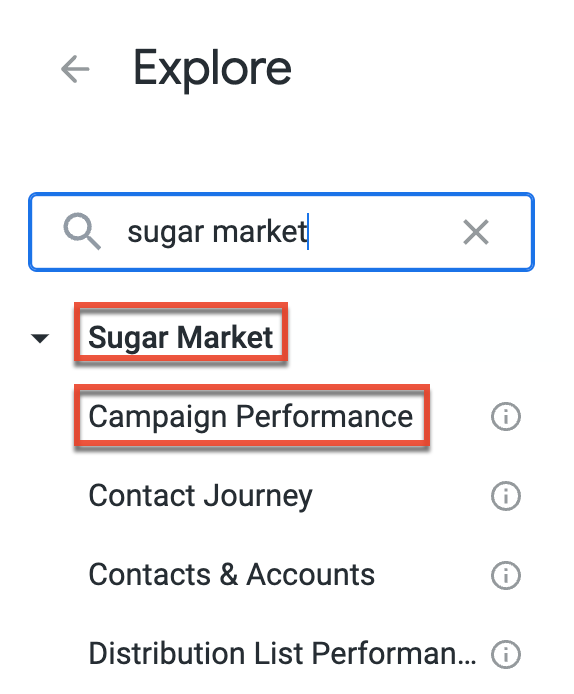
From the Explore menu, you can view and search available Views contained in your Explore. A view is a grouping of dimensions and measures associated with a specific set of data. For example, the Explore pictured below is titled "Sugar Market" and one of the views within that Explore is titled "Campaign Performance".
Customizing Your View
Once you have a view you want to access you can click the view title to start customizing it.
Selecting Dimensions and Measures
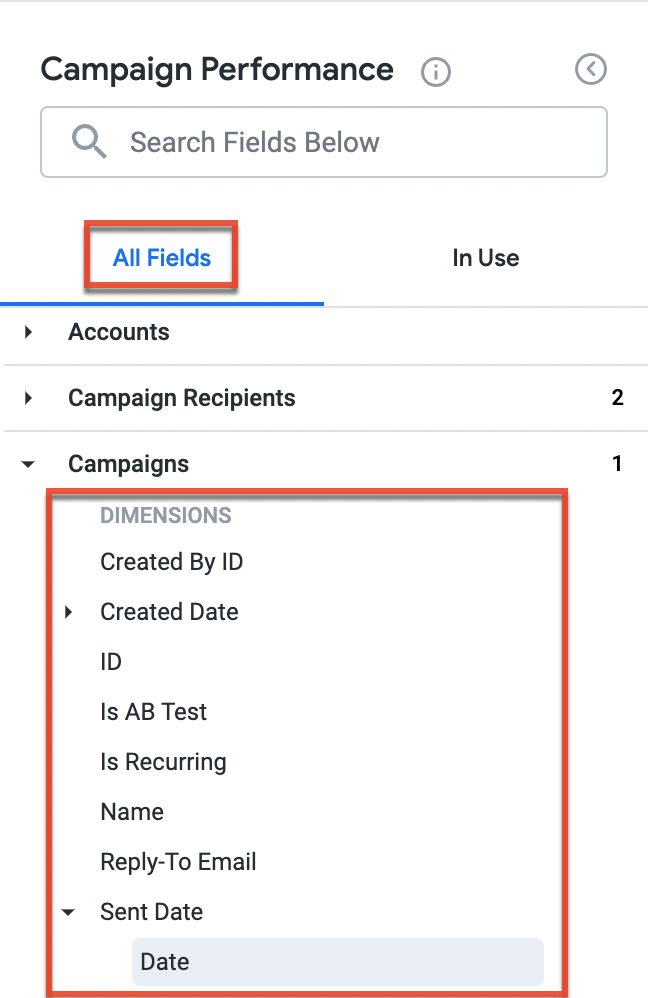
Fields are displayed as Dimensions and are found on the right-hand side of the view. Dimensions are used to display and group the data set of the selected view. Once a dimension is selected it will be added as a column.
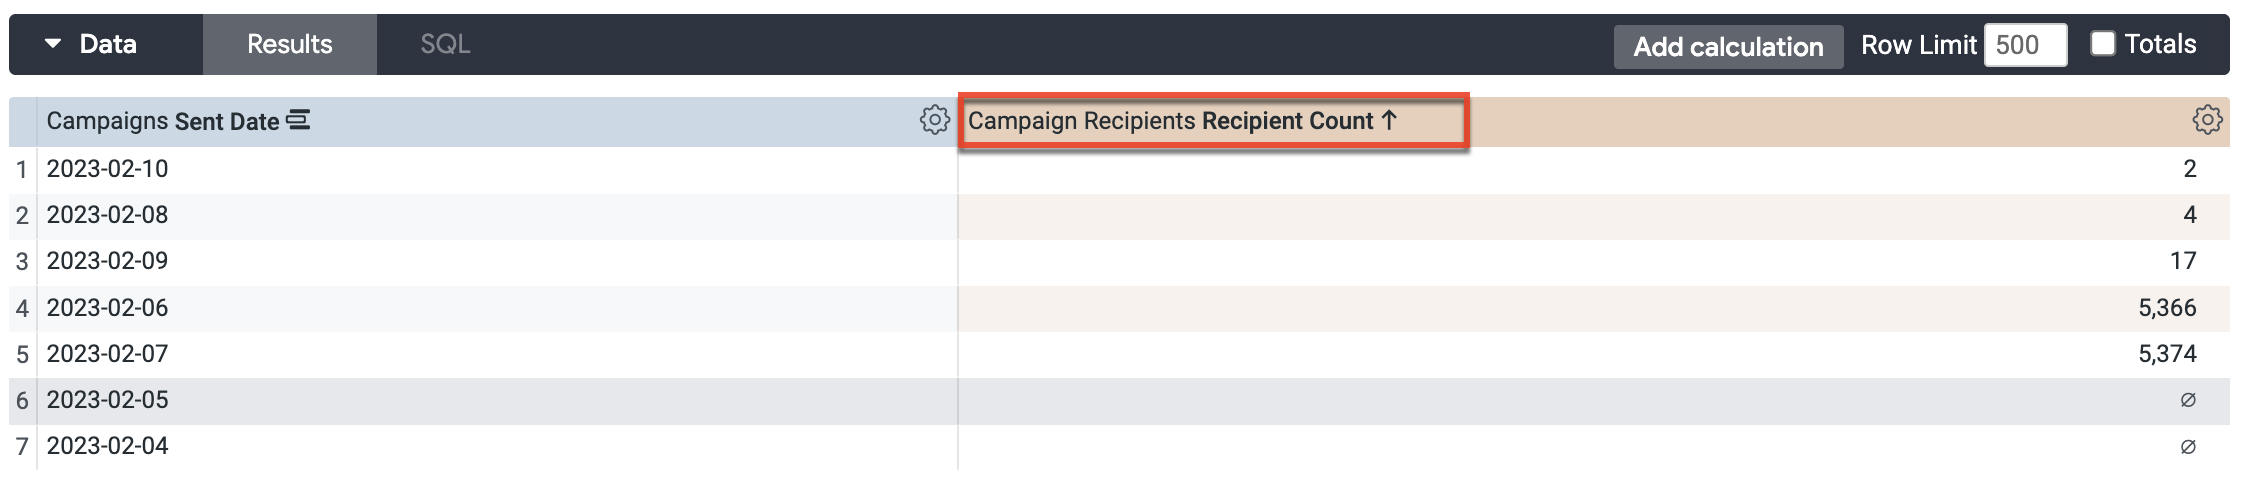
Measures are found at the bottom of a specific section of dimensions. A measure will display data in relation to your selected dimensions. Once a measure is selected it will be added as a column. 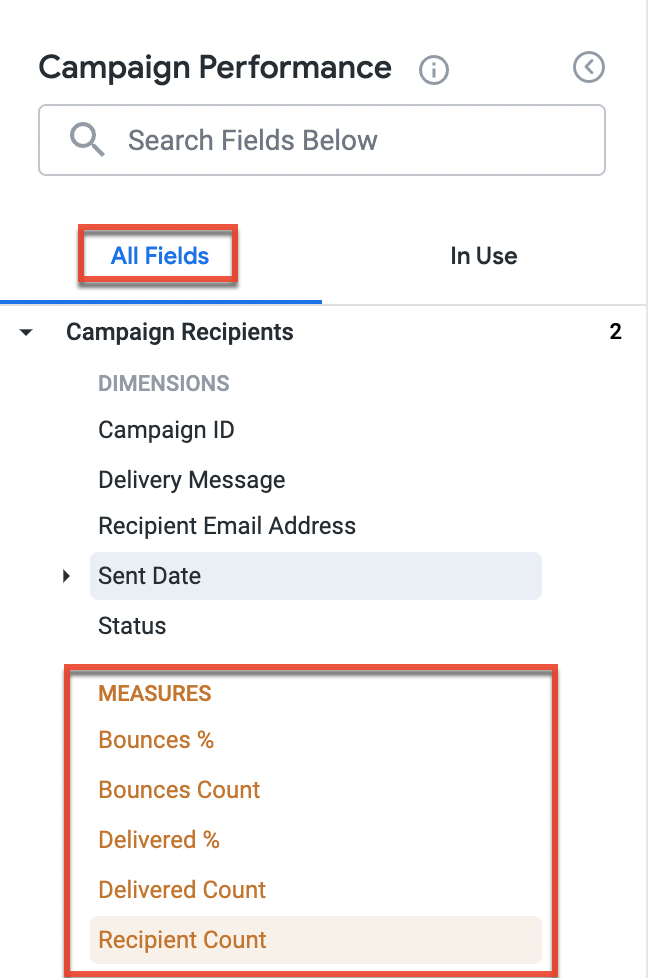
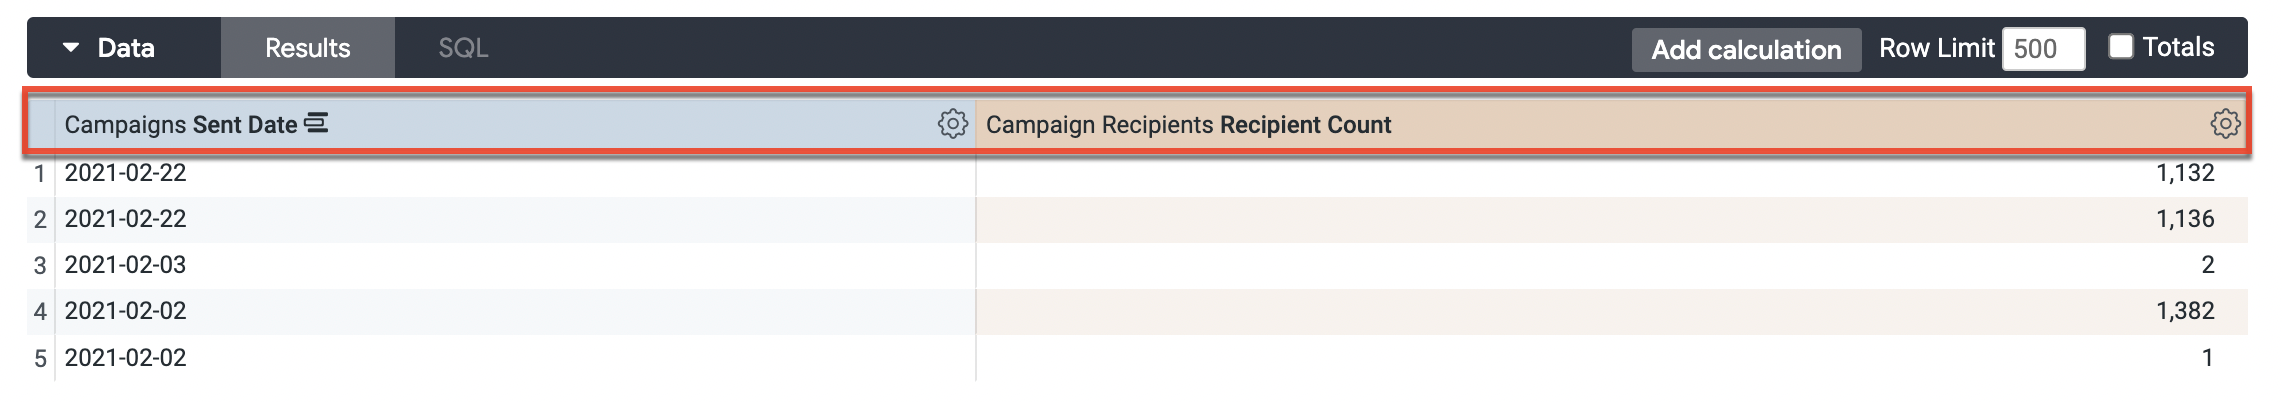
For example, the customized Campaign Performance view pictured below displays the campaign record data set grouped by the "Campaigns Send Date" dimension. In addition, the "Campaign Recipients Recipient Count" measure displays the number of recipients for each campaign record within that grouping.
Adding Filters
You can filter any dimension or measure added to your customized view. There are three filter types:
Basic Filters
The most common filter type, utilizes dropdown lists, calendar widgets, and/or text fields. To add a basic filter you can either click the gear icon at the top of the field column and select the Filter option or hover over the field name in the field selection section and click the filter icon.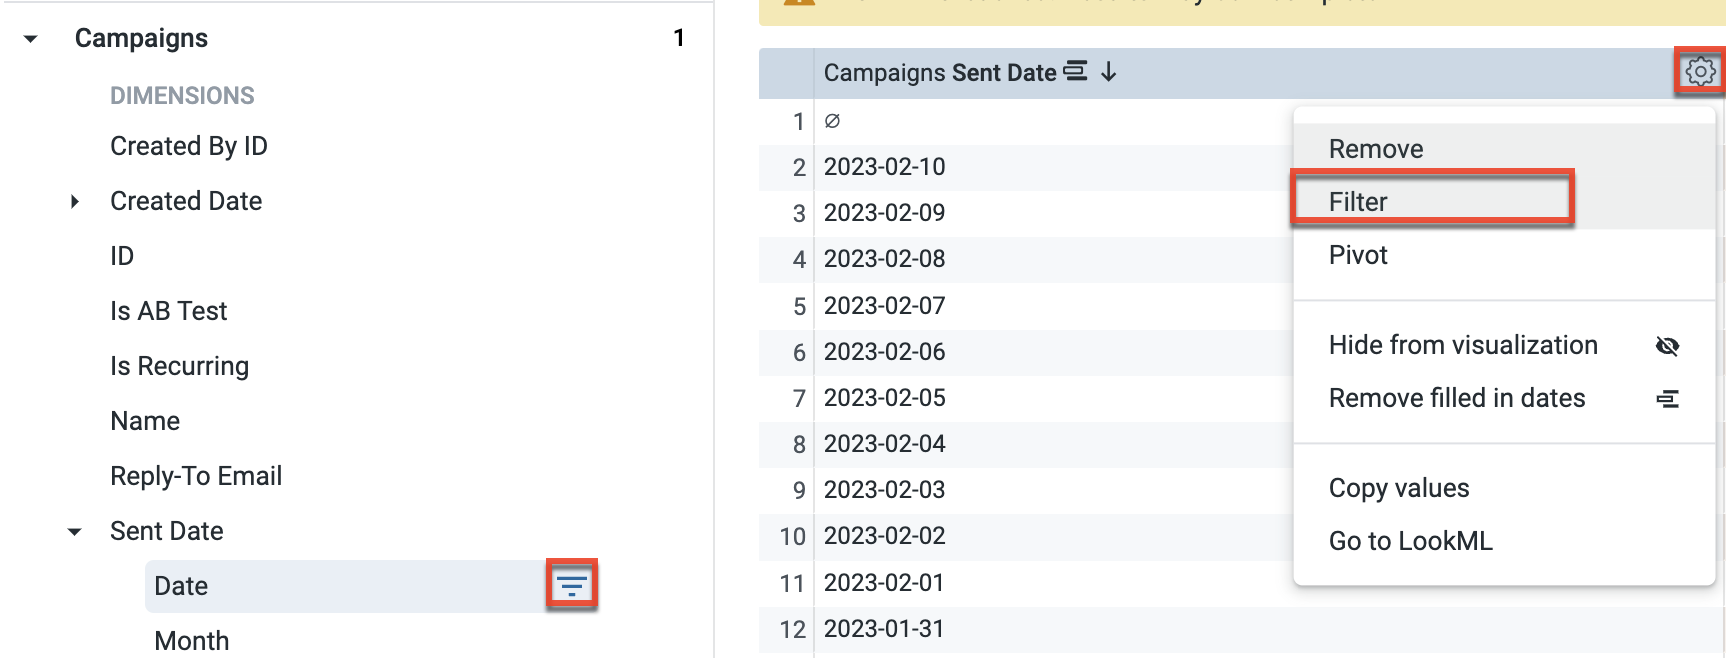
Advanced Matches Filters
Advanced matches filters allow you to set a more advanced condition for a field, like intricate text searches, or a date range that starts in the past and goes for a certain number of days. To add an advanced matches filter, create a basic filter and then select the matches (advanced) option from the filter operator dropdown field. 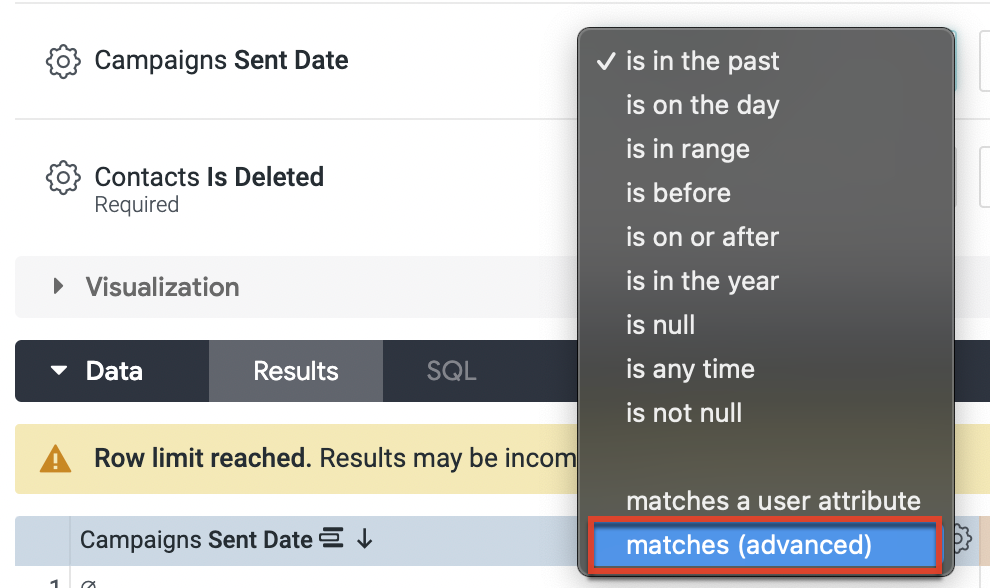
Custom Filters
Allows you to specify more detailed logic, especially when you need to combine AND and OR logic. To add a custom filter expand the filters section and check the Custom Filters checkbox.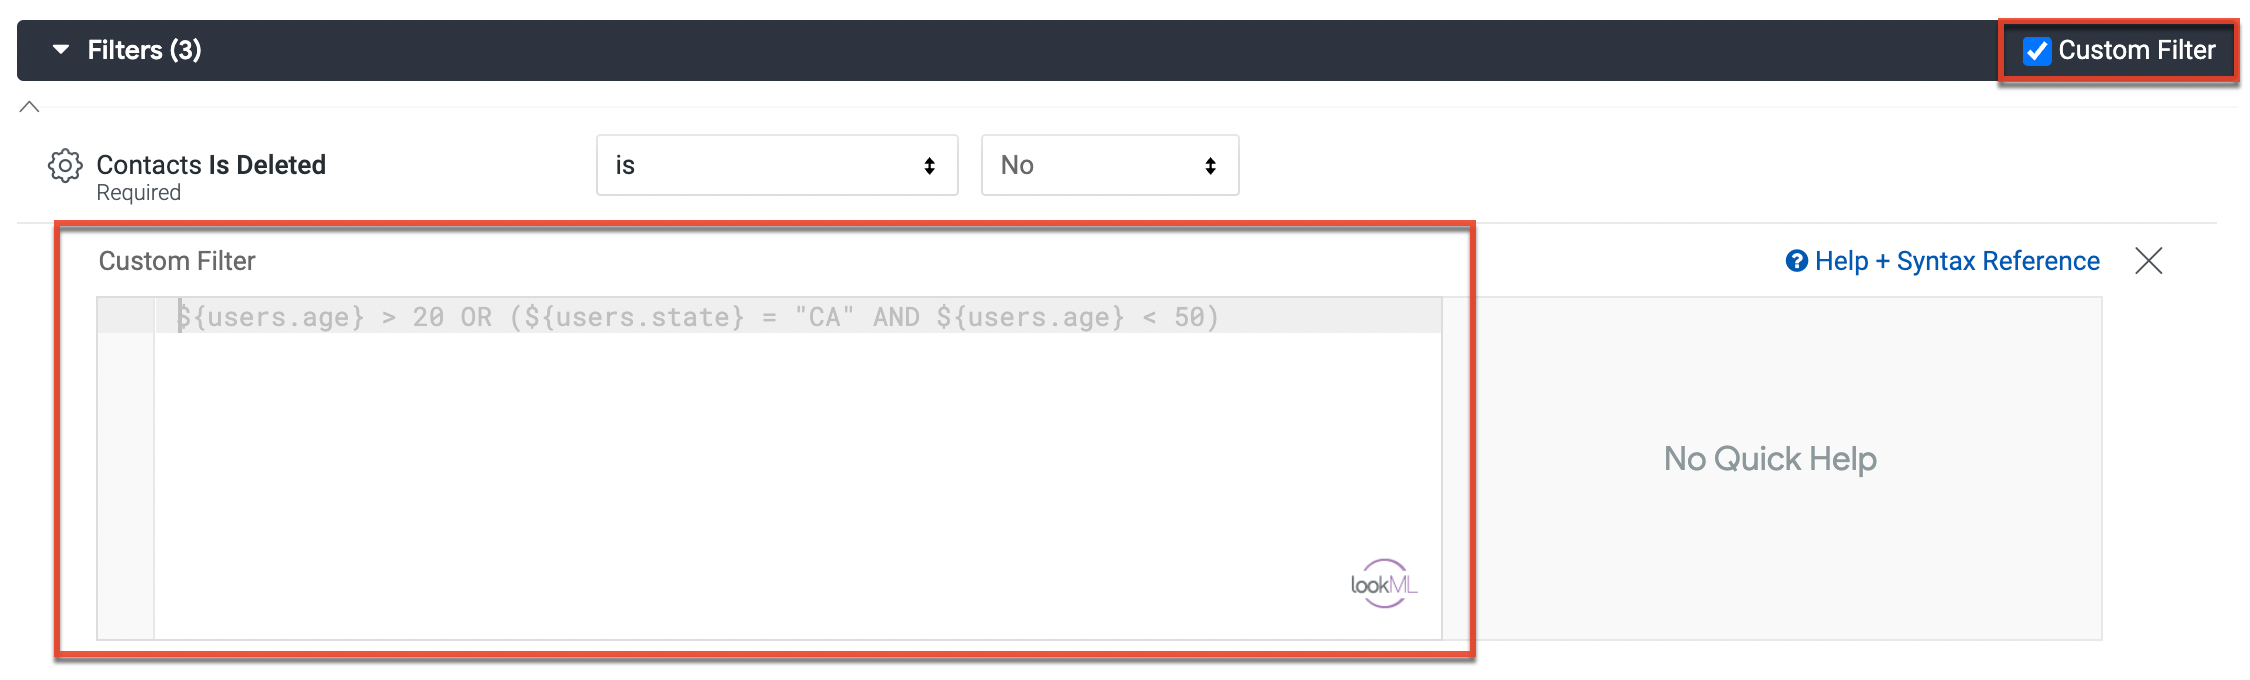
Sorting Data
You can click on the column header of any dimension or measure in your view to sort by that field.
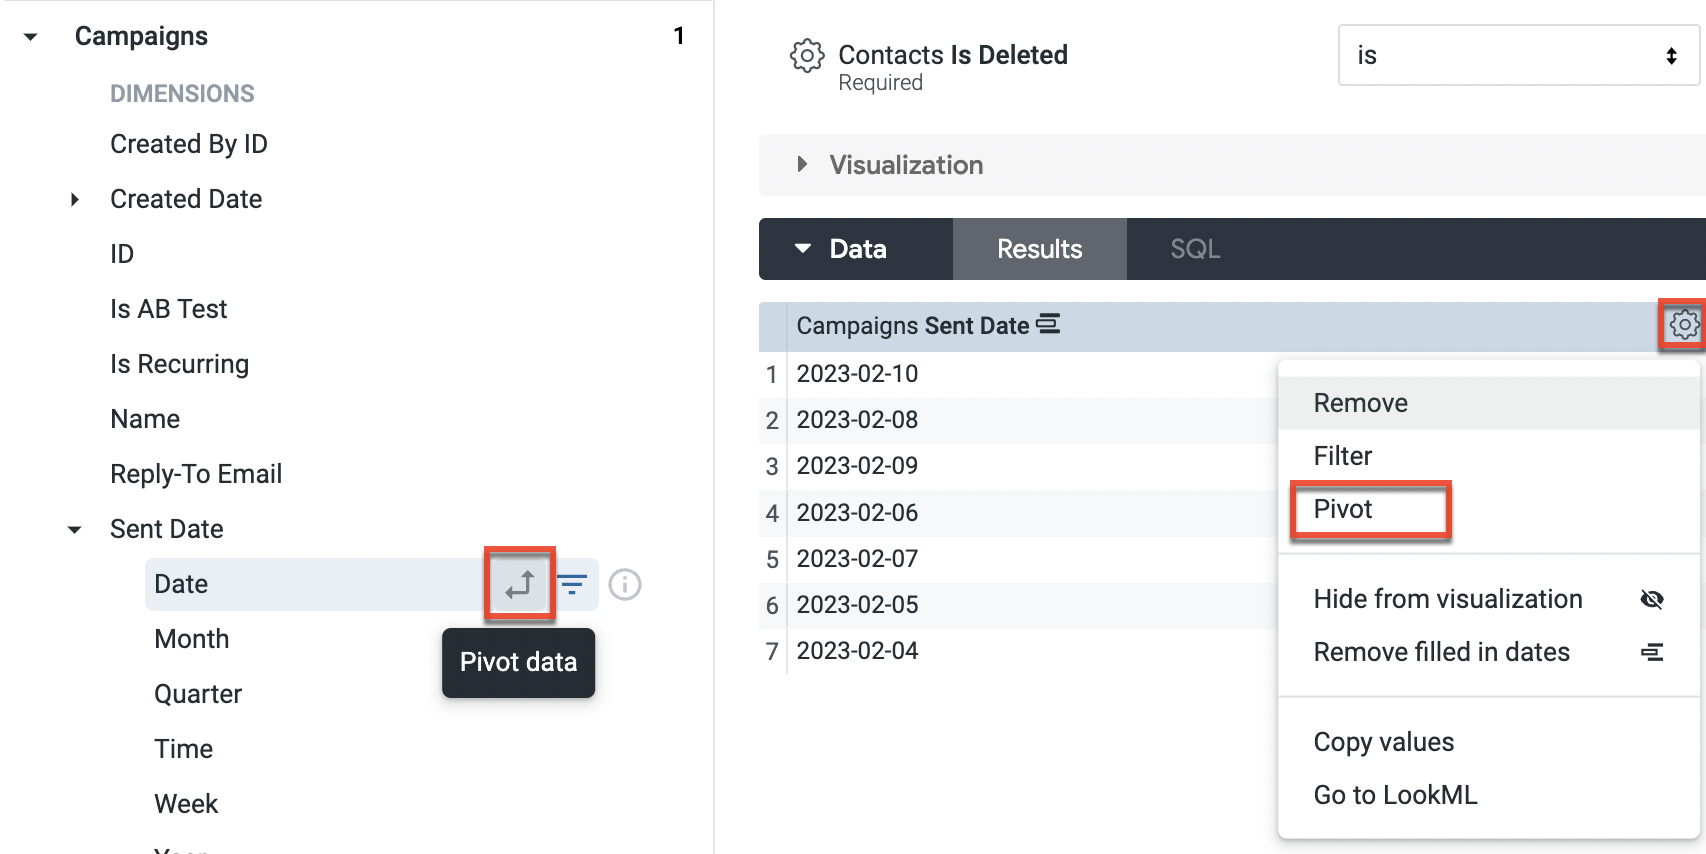
Pivoting Dimensions
You can pivot a dimension to display each value in the dimension as a column. To pivot a dimension you can either click the gear icon in the column of the dimension and select the Pivot option or hover over the field name in the field selection section and click the pivot icon.
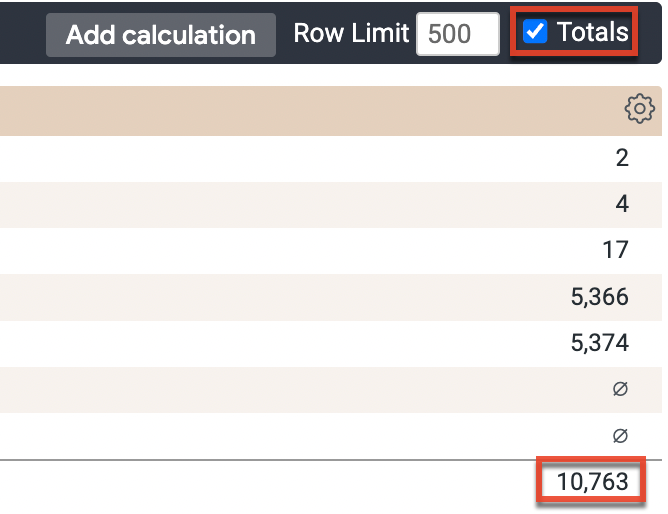
Displaying Measure Totals
To display the total value of a measure column check the Totals checkbox at the top of the Data section of your view.
Limiting Data
You can set a row limit and column limit (if you have pivoted one or more dimensions) using the limit fields at the top of the Data section. 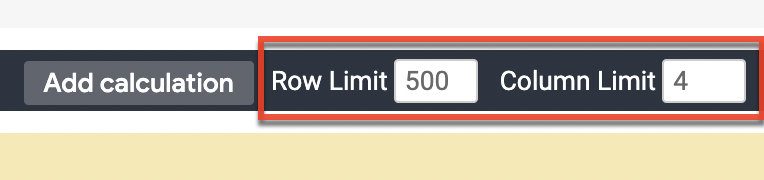
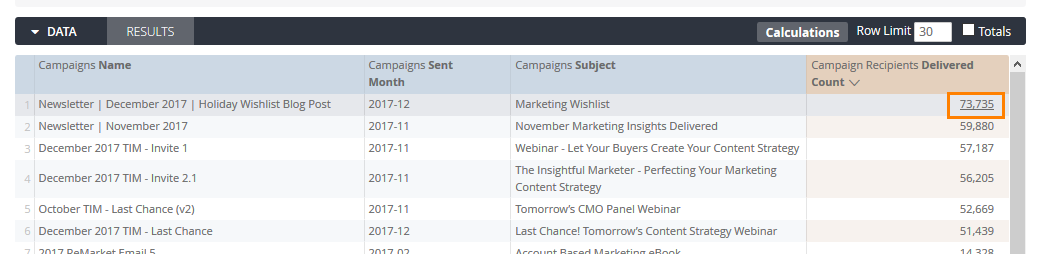
Drilling Down Into Data
You can drill down into any measure or dimension value to see more data in relation to that specific value. To drill down into a measure or dimension value click directly on the value.
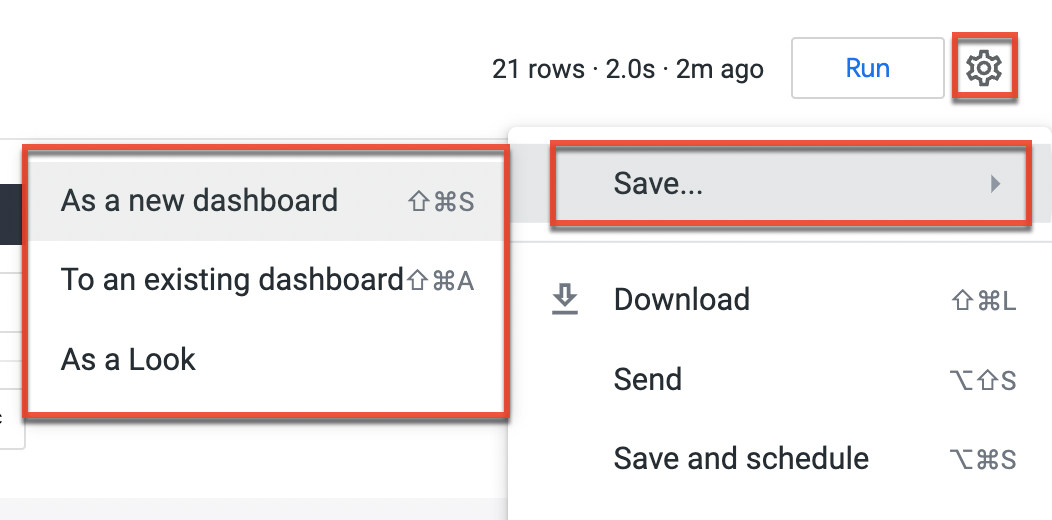
Saving Your Customized View
Once you have customized a view to your liking you can save it as a Look, to a dashboard, or as a dashboard. To save your view click the gear icon at the top right of the Explore view then hover over the Save.. option and then select how you want to save your view.