Datasets Section
Overview
A dataset in Discover is based on a single Sugar module. The dataset is comprised of all the fields from the module. Data is updated on the current snapshot continuously from Sugar. A new snapshot is created at the start of each day leaving previous snapshots for a historical record. The Datasets section in Discover provides access to edit and configure the dataset's fields and calculations.
Prerequisites
To view the Datasets section, you must have access to Discover and have a Discover role of Admin or Report Creator. To make any changes to a dataset, you must have a Discover role of Admin.
Datasets Section Interface
To access the Datasets section, click the Datasets tab in the navigation bar. Any datasets linked to Discover are listed.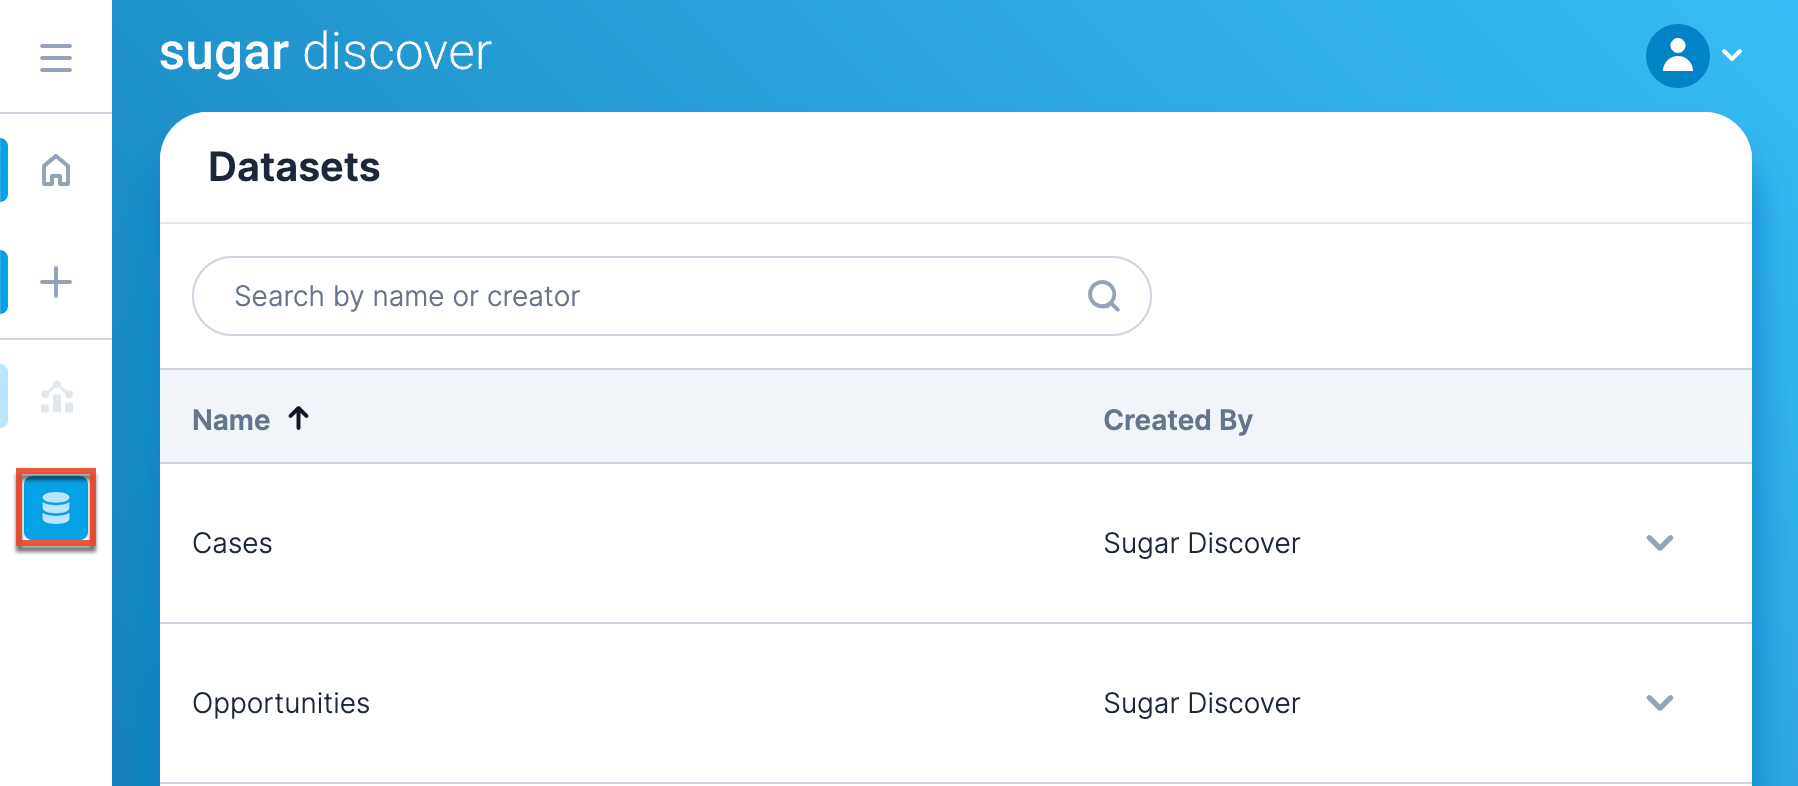
The Datasets Section interface contains a search bar to search through datasets by name or creator, a Name column, a Created By column, and a dropdown menu.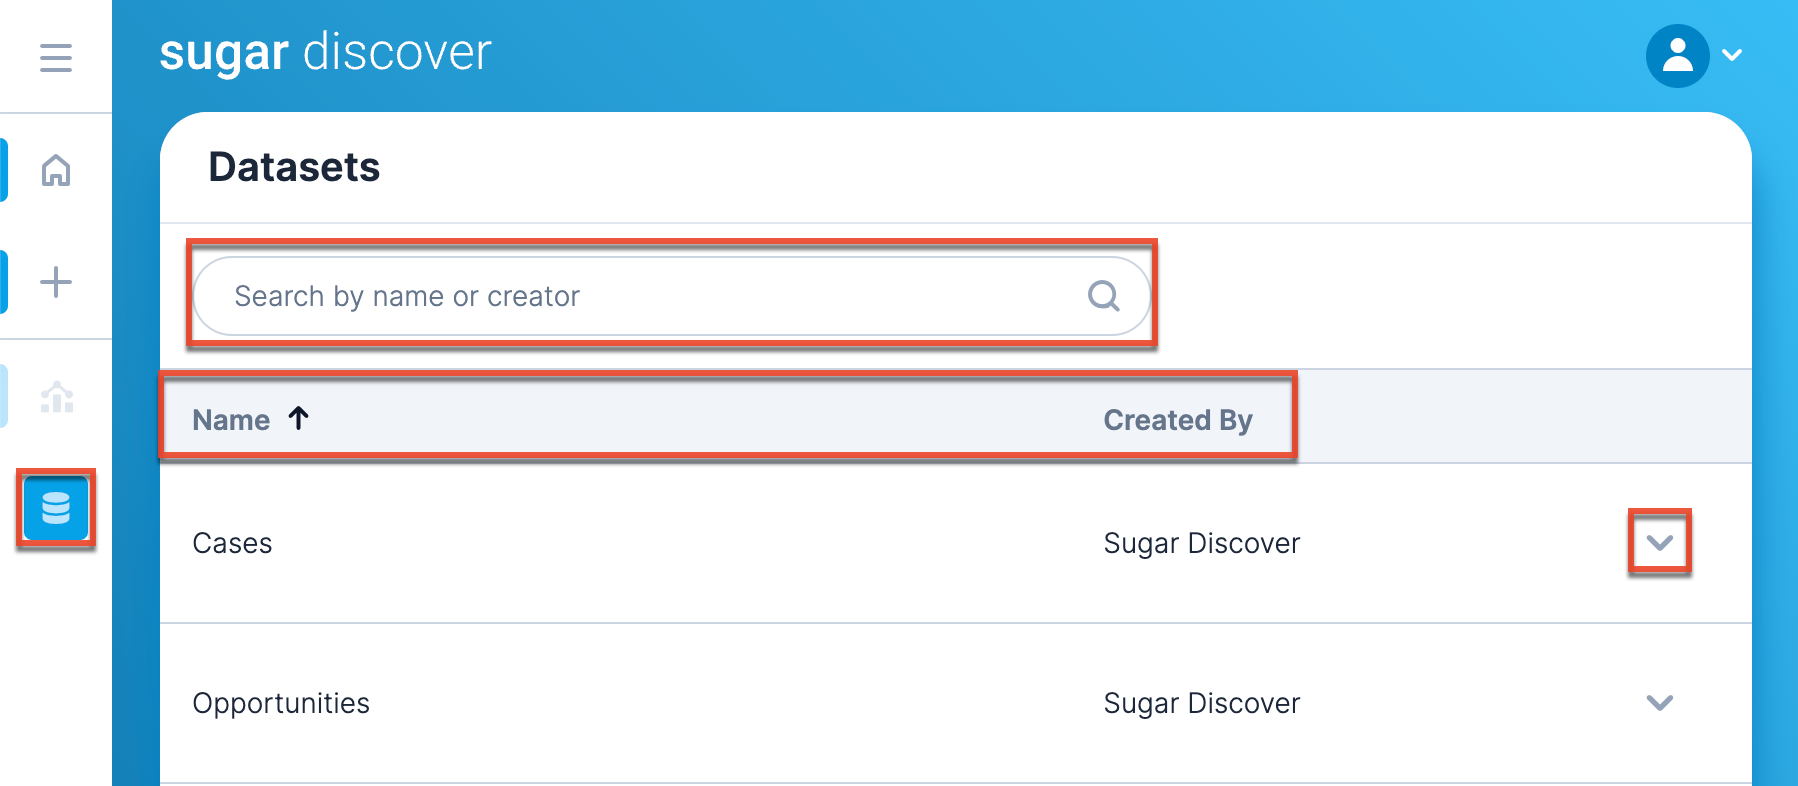
To edit the dataset, click the dropdown menu to the right of the dataset name.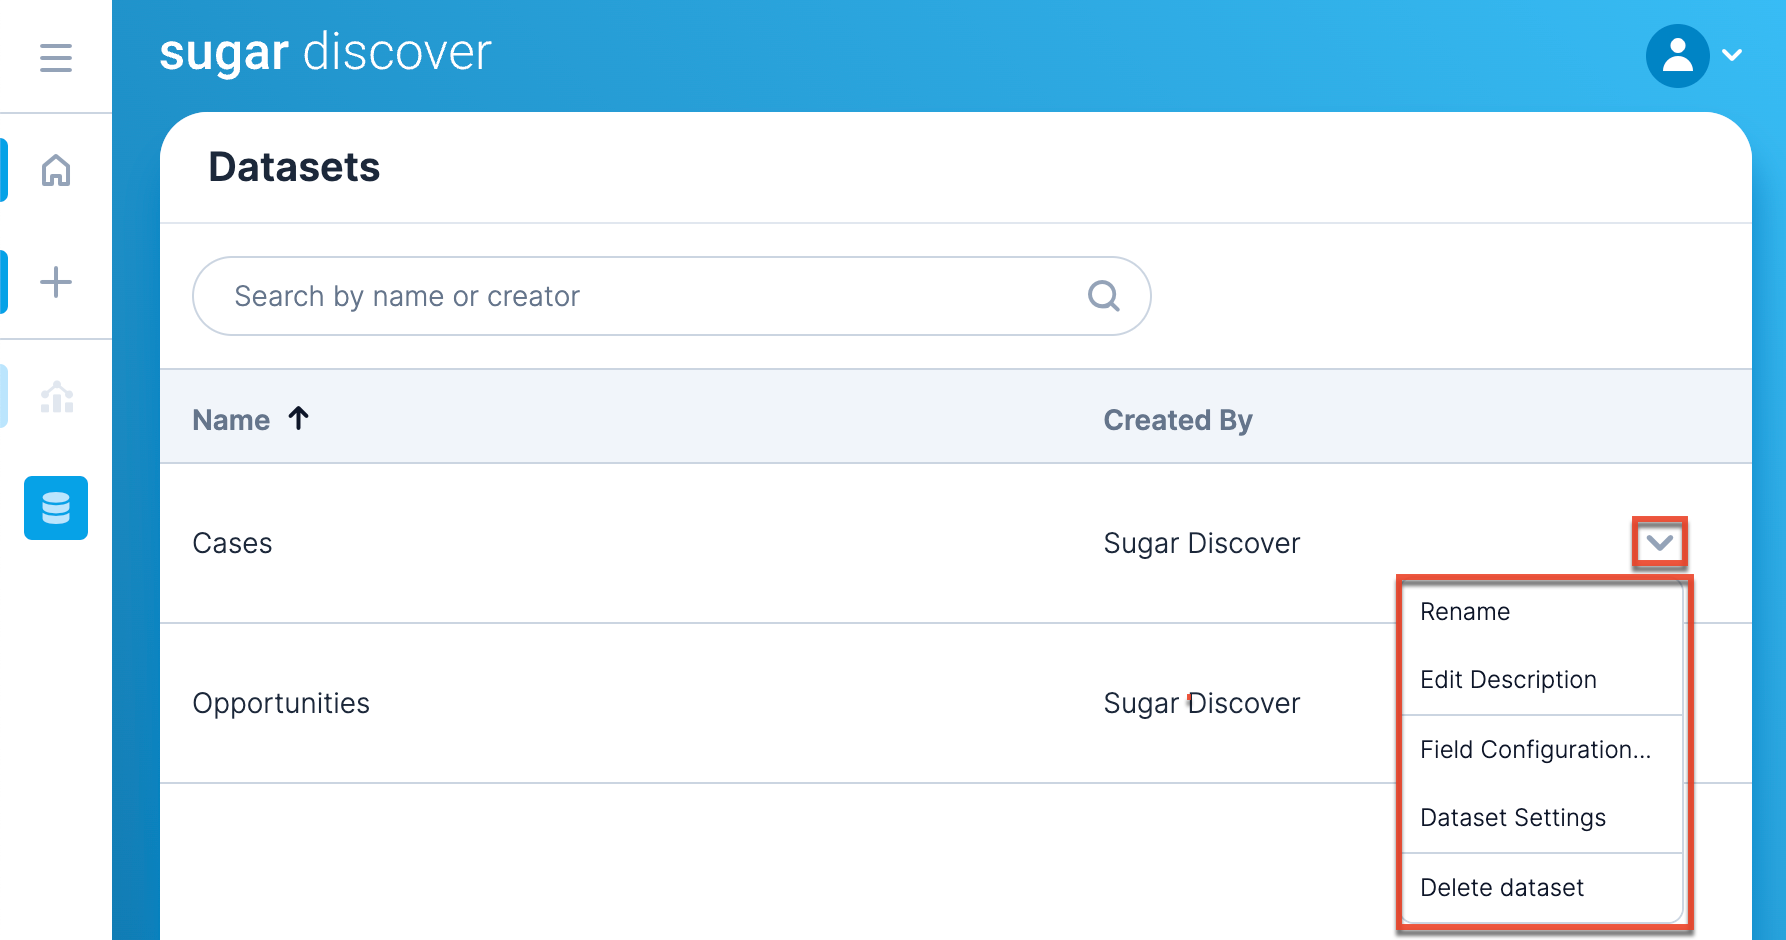
The following options are available for a dataset:
| Option | Description |
| Rename | Rename the dataset. |
| Edit Description | Edit the description of the dataset that appears below the dataset name in the Datasets section. Providing a description is optional. |
| Field Configuration... | Configure dataset fields and calculations. |
| Dataset Settings | Configure the dataset settings. |
| Delete dataset | Delete the dataset. This option is disabled to prevent you from accidentally deleting the dataset. |
Special Dataset Fields
There are special fields defined in each pre-configured SugarCRM dataset allowing you to build certain types of historical comparison reports or analyze data related to stage transitions within opportunities. Understanding these fields is important to understand so that you avoid creating incorrect or misleading results.
Snapshot Date
Discover's technology continually looks for changes at the database level and refreshes Sugar datasets. A new snapshot of the database is created between 12:00 a.m. and 1:00 a.m. in your instance's time zone. The date and time of the snapshot are stored in a field called "Snapshot Date". This field is useful when creating reports in which you want to visualize and compare the state of records at different points in time.
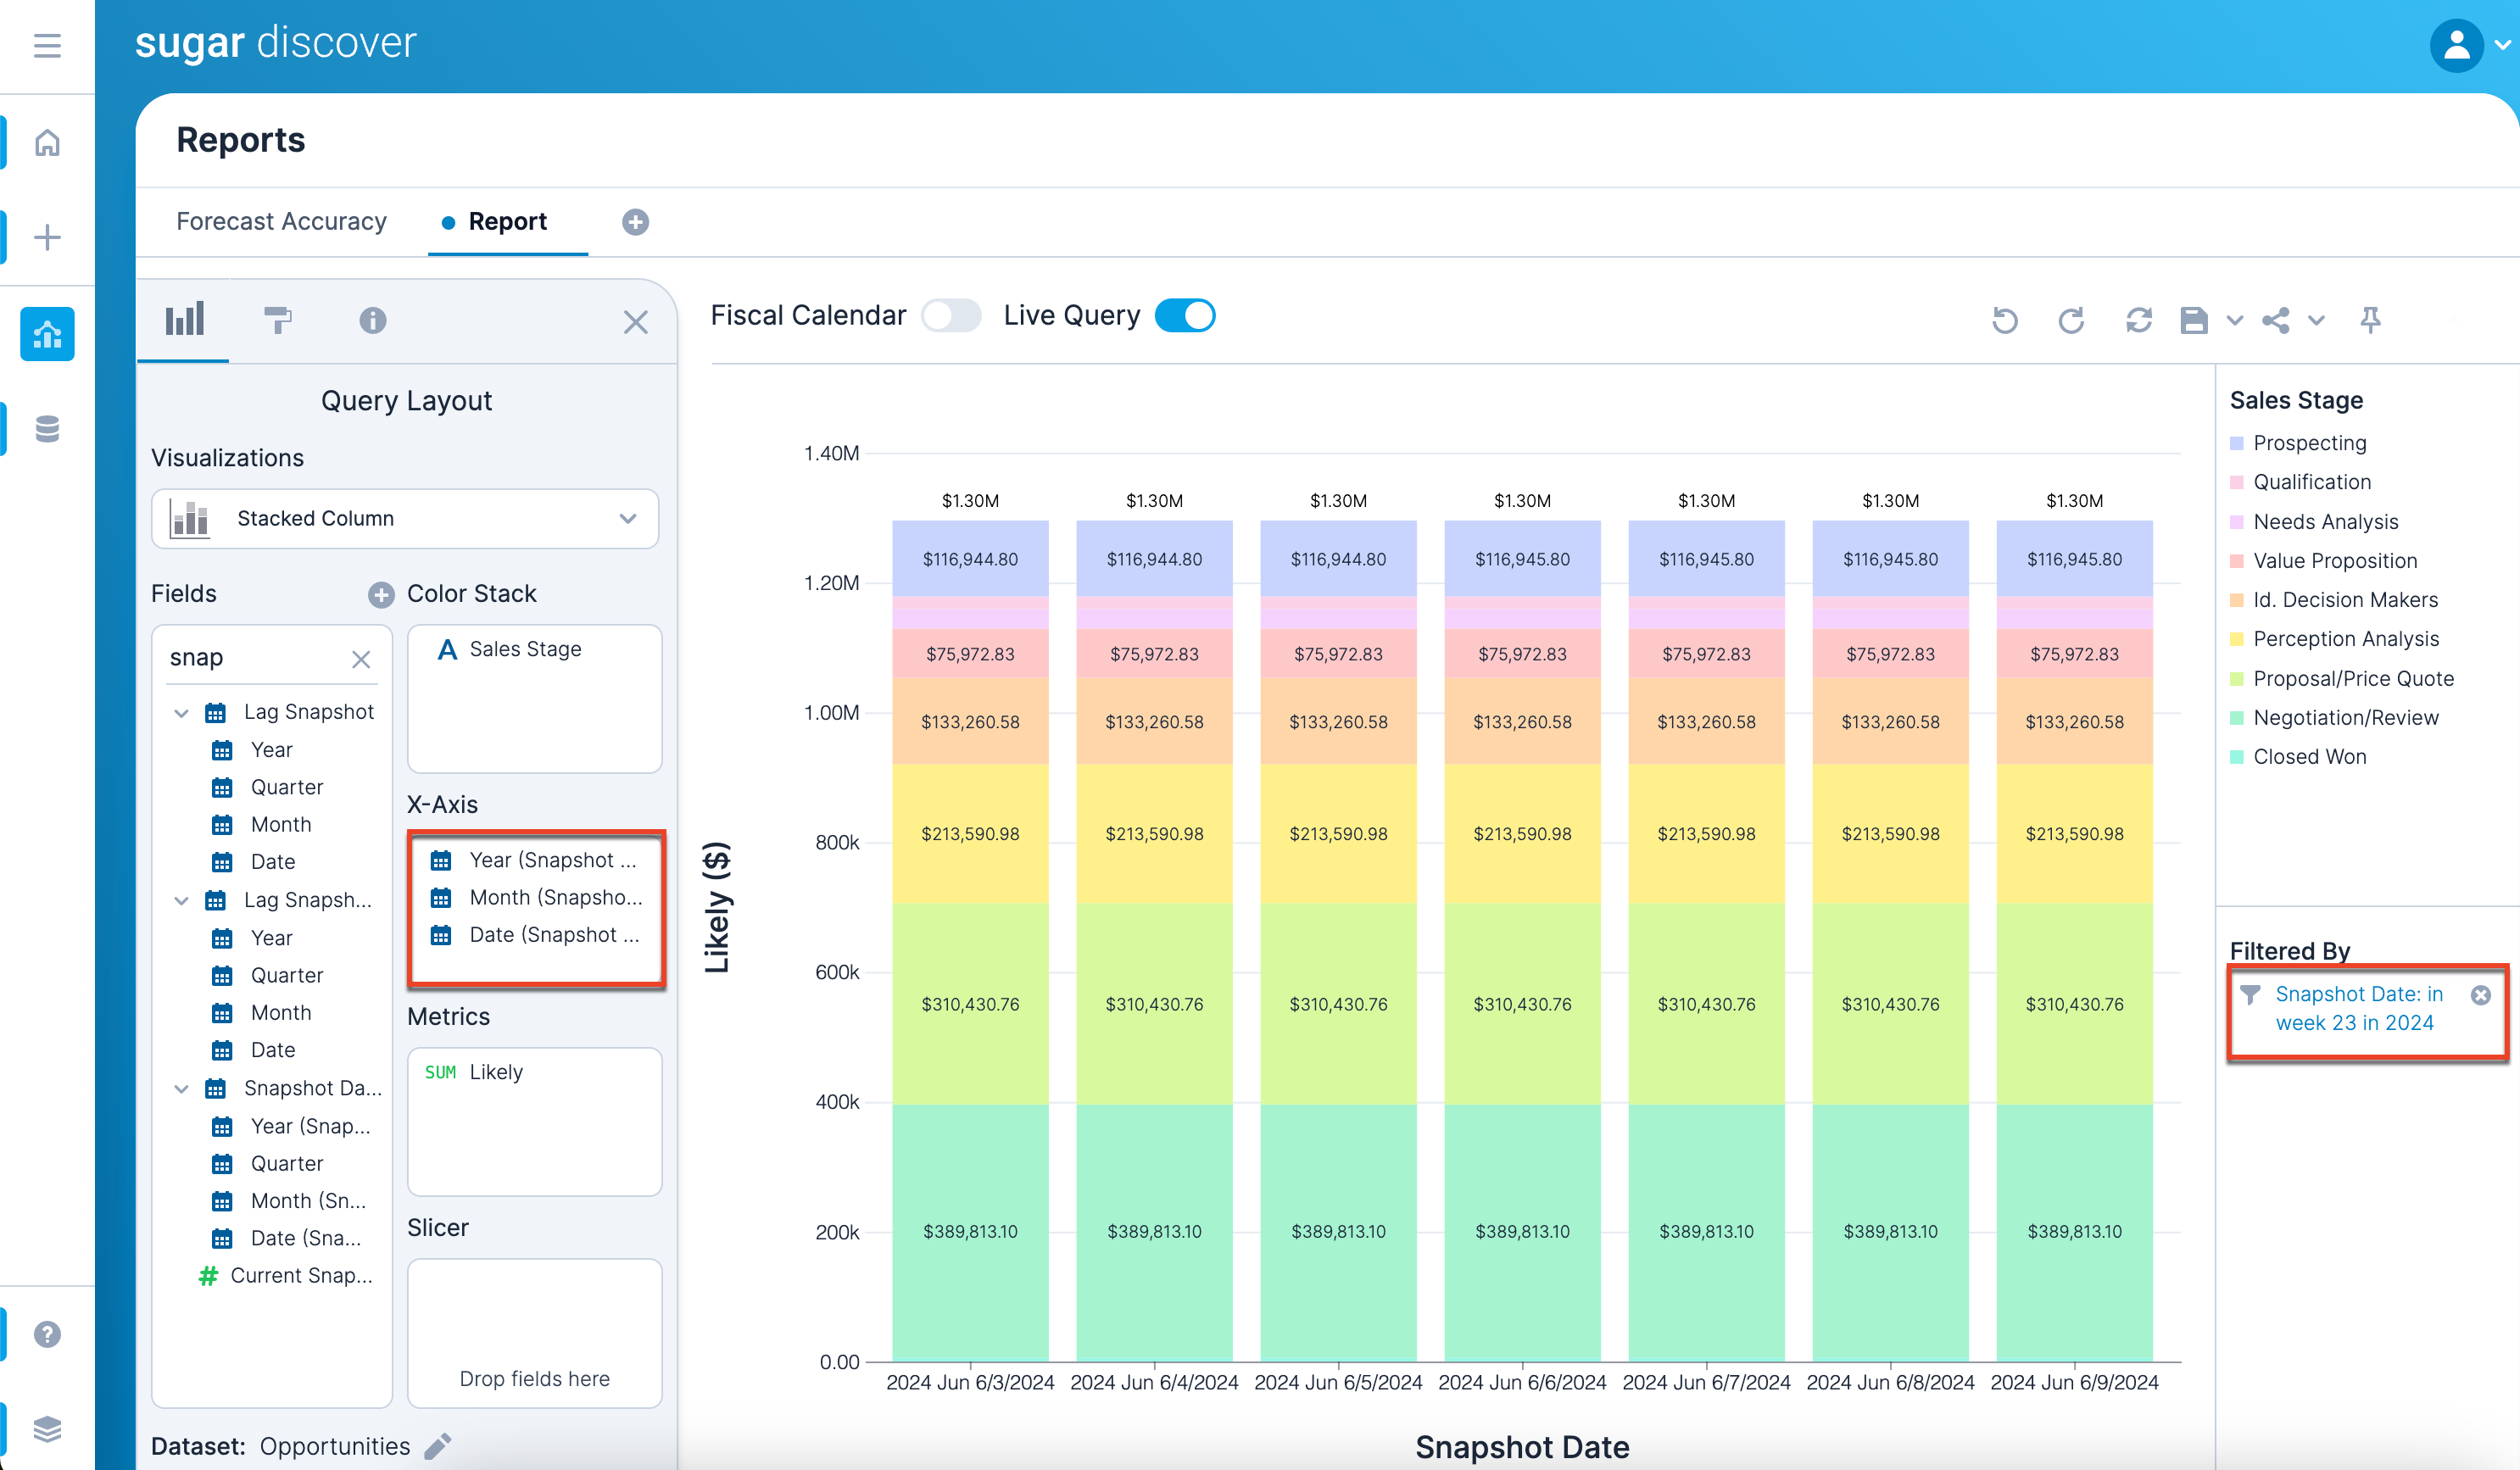
For example, to show the stages of the opportunities over the past two calendar weeks, you would need to use the "Snapshot Date" for the x-axis and filter the data by the snapshot date. This will show how many opportunities were in each sales stage on the specific snapshot date.
 Snapshot Date Filter
The Snapshot Date field captures the date and time a snapshot was taken. If a snapshot date filter is added to a report, the "Filtered By" section displays which snapshot represents the most current data. When creating a new report, a filter with "Snapshot Date = This Day" is added to the report by default so that your default state is to view only the current state of the records. To create a report that compares different states (snapshots) of records or requires access to all snapshots of data (i.e., funnel visualizations), you must manually remove the filter by clicking the x next to the filter in the Filtered By panel.
Stage Transition
The Stage Transition field is used to track which snapshots in your data represent a transition from one stage to another. For example, as Opportunities progress through the sales process, the Stage Transition field tracks when the Sales Stage field changes. This field is useful in cases where you are performing calculations specifically between stage transition events. For example, you want to calculate the time an opportunity spends in a given stage by comparing the Snapshot Date when the opportunity transitioned out of the stage from the date in which it transitioned into the stage.
Dataset Field Configuration
To customize a dataset's fields, select "Field Configuration..." from the drop down menu next to the dataset to open the Field Configuration section.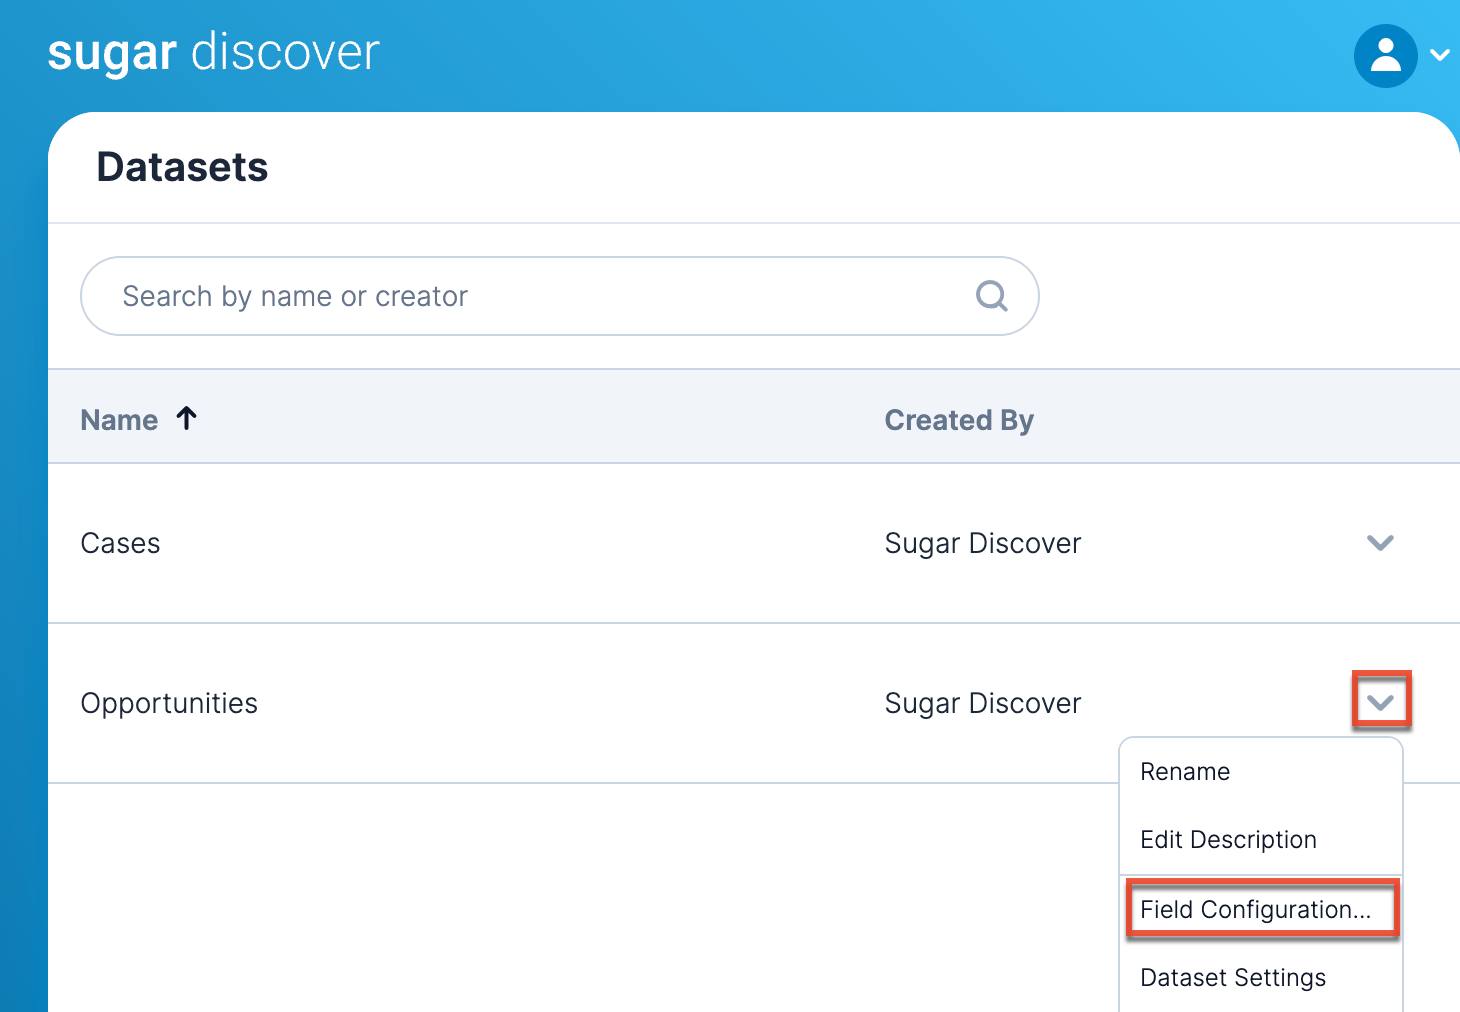
Field List
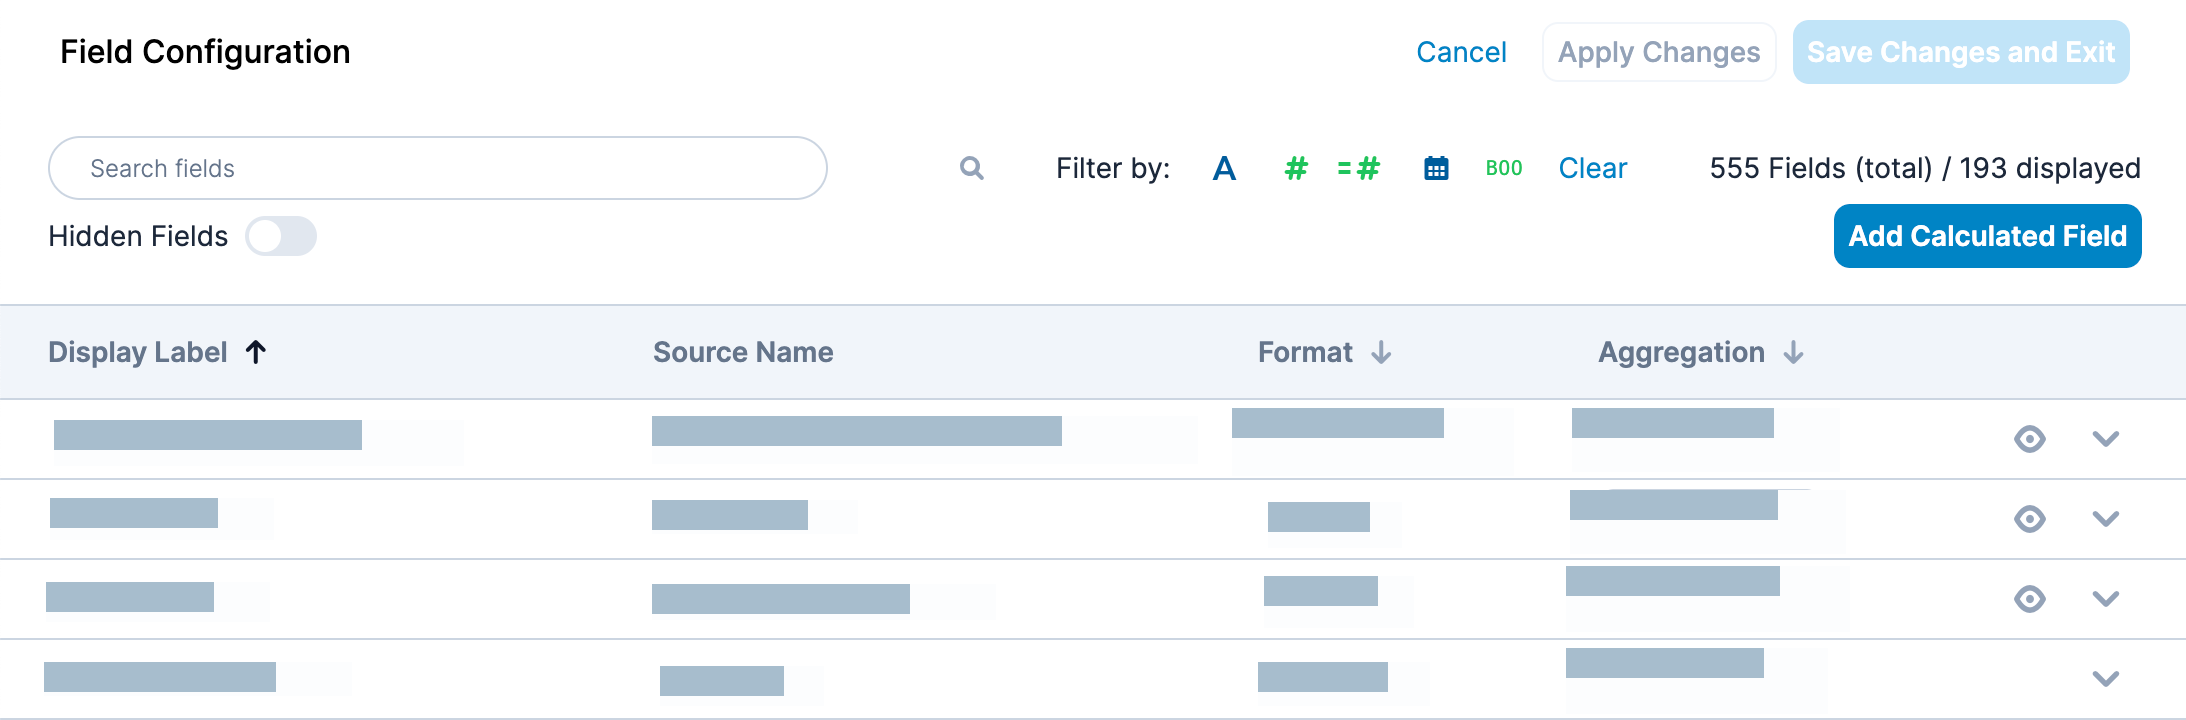
The field list displays the following attributes for each field:
| Column Name | Description |
| Display Label | This is the field name that appears when building and interacting with your reports. To edit the display label, simply click the text in the list to edit it, then hit "Enter". |
| Source Name | This is the field name from Sugar and will match the Field Name for a field in Studio. |
| Format | This specifies how the data values for the field are formatted when viewed in a report. The formatting options vary depending on the field's data type. Note: Custom formatting is available for number fields by selecting "Custom" from the Create Calculated Field screen's Format Type dropdown. |
| Aggregation | This specifies the default aggregation method (e.g., Count, Average) for how to aggregate values when grouped in a report. The aggregation options vary based on the field's data type. You may also override the default aggregation when the field is placed on a shelf of the Query Layout panel. |
To add a new calculated field to the dataset (i.e., a dataset-level calculated field) that can be used for all reports, click the Add Calculated Field button in the top right corner of the screen. For more information on calculated fields, refer to the Reports Section documentation.
Search and Filter Field List
At the top of the Field Configuration screen is a search bar for you to easily search for a field of interest. You can also choose to filter the fields list to narrow your search by clicking on an icon to the right of the search box. Click the icon again or click the Clear button to remove the filter.
| Option | Description |
 |
Show all fields with a format of String. |
 |
Show all fields with a format of Number. |
 |
Show all fields that are calculated fields. |
 |
Show all fields with a format of Timestamp. |
 |
Show all fields with a format of Boolean. |
 |
Show or hide all hidden fields. |
| Clear | Clear the filters. |
Field Actions
When you hover over a field in the list, there are several field actions to the right of the last column. The actions depend on whether the field is a Sugar field or a calculated field.
| Option | Description | Availability |
 |
Click to display additional options. Available options are dependent on if the field is a Sugar field or a calculated field. | Sugar and calculated fields |
 |
Preview the data in the Data Preview panel. | Sugar and calculated fields |
| Field Settings | Configure additional options for the field such as URL linking. | Sugar and calculated fields |
| Hide Field | Hides a field from the list view. | Sugar and calculated fields |
| Edit Calculated Field | Edit the calculation for a dataset-level calculated field. For more information on defining calculated fields, refer to the Reports Section documentation. | Calculated fields |
| Delete Calculated Field | Delete the calculated field. This action cannot be undone once you save your changes. Any reports that contain references to the deleted calculated field will be affected. | Calculated fields |
Once you have made changes to your dataset, click an option at the bottom of the screen to save your changes:
| Option | Description |
| Cancel | Do not save changes that you have made and exit the Field Configuration screen. |
| Apply Changes | Save changes and stay in the Field Configuration screen so that you can continue to make modifications. |
| Save Changes and Exit | Save all changes and exit the Field Configuration screen. |
Any changes you save cannot be undone.
Dataset Settings
To customize a dataset's settings, select "Dataset Settings" from the three-dots menu next to the dataset to open the Dataset Settings screen. In the Dataset Settings screen, you can configure the fiscal calendar and funnel configuration used by your Discover tenant.
Fiscal Calendar
While a calendar year always begins on January 1 and ends on December 31, a fiscal year can start and end at any point during the year as long as it comprises a full 12 months. A company that starts its fiscal year on January 1 and ends it on December 31 operates on a calendar year basis. Some companies opt to follow a fiscal year instead of a calendar year because their fiscal year better fits their natural business cycles. For example, ending the fiscal year in January gives retailers a more accurate financial picture to report. Seasonal businesses also tend to use fiscal years for accounting purposes.
Discover makes reporting based on a fiscal calendar easy by relying on the dataset to provide the rules for the fiscal calendar year. Once enabled, users can simply enable this functionality on the report to apply the Fiscal Calendar to the following component areas: Date Filters, Calculated Fields, Visualizations, and Discovery Insights.
In the Fiscal Calendar section, choose the fiscal calendar year start date using the date picker. While it is typical for the first day of the month to be chosen, any day can be used as the start date. Then choose whether to display the fiscal year based on the start or end of the month. For example, if your fiscal year is chosen to begin on February 1, 2023, your fiscal year spans from February 1, 2023 to January 31, 2024. If you choose to display the fiscal year based on the start month, the first fiscal year will be reported as 2023. If you choose to display the fiscal year based on the end month, the first fiscal year will be reported as 2024. Click "Apply Changes" to save changes without exiting, or "Save Changes and Exit" to save changes and return to the Datasets section.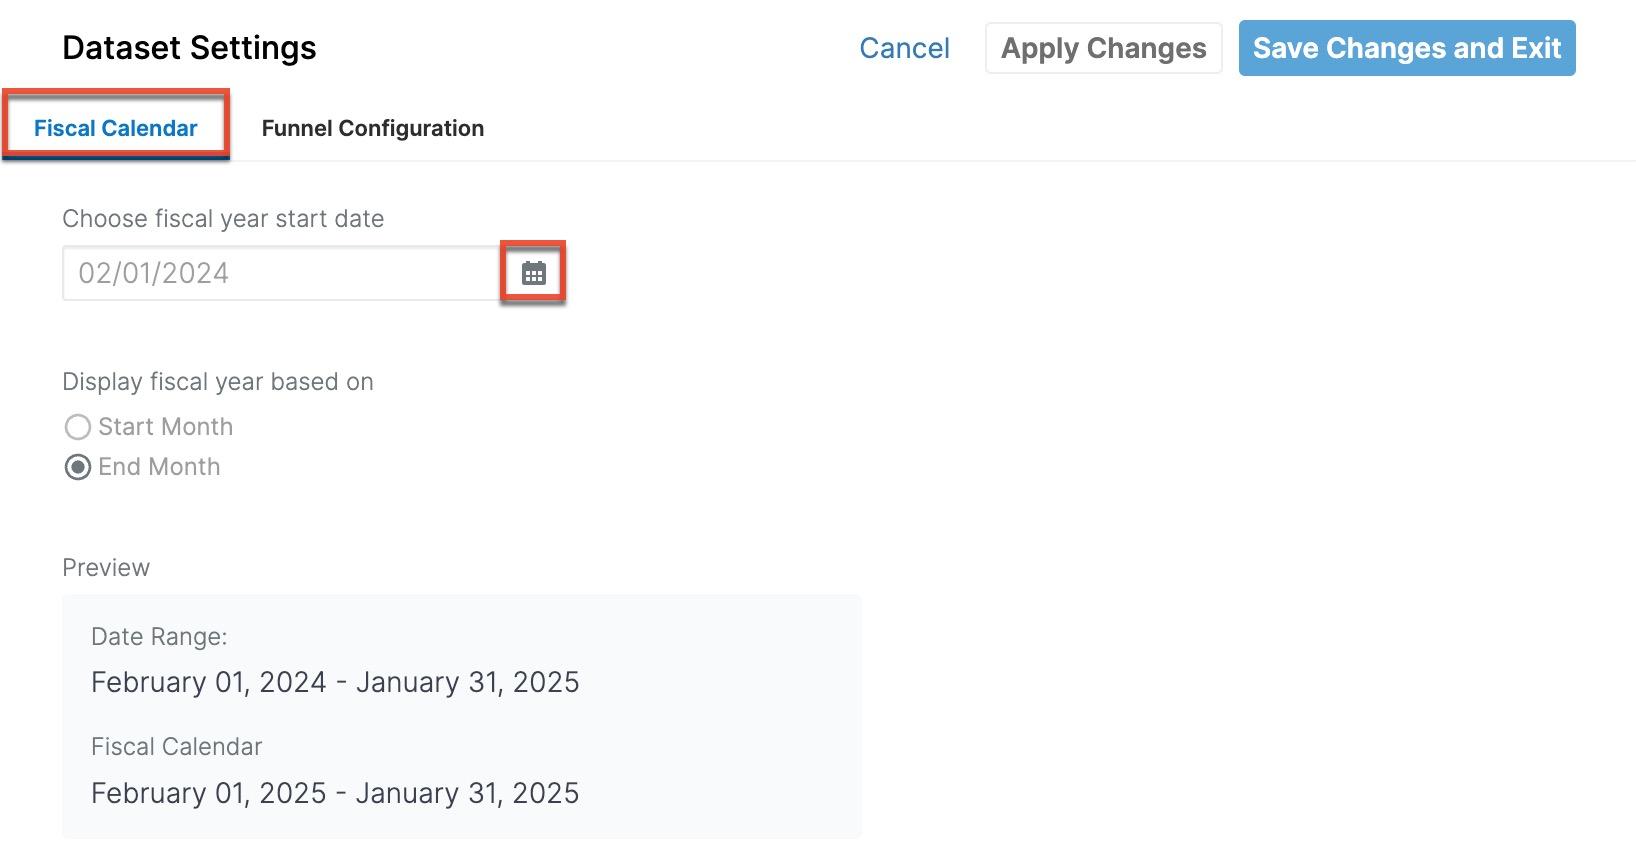
Funnel Configuration
The funnel visualization contains unique calculations such as Average Cycle Time and Average Days in Stage. These calculations rely on the date that a record is created and closed, as well as the ID. By default, the field called Date Created is used for the created date, the field called Expected Close Date is used for the end or close date, and the field called ID is used for the record ID. If you would like to base calculations on different fields, you will have to edit the funnel configuration settings.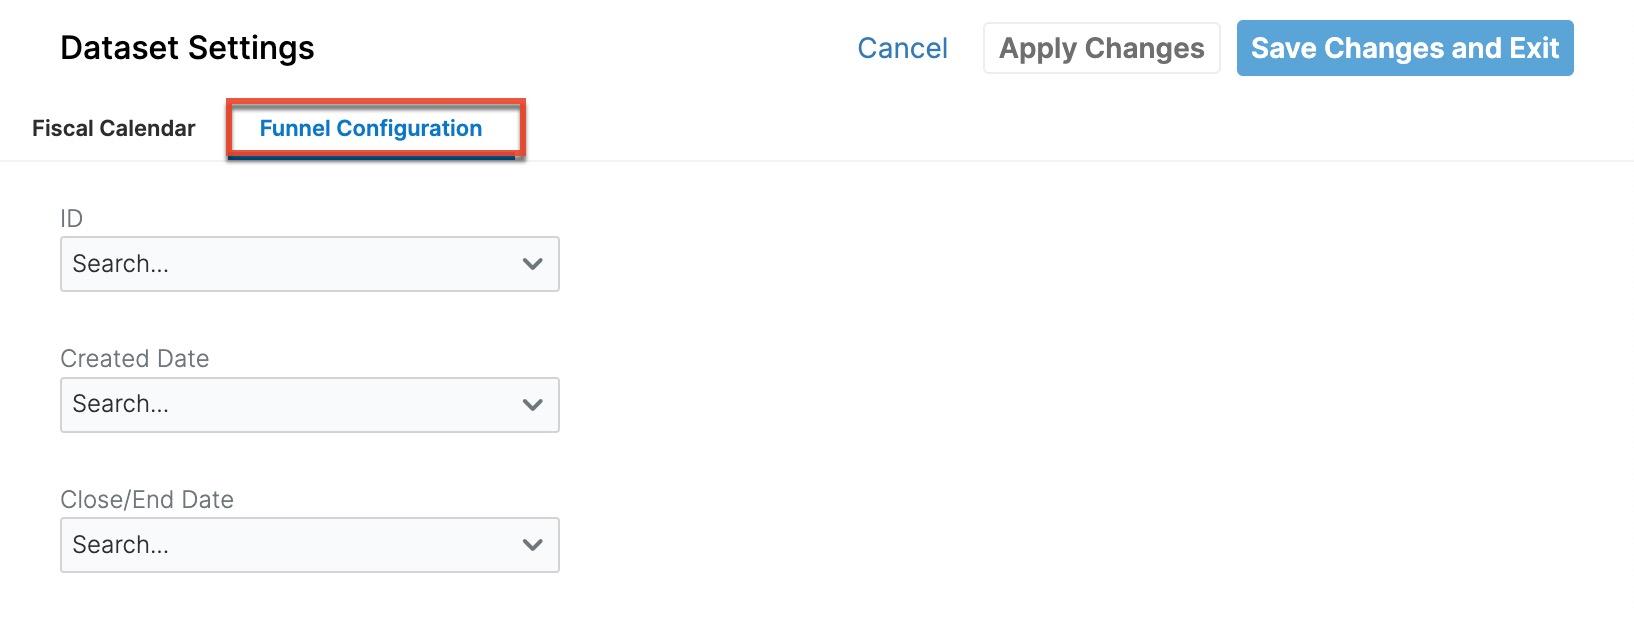
In the Funnel Configuration section, select which field to use for each of the values. If the dropdowns display "Select", it means the default values are being used.